C
C
|
E
E
|
D
D
|
L
L
|
A
A
|
S
S
Centro de Estudios
Distributivos, Laborales y Sociales
Maestría en Economía Universidad Nacional de La Plata
Labor Informality in Latin America and the
Caribbean: Patterns and Trends from Household
Survey Microdata
Leonardo Gasparini y Leopoldo Tornarolli
Documento de Trabajo Nro. 46
Febrero, 2007
Labor Informality
in Latin America and the Caribbean:
Patterns and Trends from Household Survey Microdata
*Leonardo Gasparini ** Leopoldo Tornarolli
CEDLAS***
Universidad Nacional de La Plata
1.
Introduction
Most unskilled workers in Latin America and the Caribbean are informal. They work in low-productivity jobs in marginal, small-scale, and often family-based activities. They are self-employed or salaried workers in small, precarious firms without a signed contract in compliance with labor regulations, and without access to protection against health and unemployment shocks, to savings for old age, to employment protection and to labor related benefits. In fact, that is also the labor condition for a sizeable share of skilled workers in the region.
This situation does not seem to be the consequence only of economic stagnation. Despite a positive performance during some periods, most Latin American and Caribbean (henceforth, LAC) countries have not experienced increases in the share of workers in the formal sector. The rate of creation of quality employment in the region was low, compared to other growing economies in the rest of the world. Labor informality remains a pervasive characteristic of labor markets in LAC.
Academics, policy-makers and commentators have extensively argued about the size of the informal sector, its welfare implications and the adequate policy prescriptions. The debate, however, is often obscured by the fact that the term “informality” is ambiguous
* This paper started as a contribution to the World Bank LAC Flagship Report “Informality in Latin
America and the Caribbean”. We are very grateful to the encouragement and comments of Omar Arias, Jaime Saavedra, Bill Maloney, and Jamele Rigolini. All the statistics were computed at CEDLAS-UNLP by the authors and Georgina Pizzolitto, Francisco Haimovich, Victoria Fazio, Julieta Pron, Pablo Gluzmann, Ana Pacheco, Hernán Winkler, Matías Horenstein, Evelyn Vezza, Javier Ibarlucia, Elena Cadelli, Rocío Carbajal, Sergio Olivieri, Gimena Ferreyra and Rafael Brigo. We are especially grateful to the excellent research assistance of Carolina García Domench. The usual disclaimer applies.
** Corresponding author. E-mail: [email protected]
*** CEDLAS is the Center for Distributional, Labor and Social Studies at Universidad Nacional de La
from a theoretical point of view, and difficult to implement empirically. Informality usually means different things to different people. Also, discussions are often based on specific country experiences, failing to take a more global LAC perspective.
This paper makes a contribution to the analysis of informality in Latin America and the Caribbean by presenting evidence on the main patterns and trends of alternative definitions of labor informality. The evidence is based on microdata from a large set of more than 100 household surveys covering the period 1989-2005.
The rest of the paper is organized as follows. Section 2 discusses the concept of labor informality and the alternatives to empirically estimate it. Section 3 is the core of the chapter, as it presents the main patterns and trends of informality in the region. In section 4 we look at wages and hours of work of informal workers. In particular, we provide estimates of the conditional wage gap of being informal. Section 5 takes a look at changes in informality over the business cycle to assess whether informal employment moves pro or anti-cyclically with the economy and relative wages across sectors. Section 6 is aimed at characterizing changes in informality. In particular, we assess the relevance of changes in the structure of employment as a factor behind changes in informality. In section 7 we carry out some counterfactual simulations to characterize the differences in informality across countries. Section 8 closes with some brief concluding comments.
2.
Measuring labor informality
There are at least two different concepts that are referred by the term labor informality.1 The “productive” definition pictures informal workers as those in low-productivity, unskilled, marginal jobs, while the “legalistic” or “social protection” definition stresses the lack of labor protection and social security benefits.2 It is important to make clear from the outset that the definitions do not correspond to competing views about informality, with different welfare implications and policy prescriptions. Instead, they refer to different phenomena in the labor market. The productive definition is concerned with the type of job (e.g. salaried vs. self-employed, large vs. small firms), while the legalistic definition is concern with the compliance of the labor relationship with some rules, mainly labor protection. We follow the tradition of using the same term informality to refer to these two different aspects of the labor market.
The “productive” view classifies as informal those workers in low-productivity jobs in marginal small-scale and often family-based activities. ILO (1991) defines the informal sector as economic units “with scarce or even no capital, using primitive technologies and unskilled labor, and then with low productivity”. Maloney (2004) includes in the informal sector the “small-scale, semi-legal, often low-productivity, frequently family-based, perhaps pre-capitalistic enterprises”.
Naturally, it is very difficult to empirically implement this notion, since things like “productivity” are unobservable, others like “capital endowment” are not usually
1 See Fields (1990), Portes and Schauffler (1993), Pradhan and van Soest (1995), Saavedra and Chong
(1999), Maloney (1999), Guha-Khasnobis et al. (2006) and Henley et al. (2006) for surveys and
discussions.
2 In recent volume, Guha-Khasnobis, Kanbur and Ostrom (2006) also link informality to the degree of
reported in surveys, and others like “marginal”, “pre-capitalistic activities” or “primitive technologies” are difficult to define. In practice researchers have tried to adjust this notion of informality to the information usually contained in surveys. Hence, the empirical implementation of informality has been linked to (i) the type of job (salaried, self-employment), (ii) the type of economic unit (small, large, public sector), (iii) and the worker’s skills. Following this practice we divide the working population into seven groups: (1) Entrepreneurs (patrones), (2) Salaried workers in large private firms, (3) Salaried workers in the public sector, (4) Salaried workers in small private firms, (5) Skilled self-employed, (6) Unskilled self-employed and (7) Zero-income workers.
To implement this classification we include as unskilled all individuals without a
tertiary or superior education degree, and we define as small all firms with 5 or fewer
employees.3 Given that an individual could have more than one job, we apply the
classification only to his/her main occupation. We implement the following definition of labor informality:
Definition 1 (productive definition): An individual is considered an informal worker if (s)he belongs to any of the following categories: (i) unskilled self-employed, (ii) salaried worker in a small private firm, (iii) zero-income worker.
Labor informality is closely related to employment. However, we exclude the self-employed with a tertiary degree from the group of informal workers. The group of skilled self-employed is mainly comprised by professionals and technicians usually with high productivity and fully incorporated into the modern economy. In fact, the professional self-employed is the group with the highest earnings in most countries in the region (see section 4). Following a standard practice, we include salaried workers in small firms into the definition of informality. The assumption, which of course is debatable, is that most salaried workers in those firms operate using primitive technologies and with low productivity. In fact, many of these small firms are run by individuals who declare themselves being self-employed. Finally, we also add the group of zero-income workers into the informal sector. Household surveys in the region have this category to include mostly family workers, i.e. individuals who perform some activity in a family-based enterprise but who are not formally paid for that job.
The inclusion of patrones (entrepreneurs/employers) into the formal sector is debatable, since in practice some of them are just self-employed in a low-productivity activity using scarce capital and some few unskilled workers. There are two practical problems regarding this group: (i) it is difficult (probably impossible) in theory to set a line separating out the entrepreneurs from just the self-employed employing some workers, and (ii) even when we attempt to do it, there are some data limitations. For instance,
most surveys do not report the number of employees working for a patrón. We have
decided to include the patrones into the formal sector following a usual practice, and because earnings in that group are much higher than for the self-employed in all LAC countries.4
This discussion confirms that the productive definition of labor informality is theoretically weak and empirically difficult to implement. However, it has lasted for
3 Given differences in surveys, the cut-off point is not 5 employees in all countries. See our companion
paper (Gasparini and Tornarolli, 2006) for details.
4 Gasparini and Tornarolli (2006) show that most results are robust to the change in the classification of
decades and it is extensively used in the academic and policy debate, because it refers, although in an ambiguous way, to a relevant characteristic of the labor markets in Latin America.
Although having statistics (and hence a definition of) labor informality is sometimes useful, in many of the following sections we work with the seven categories defined above separately. For many uses the binary formal/informal definition implies too much aggregation. Also, in some cases we find useful to stress the distinction self-employed-salaried workers, instead of the formal-informal grouping discussed above.
A second strand of the literature has stressed the “legalistic” or “social protection” notion of informality. Informal firms are those not complying with the norms in terms of labor contracts, labor taxes, and labor regulations, and then their workers have no rights to labor protection or social benefits linked to employment. ILO (2002) defines an informal worker as one “whose labor relationship is not subject to labor legislation and tax rules, and has no access to social protection or right to certain labor benefits”.5 This second notion is also difficult to implement. There are at least two severe problems. The first one arises from the fact that the number of dimensions to be included under labor protection and social security is large and varies across countries. Labor protection includes contracts, severance payments, advance notice, right to be unionized, workplace safety, vacations, working hours and many more. Social security includes pensions, health insurance, unemployment insurance and other insurances and benefits. Countries differ in the extent of their labor protection and social security systems. Moreover, even in a given country regulations and social security rights differ by sector, by tenure, or other work characteristics, and change over time. Therefore, it is difficult in theory to come up with a legalistic definition of a formal worker that is suitable for all countries and situations.
The second problem is practical. Even if we agree to a simple definition of an informal worker (e.g. signed contract and right to pensions when retired), household surveys widely differ in terms of coverage of labor protection and social security issues. Some surveys ask about contracts and some do not. The type of questions aimed at capturing the right to health insurance is very different across countries, and in some cases it is impossible to know whether health insurance is linked to employment. The coverage on severance payments and unemployment insurance is very low, while the questions on insurance for accidents in the workplace are almost inexistent. In fact many LAC countries do not have comprehensive systems of insurances on many risks (including unemployment), so the National Statistical Offices do not include questions on these issues.
The right to receive a pension when retired is the social security benefit most asked in LAC household surveys. However, not all countries have questions on this item, and in those that have, questions are different. Moreover, in most countries the questions apply only to salaried workers, leaving all the self-employed as missing. In this paper we implement the following legalistic/social-protection definition of informality:
Definition 2 (legalistic or social protection definition): A salaried worker is informal if s(he) does not have the right to a pension linked to employment when retired.
5 See also Merrick (1976), Portes
Table 2.1 shows the specific social-protection definition of labor informality adopted in each country with relevant information in its household survey.
The productive and social protection definitions of informality are surely highly correlated. However, as mentioned above, we do not keep one and discard the other in this study, since we are interested in the two definitions for different conceptual reasons. The next section shows statistics on both definitions and discusses the possible overlapping.
3.
Labor informality: patterns and trends
In this section we document the structure and patterns of informality under the two definitions discussed above. But first we introduce the source of information for our study.
3.1. The data
All the statistics in this paper are obtained by processing microdata from household
surveys, and are part of the Socioeconomic Database for Latin America and the
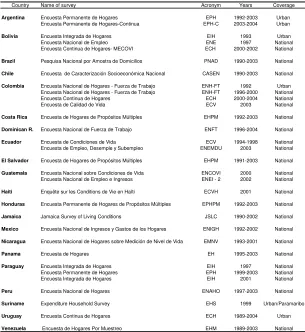
Caribbean (SEDLAC), jointly developed by CEDLAS at the Universidad Nacional de La Plata and the World Bank’s LAC poverty group (LCSPP). The SEDLAC contains information on more than 100 household surveys in 21 LAC countries. Table 3.1 lists the surveys used in the study. The sample covers all countries in mainland Latin America, and four of the largest countries in the Caribbean (Dominican Republic, Haiti, Jamaica and Suriname). In each period the sample represents around 93% of LAC total population. Most household surveys included in the sample are nationally representative. The three exceptions are Argentina and Uruguay, where surveys cover only urban population which nonetheless represents more than 85% of the total population in both countries, and Suriname, where the survey is restricted to the city of Paramaribo (around 50% of the population of the country).
Household surveys are not uniform across LAC countries. The issue of comparability is of a great concern. We have made all possible efforts to make statistics comparable across countries and over time by using similar definitions of variables in each country/year, and by applying consistent methods of processing the data. However, perfect comparability is far from being assured. A trade-off between accuracy and coverage arises. The particular solution adopted contains an unavoidable degree of arbitrariness. We tried to be ambitious enough to include all countries in the analysis, and accurate enough so not to push the comparisons too much. In any case, we provide the reader with relevant information to assess the trade-offs.6
3.2. Informality I (“productive” definition)
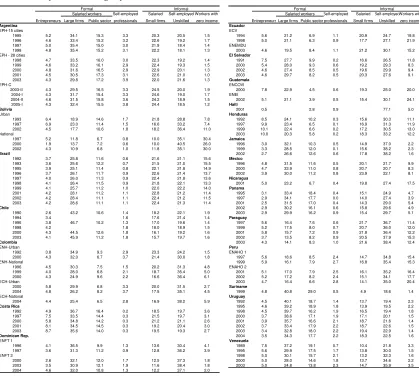
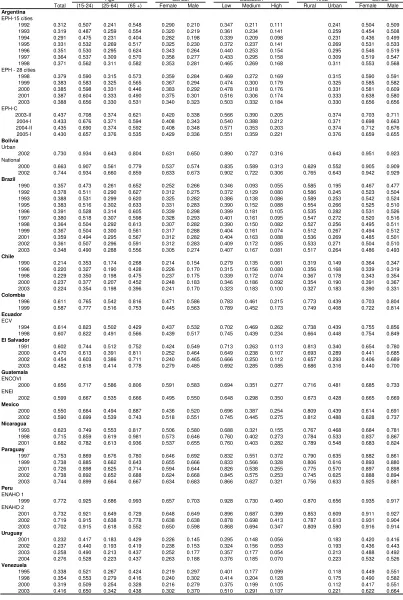
Table 3.2 reports information on the share of workers in each of the seven categories defined above according to the type of work. Although the employment structures are roughly similar across countries, there are some relevant differences. Several countries have around 30% of their workers in large firms. That share is lower in less developed and more rural countries. Public sector employees are more than 10% of the labor force in the most developed countries of the region: Argentina, Brazil, Chile, Costa Rica,
Dominican Republic, Mexico, Panama, Uruguay and Venezuela.7 Self-employed professionals are a minority in LAC. Only in Argentina, they represent more than 3% of total employment. In contrast, the unskilled self-employed are a sizeable group in all countries. In fact it is the largest group in Bolivia, Colombia, Dominican Republic, Ecuador, Guatemala, Haiti, Honduras, Nicaragua, Paraguay, Peru and Venezuela. More rural countries have a large size of their population as zero-income workers. That is the case of Bolivia, Ecuador, Guatemala, Honduras, Jamaica, Nicaragua, Paraguay and Peru.8
Figure 3.1 shows a substantial dispersion in informality rates across countries. While the share of informal workers according to the productive definition is above 70% in Bolivia and Paraguay, the corresponding share is below 40% in Chile. Labor informality seems negatively related to per capita GDP (at PPP) and positively related to the share of rural population in the survey (figure 3.2). However, when including both variables in a simple OLS regression, the latter becomes non-significant.
Labor informality has increased in the region (see table 3.3). Only Brazil and Chile have experienced drops in the share of informal workers. In the rest of the countries, informality either increased or did not significantly change. Colombia, Honduras, Panama, Paraguay, Peru, Uruguay and Venezuela seem to have experienced a sizeable increase in the share of informal workers, according to the productive definition. That has occurred mainly in correspondence with a fall in the share of workers in large firms. The share of informal workers have not changed much in Argentina, Bolivia, Costa Rica, Dominican Republic, Ecuador and El Salvador.
The conclusions are similar when restricting the analysis to urban areas. In fact, in most countries the performance of the rural areas in terms of labor informality changes was not worse than that of urban areas, while in some countries rural areas did better (e.g. Brazil, Costa Rica, Nicaragua and Paraguay).
The probability of being informal is decreasing in the worker’s education (table 3.3). Figure 3.3 shows non-parametric estimates of the profiles informality-years of education for all countries in the sample. In all cases the relationship is decreasing and concave (for both definitions of informality). Instead, the profile for age has a U shape (figure 3.4). Again, that seems to be true for all countries and both informality definitions. People aged between 35 and 40 years are the least likely to be informal. Figure 3.5 shows relative employment and wages of the self-employed compared to the wage earners for the sample of those workers without a tertiary degree living in urban areas. The figures may be consistent with the idea of voluntary self-employment (Balán et al. (1973), Maloney (2004)). Unskilled young people enter the labor market as wage earners, accumulate knowledge, capital and contacts, and then set up their own informal businesses.
7 That happens also in the city of Paramaribo (the only city included in the household survey of
Suriname).
8 The employment structure does not dramatically change when restricting the analysis to only urban
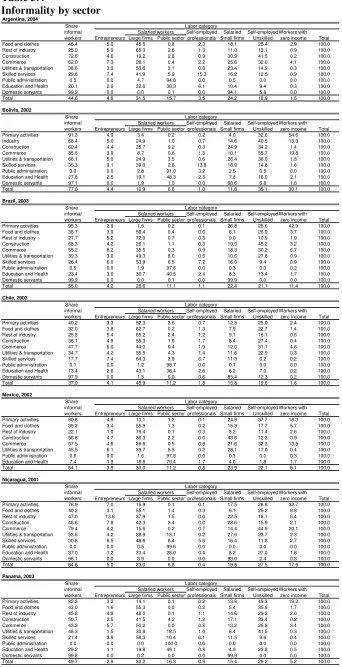
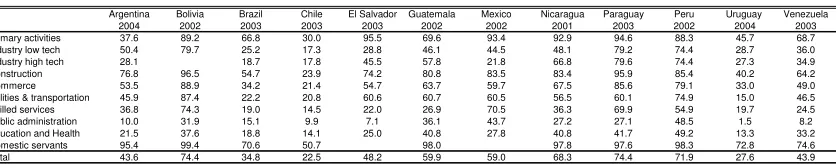
Informality differs by sector of activity. In table 3.4 we divide the working population of each country into 10 sectors and record the share of informal workers.9 Workers in primary activities are mostly informal (either unskilled self-employed, salaried workers in small farms, or family workers). On average, about half of the workers in the food and cloth industries in LAC are informal, most of them being self-employed. Informality is lower in the rest of the manufacturing industry: on average (LAC unweighted) around 40% of workers are either self-employed or wage earners in small firms (only a small fraction declare themselves being family workers). Construction workers are mainly informal: around 60% are either self-employed or salaried workers in small establishments (in roughly the same proportion). Informality is even higher in the commerce sector (on average 65%). Differences across countries are considerable: while 56% of Bolivian workers in the commerce sector are unskilled self-employed, 50% of Panama’s workers in that sector are employed by large firms. Informality is substantially lower in the skilled-services sectors (banking, business services, professionals). On average, informality is around 25%. Most workers in that sector are employees of large firms. In theory all public administration employees should be registered as public sector salaried workers, and hence be classified as formal. This occurs for the vast majority of workers, but there are exceptions that could be due to measurement errors, or situations where people work for the public administration through small private firms (e.g. consulting jobs). In any case the registered informality rate in the public administration is around 1%. On average, around 30% of workers in the education and health sector are informal, being most of them unskilled-self employed. The relative low level of informality in the sector is mainly driven by the large share of the public sector in the provision of education and health. Finally, almost all domestic servants are informal. In most countries they are classified as salaried workers in small “firms” (houses).
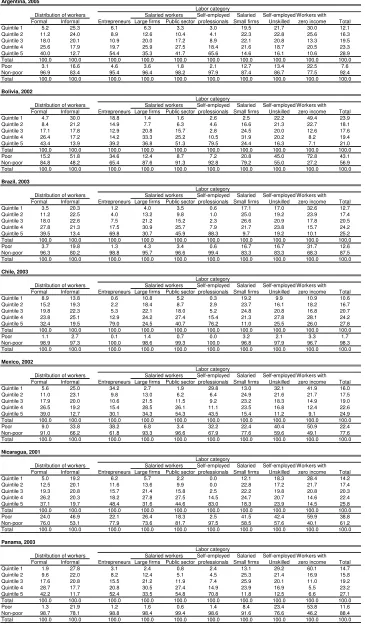
Informal workers are poorer than formal workers. This means that household income adjusted for demographic is lower for informal workers, not that they earn less than formal workers controlling for observable characteristics (next section has data on this). Table 3.5 provides details about the position of formal and informal workers (and of each of the labor categories) in the household income distribution of each country.9 On average, while 5% of formal workers belong to the poorest quintile of the household per capita income distribution, that share climbs to 22% for informal workers. In the other extreme, whereas more than 40% of formal workers are in the top quintile of the household income distribution, 15% of informal workers manage to get there.
The last panel for each country in table 3.5 divides the formal and informal working population into poor and non poor according to the international standard of USD 2 a day per person (at PPP). A worker is poor if her household per capita income is lower than USD 2 a day. In Argentina 2005, while 3.1% of formal workers are poor according to that measure, the proportion of the informal workers that are poor climbs to 16.6%. In all countries the difference in the poverty headcount ratio between informal and formal workers is sizeable (around 4 times on average).
Although most entrepreneurs are not poor, in some countries a non-negligible
proportion of patrones is located in the low-income quintiles. Several measurement
errors may cause this allocation. Surveys record current, not permanent income.
9 To save space we show results for only seven countries. See Gasparini and Tornarolli (2006) for the
Specifically, they report incomes in the month previous to the survey. Entrepreneurs’ incomes are usually volatile, and hence some of them may report low earnings in a
given month.10 The second measurement error was already mentioned. Some patrones
may be just self-employed workers with low-productivity and hence low earnings. In Brazil while 30.7% of workers in large firms belong to the top quintile of the household income distribution, that proportion rises to 45.9% for the public sector employees and to 88.3% for the skilled self-employed. That pattern is valid for nearly all LAC countries, although with different intensities. A relatively robust ranking also holds for the three informal categories: the poverty headcount ratio for the zero-income workers is higher than for the self-employed, which in turn is higher than for salaried workers in small firms.
3.3. Informality II (“social protection” definition)
As commented above, the Latin American household surveys have a weak coverage of labor and social protection issues. We could implement the social protection definition of labor informality in only 14 countries of the sample. Moreover, several of them have questions only in some years, and the type of question differs across countries (see table 2.1).
Table 3.6 displays the share of salaried workers without the right to receive pensions when retired. That informality rate is presented for several socioeconomic groups. Informality is relatively low in Chile and Uruguay (around 25%) and somewhat higher in Argentina, Brazil and Venezuela (around 40%). The share of unprotected salaried workers is around 60% and higher in Bolivia, Colombia, Ecuador, Guatemala, Mexico, Nicaragua, Paraguay and Peru (see figure 3.6). As with the productive definition, labor informality in the social protection sense seems negatively correlated to per capita GDP and positively correlated to the share of rural population in the survey (figure 3.7). Again, when including both variables in a simple OLS regression, the latter becomes non-significant.
As shown in figures 3.3 and 3.4 the likelihood of having the right to pensions when retired is decreasing in education and has a U-shaped pattern with respect to age. The youth and the elderly are less covered by the social security system linked to employment than the adult population. While in some countries women are more likely to be informal than men, that situation is not generalized in the region. In contrast, labor informality is always higher in rural areas than in the cities.
We cannot provide a complete picture of what has happened with the social protection dimension of labor informality over the last decade in LAC with household survey data, since there are few countries with enough observations. Labor informality has increased in Argentina, Nicaragua and Venezuela, has remained roughly unchanged in Chile and Paraguay, and has slightly decreased in Brazil and Peru. Probably the main conclusion from the evidence is that there are no signs of a pattern toward less labor informality in the region. Most results hold when restricting the analysis to urban areas.
Social protection is low among salaried domestic servants, construction workers and rural workers (table 3.7). Informality is in general lower in the manufacturing industry,
10 The problem is not symmetric, since we expect most entrepreneurs to be non-poor when “permanent”
the skilled services, and in particular in the education, health and public administration sectors. However, notice that while in principle we expect all public sector workers to be covered by basic social protection, on average 20% of them report not having access to pensions.
Household income for the formal employees is substantially higher than for informal salaried workers (table 3.8). The poverty headcount ratio for the USD-2-a-day line is on average 6 times higher for the latter group.
The presence of a formal contract is a key feature of a labor relationship. Signing a contract makes the relationship more visible, and then increases the likelihood for the compliance with the labor legislation. Unfortunately, only few surveys include questions on labor contracts. Table 3.9 reports the share of salaried workers having signed a contract. That share is above 75% in Chile, above 50% on Mexico and Panama, and below 45% in the rest of the countries in the sample. As with pensions, signed contracts are more common among prime-age adults, the skilled and urban workers. From the scarce information of the table there are no signs of a fall in informality. In fact, the share of salaried workers with contracts has fallen in Chile and Mexico, the only two countries for which data goes back to the early 1990s.
3.4 Comparing the two definitions
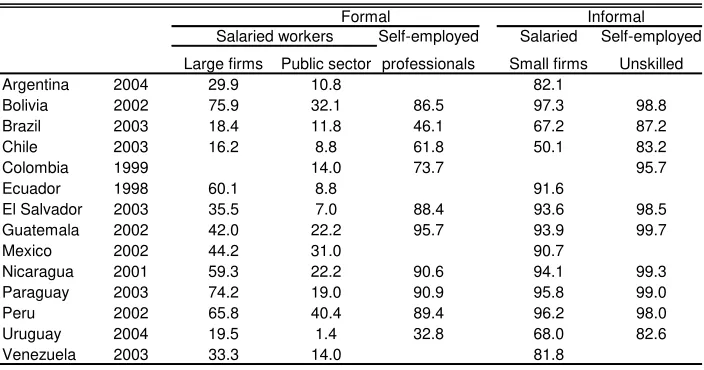
To what extent the two definitions of labor informality overlap? In table 3.10 we compute the share of workers without the right to pensions when retired (i.e. our definition of social-protection informality) by labor category (i.e. the basis for our definition of productive informality). An initial observation is that a sizeable share of workers classified as formal by the productive definition are informal in the social-protection sense. Even in the public sector, pensions seem not to be a universal right. In 10 out of the 14 countries in the sample the share of uncovered public sector workers is above 10%. That share climbs for the other two formal labor categories. In particular, the share of uncovered self-employed professionals is high (around 90% in many countries). As it will be shown in the next section this group enjoys the highest earnings of all groups. The typical Latin American self-employed professional has high relative earnings, but (s)he is out of the social security system. The share of large-firms employees without right to pensions is also high on average, although with large variations across countries: while around 20% of those workers are uncovered in the Southern Cone, the share goes up to more than 60% in Ecuador, Bolivia, Paraguay and Peru.
The great majority of informal workers in the productive sense are also informal in the legalistic sense. The mapping is not perfect, particularly for the salaried workers in small firms. In some countries a significant fraction of these workers has rights to pensions (around 20% in Argentina and Venezuela, 30% in Brazil and Uruguay and 50% in Chile).
Table 3.11 classifies workers in each country according to the two definitions of informality. The last column records the share of workers which are consistently classified as formal or informal by the two definitions. On average, more than 75% are in that group. That share is higher when considering all workers (instead of just salaried workers).11 There are few workers who are informal in the productive sense but have
11 Presumably, the share would be even higher if we increased the cut-off point for firm size to define
access to social security (column (iii)). The relatively large social security systems in the Southern Cone account for most of these cases. Instead, there are more formal workers in the productive sense which are informal in the legalistic sense: the low social-security coverage of the self-employed professionals, and to a lesser extent the employees of large firms are behind the figures in column (ii).
4.
Wages and hours of work
In this section we document relative wages and hours of work of different labor categories. We start by showing unconditional statistics and then turn to a multivariate regression analysis.
Table 4.1 shows relative hourly wages by type of work. In the first panel the base group is wage earners, while in the second panel wages of public sector employees are set at 100. In our companion paper we also show statistics for hours of work. On average for the region entrepreneurs work 10% more hours than salaried workers and earn per hour 2.5 times more. Compared to the wage earners, the self-employed work 10% fewer hours and earn 10% less per hour. However, this average hides a variety of situations across countries. In Chile and some Central American countries, for instance, hourly wages are higher for the group of self-employed.
The second panel breaks down the working population into more labor categories. In general, the ranking of hourly wages is leaded by the self-employed professionals followed by the entrepreneurs, the salaried workers in the public sector, the salaried workers in large firms, the unskilled self-employed, and the salaried workers in small firms. On average, the skilled self-employed earn around 60% more than public sector employees. Large firm’s employees earn 30% less than in the public sector. That percentage climbs to 50% for the case of the unskilled self-employed and to 60% for the wage earners in small firms.
Hours of work do not differ much across groups. Entrepreneurs and large-firms employees work in general more hours than in the public sector, while hours of work are approximately the same for the rest of the groups. The exception is the group of zero income workers for whom hours of work are 20% lower than in the public sector. To further analyze wage differentials across groups we run regressions of the log of hourly wages against several controls and dummies for informal workers. The conditional measures of the earnings gap of being informal arising from these regressions should be interpreted with much care.12 In particular, welfare comparisons drawn from these results may be misleading. An informal job differs from a formal one in many dimensions, not only in the hourly wage paid. If we find that hourly wages are the same in both sectors, the informal job may still be inferior since it precludes the access to social protection,13 but it could be also superior, at least for some workers, since informality usually implies more flexibility: “being your own boss” is certainly a work amenity for many people.
12 See Maloney (2004).
13 Under the legalistic view, that is true by definition. Under the productive view social protection is not
There is a second reason why regressions should be interpreted with care. The informality coefficients may be biased if unobserved worker characteristics that affect productivity influence in which sector an individual chooses to work. It could be that only people with entrepreneurial ability choose to be self-employed, and then become successful. Or on the other hand, it could be that people with low work attachment and without ability to tolerate authority, responsibilities and punctuality choose to be self-employed, and then probably get low earnings, in part precisely because the lack of these characteristics.
Table 4.2 shows the results of estimating log hourly wage regressions using Heckman maximum likelihood for a sample of urban workers aged 15 to 70. We exclude skilled workers (i.e. with a tertiary degree) and the group of patrones from the analysis, and run the regressions for men and women separately. In addition to the usual set of controls (education, age, regional dummies) we include interactions between education and informality. In particular, we construct interaction variables by multiplying the informal binary variable with two educational dummies: one for those without any secondary education, and one for those with some high-school education. We also include interactions with dummies variables for the youth (15-24) and the elderly (56-70). Table 4.2 is divided into three panels according to the definition of informality. Panel A considers the productive definition. Since as said above we exclude skilled workers and employers, the regressions report the wage gaps between the (i) unskilled-self employed + small-firms salaried workers, and (ii) salaried workers in large firms and the public sector. In panel B we compare unskilled self-employed with unskilled salaried workers. Finally, in panel C we restrict the analysis to unskilled salaried workers and divide them according to the social protection definition of informality. In each panel the table shows the coefficients of the interaction variables.
In most countries being informal in the productive sense implies lower wages, even when controlling for observable factors. On average, informal male workers without a secondary education earn 30% less than their formal counterparts. The wage gap for those with secondary education is also significant, although somewhat smaller in most countries. Wage gaps of roughly the same magnitude are also present in the case of female workers. The coefficients of the interaction variables with age groups are mostly non-significant. In some few countries being informal is associated to higher wages for the youth and lower wages for the elderly.
Panel B indicates that while in half of the countries in the sample being an unskilled self-employed implies lower wages than being an unskilled salaried worker, in the other half there are no significant differences in wages. In panel C the results are more conclusive: in nearly all countries salaried workers with social protection also earn substantially more than informal salaried workers. That seems to be true for males and females and for both educational groups.
5.
Informality over the cycle
informality.14 According to this hypothesis when the economy enters a recession, sticky wages in formal firms force them to fire workers, who find in the informal sector a way to survive waiting for better times. The informal sector serves as disguised unemployment by absorbing displaced workers during downturns. The flow of entrants into the “flex-wage” informal sector drives wages down relative to the formal sector which remains downwardly rigid. Hence, relative (informal/formal) sector size and wages should move oppositely.
In contrast, under other assumptions and shocks, the two variables may go in the same direction. For instance, if informality is perceived as a close substitute for a formal job, an autonomous increase of the informal sector relative wage (e.g. after an autonomous increase in the relative price of non-tradables) should attract workers and hence increase the size of that sector.
We do not have enough data to carry out a rigorous test of the co-movements between the size of the informal sector, relative wages and the cycle.15 Instead, we present a preliminary analysis of these variables for the countries in the sample. Table 5.1 shows the ratio informal/formal for the number of workers and median hourly wages.16 As in the previous section, these ratios are shown for men and women separately, and for three alternative definitions of informality: (i) self-employed+salaried workers in small firms, (ii) self-employed, and (iii) salaried workers without right to pensions. In each country we also show an index of real per capita GDP based on purchasing-power-parity (PPP).
Some cases are consistent with the dualistic view of informality, while some others fit better into the voluntary view of informality. In Argentina, and according to the prediction of the labor-market-segmentation hypothesis, the share of informal workers greatly raised during the crisis that started around 1998. There is also some fall in the relative wage of informal workers, although that result does not hold when considering only the self-employed as informal. In Chile, the relative number of informal workers went down during the expansion 1990-1998, while relative wages for that sector increased. From 1998 to 2003 changes have been erratic.
The case of Brazil seems more consistent with the voluntary view of informality. During the economic expansion in the first half of the 1990s both the relative size and wages of the informal sector grew. When the economy came to a halt in the late 1990s the share of workers in informal jobs remained roughly constant, along with relative wages.
Most LAC countries have experienced an economic expansion in the early and mid 1990s, followed by stagnation and even recessions in the late 1990s and early 2000s.17 Table 5.2 summarizes the direction of the changes in relative size and wages between urban unskilled self-employed and their formal salaried counterparts. The patterns are similar across countries during recessions: the relative size of the informal sector increases, while relative wages fall. There are few exceptions to this behavior. Instead,
14 See Fiess
et al. (2002) and Maloney (2004).
15 Using multivariate co-integration techniques Fiess et al. (2002) find periods of co movements of
relative earnings and sector size in Mexico and Brazil.
16 The analysis is carried out for the sample of urban workers aged 15 to 70 without tertiary education
who are not in the patrones group.
during expansions the patterns have been different. Some few countries experienced similar changes as those commented above for Chile. That is the case of Mexico. The rest, instead, has shared the experience of Brazil with higher informality, although in half of the countries the increase in the informal sector size was not accompanied by a raise in relative wages.
Summarizing, during the recent recessions informality has increased along with a fall in relative wages, in accordance with the dualistic view of the labor market. However, the symmetric story for the economic expansions did not take place in most LAC countries. In many economies informality increased during periods of strong GDP growth. That fact may respond to a voluntary view of the labor market: in good times people take advantage of the larger set of opportunities and decide to be self-employed. Of course, the evidence of increasing informality both in expansions and downturns is also consistent with some structural changes that induced an increase in self-employment and that operated regardless of the economic cycle.
6.
Changes in employment and informality
A given change in the average level of informality in an economy could be the consequence of either a change in the propensity to informality within groups, or to a change in the structure of employment toward groups with high propensity to informal arrangements. In this section we examine this issue for the case of salaried workers and the social protection definition of informality.
Informality varies across groups. As discussed above the access to social protection linked to the job is not uniform across age, gender and education groups. The heterogeneity is significant also across economic sectors, type of firms and jobs. Due to the need for more labor flexibility, high monitoring costs for the government, and other reasons some sectors have high propensity to informality. Construction workers and domestic servants are more likely to be informal than public sector employees. Also, part-timer workers, small-firm employees and newly-recruited staff tend to have, ceteris paribus, lower access to social protection in their jobs. If for some reason the structure of employment changes toward one of these groups, the average rate of informality in the economy will probably increase. On the other hand, the propensity to informality may increase within each group, making the overall rate to grow.
We carry out a decomposition in order to assess the extent to which observed changes in the overall rate of informality in a country are the consequence of changes in the structure of employment or in the propensity to informality within groups. To that aim we follow the microeconometric decomposition methodology of Gasparini (2002). The main inputs are the estimated coefficients of models for the informality status of a worker. The actual change in the informality rate between time t1 and t2 in a country is
salaried workers in Argentina between 1995 and 2003. If only the parameters linking observable characteristics to informality (i.e. the estimated coefficients in the first two columns of table 6.3) had changed in that period, and all observable characteristics had remained fixed, informality would have increased by 7 points. On the other hand if only the observable characteristics of workers (including those of their jobs) had changed, informality would have fallen 1 percentual point. In fact, although the employment structure changed in some informality-increasing directions as the fall in the share of large firms, and the sizeable growth in part-time jobs, other changes were informality-decreasing, as the raise in the share of education, health and skilled services in total employment, and the reduction in the share of workers with low seniority (see table 6.1). On average, these changes between 1992 and 2003 were slightly
informality-decreasing.18 The large growth in informality seems to have been associated to a
sizeable increase in the propensity to informality in most groups (the parameters effect) (see table 6.2). A similar story applies to the rest of the Southern Cone countries: Chile, Paraguay and Uruguay. In Brazil the characteristics effects was similar to that of their neighbors, but the parameters effect was smaller, averaging out a negligible change in overall informality. In contrast, Venezuela has large values of both effects, leading to a large increase in informality. El Salvador is the only country in the sample with a significant fall in informality driven entirely by a change in the employment structure in favor of prime-age adults, the skilled, and those employed in large firms.
7.
Characterizing differences in informality across countries
Recorded informality rates considerably vary across countries. Differences are in part due to noise in the information, since household surveys are not uniform in the region. But there are genuine differences rooted in the variety of productive and employment structures across the region. One of the main relevant differences is the rural-urban mix of the population. In more rural countries informality is expected to be higher. Table 7.1 shows rates for national, urban and rural areas. The standard deviation for the urban observations is 2 points lower than for the national observations.
But even ignoring rural areas differences in informality across countries remain large (see figure 7.1). In this section we characterize these differences using microsimulation techniques similar to those applied in section 6. In particular, we compare the actual informality rate in a country A to the counterfactual rate that would arise if that country “imported” only the observable characteristics of some other country B. That exercise implies keeping the parameters that govern the relationship between observable characteristics and informality fixed at the country A’s values.
Country A may have a higher informality rate, measured as lack of social protection, than country B due to a different employment structure, even when within each group informality is the same as in the other economy. For instance, country A may have a larger construction sector or a larger fraction of its labor force as part-time workers. But it could also be the case that for each particular group for some reason informality is higher in A. For instance, it could be that construction is carried out mainly by big urban development firms in country B which tend to be more formal, and that the government
18 Notice that when using the EPH Continua 2004 some results change. In particular, the characteristic
in B has more effective instruments to audit labor regulation for part-time workers. The decompositions allow us to have an idea of the relative magnitude of these two channels. Of course this is not a general equilibrium exercise. When we import the characteristics of country B into country A the parameters would probably change. A larger part-time labor force may induce the government to increase the efforts to auditing the compliance with labor regulations (or to give up, given the size of the task…). In this sense, the microsimulations are partial-equilibrium exercises that illustrate the size of the direct channels through which each change operates.
The results of the decompositions can be used to assess scenarios under which a country may reduce informality. A larger characteristics effect implies that by transforming the employment structure country A may reduce informality to the country B’s level. That may require progress in education, demographic transitions or sectoral changes in production, all phenomena related to economic development. Instead, a large parameters effect suggests that for some reason informality is larger in A for each group (or most groups), and that may be more related to specific policy issues, as high tax pressure, low auditing efforts, or insufficient legislation.
The decompositions are carried out for both definitions of informality. In the social protection case we restrict the analysis to urban salaried adult workers, while in the productive definition the sample includes urban adult workers.
The results of the decompositions are shown in table 7.2 for the productive definition of informality, and in table 7.3 for the social protection definition. The first panel in table 7.2 shows that if Argentina imported the parameters of Chile, informality would fall from 44% to 35%, that is, a parameter effect of -9 points (see third panel). If Argentina kept its parameters but took the observable employment characteristics of Nicaragua, informality would increase from 44% to 53%, i.e. a characteristic effect of +9 points (see second panel).
Take the case of Paraguay to illustrate the results in table 7.3. That South American economy has the highest levels of informality under both definitions in the sample. If Paraguay manages to change its employment structure to mimic a more developed economy like Argentina, Chile or Uruguay, informality in the labor protection sense would fall by around six points. The effect would be much larger if Paraguay manages to “copy” the parameters of other countries. For instance, informality would fall 33 points by taking the parameters of Chile or Uruguay while keeping the same structure of observable characteristics. In general, the parameter effects are substantially higher than the characteristic effects under the social protection definition of informality. The difference in general is not large under the productive definition.
8.
Concluding remarks
The cross-section evidence seems to be consistent with the idea of voluntary self-employment. Unskilled young people enter the labor market as wage earners, accumulate knowledge, capital and contacts, and then set up their own informal businesses. However, on average, being informal implies lower wages, even when controlling for observable factors. Informal male workers without a secondary education on average earn 30% less than their formal counterparts. Accordingly, in all countries the difference in the poverty headcount ratio between informal and formal workers is sizeable. In most countries informal workers have lost ground against their formal counterparts in terms of hours of work, but not in terms of hourly wages.
In several countries the increase in labor informality, as defined by the lack of social protection, seems to have been associated to a sizeable increase in the propensity to informality in most groups. The same conclusion arises when comparing labor informality across countries. Understanding differences in informality over time and across countries seems to be much more complicated than accounting for different labor structures.
The legalistic or social protection definition of informality is probably the most interesting to study, and the most relevant for many policy issues. One way to learn about labor informality in this sense is by comparing country experiences on social protection. Although certainly subject to many caveats, the country comparisons are often in practice the most compelling pieces of evidence over economic policy arguments. Unfortunately, the information on social protection contained in the LAC household surveys is still scarce, heterogeneous and volatile. A generalized effort toward a better and more homogeneous coverage of social protection issues in household surveys would surely be socially very productive.
References
BID (2003). Se buscan empleos. El mercado de trabajo en América Latina. BID,
Informe de Progreso Económico y Social 2004.
Cahuc, P. and Zylberberg, Z. (2004). Labor Economics, MIT Press.
Carpio, J., Klein, E. and Novacovsky, I. (eds.) (2000). Informalidad y exclusión social. Fondo de Cultura Económica de Argentina, Buenos Aires.
CEPAL (2005). Social Panorama of Latin America, Annual Report, Santiago de Chile.
Ehrenberg, R. and Smith, R. (1997). Modern Labor Economics. Theory and Public
Policy. Fifth edition. Harper Collins.
Fields, G. (1990). Labor market modelling and the urban informal sector: theory and evidence. In OECD, The informal sector revisited. Paris
Fiess, N., Fugazza, M. and Maloney, W. (2002). Exchange rate appreciations, labor
market rigidities, and informality. Policy Research Working Paper2771, The
World Bank, Washington D.C.
Gasparini, L. (2002). Microeconometric decompositions of aggregate variables. An application to labor informality in Argentina. Applied Economics 34, 2257-2266. Gasparini, L. (2003). Protección social y empleo en América Latina. Documento de
Gasparini, L. and Bertranou, F. (2005). Social protection and the labour market in Latin
America. What can be learned from household surveys? International Social
Security Review 58, 2-3, April-September.
Guha-Khasnobis, B., Kanbur, R., and Ostrom, E. (2006). Beyond formality and informality. Introduction to Linking the formal and informal economy: concepts and policies, forthcoming, EGDI-WIDER, forthcoming.
Heckman, J., Lochner, L. and Todd, P. (2003). Fifty years of Mincer earnings regressions. NBER Working Paper Series 9732.
Maloney, W. (1999). Does informality imply segmentation in urban labor markets? Evidence from sectoral transitions in Mexico. World Bank Economic Review 13. Maloney, W. (2004). Informality revisited. World Development 32 (7).
Merrick, T. (1976). Employment and earnings in the informal sector in Brazil: the case of Belo Horizonte. Journal of Developing Areas 10(3).
Mincer, J. (1974). Schooling, experience and earnings. New York, Columbia University Press for NBER.
OIT (1991). El dilema del sector no estructurado. Memoria del Director General, CIT, 1991, Ginebra.
OIT (2002). El trabajo decente y la economía informal. CIT, 2002. Informe VI,
Ginebra.
Pradhan, M. and van Soest, A. (1995). Formal and informal sector employment in urban areas of Bolivia. Labor Economics 2.
Portes, R. Blitzner, S. and Curtis, J. (1986). The urban informal sector in Uruguay: its internal structure , characteristics and effects. World Development 14(6).
Portes, R. and Schauffler, R. (1993). Competing perspective on the Latin American informal sector. Population and Development Review 19 (1).
Saavedra, J. and Chong, A. (1999). Structural reform, institutions and earnings:
evidence from the formal and informal sectors in urban Peru. Journal of
Development Studies 35 (4).
Tokman, V. (1999). La informalidad en los años noventa: situación actual y
perspectivas. En De igual a igual. El desafío del Estado ante los nuevos
Table 2.1
Social protection (legalistic) definition of labor formality
Country A worker is formal if she ..
Argentina has the right to a pension when retired
Bolivia (since2000) is affiliated with a AFP (Administradora de Fondos de Pensiones)
Brazil contributes to the Social Security system
Chile is affiliated with any social security system
Colombia (ENH) has the right to a pension when retired
Ecuador (ECV) has the right to a pension when retired
El Salvador is affiliated with any social security system (no information for domestic servants)
Guatemala contributes to the IGSS (Instituto Guatemalteco de Seguridad Social)
Mexico (since 2000) has the right to a pension when retired
Nicaragua contributes to the INSS (Instituto Nicaragüense de Seguridad Social)
Paraguay is affiliated with any social security system
Peru (since 1999) is affiliated with any social security system
Uruguay (since 2001) has the right to a pension when retired
Venezuela
1995-1998 has the right to social benefits or social insurance IVSS
2000-2003 has the right to social benefits
Table 3.1
Household surveys in LAC
Country Name of survey Acronym Years Coverage
Argentina Encuesta Permanente de Hogares EPH 1992-2003 Urban
Encuesta Permanente de Hogares-Continua EPH-C 2003-2004 Urban
Bolivia Encuesta Integrada de Hogares EIH 1993 Urban
Encuesta Nacional de Empleo ENE 1997 National Encuesta Continua de Hogares- MECOVI ECH 2000-2002 National
Brazil Pesquisa Nacional por Amostra de Domicilios PNAD 1990-2003 National
Chile Encuesta de Caracterización Socioeconómica Nacional CASEN 1990-2003 National
Colombia Encuesta Nacional de Hogares - Fuerza de Trabajo ENH-FT 1992 Urban
Encuesta Nacional de Hogares - Fuerza de Trabajo ENH-FT 1996-2000 National Encuesta Continua de Hogares ECH 2000-2004 National Encuesta de Calidad de Vida ECV 2003 National
Costa Rica Encuesta de Hogares de Propósitos Múltiples EHPM 1992-2003 National
Dominican R. Encuesta Nacional de Fuerza de Trabajo ENFT 1996-2004 National
Ecuador Encuesta de Condiciones de Vida ECV 1994-1998 National
Encuesta de Empleo, Desemple y Subempleo ENEMDU 2003 National
El Salvador Encuesta de Hogares de Propósitos Múltiples EHPM 1991-2003 National
Guatemala Encuesta Nacional sobre Condiciones de Vida ENCOVI 2000 National
Encuesta Nacional de Empleo e Ingresos ENEI - 2 2002 National
Haiti Enquête sur les Conditions de Vie en Haïti ECVH 2001 National
Honduras Encuesta Permanente de Hogares de Propósitos Múltiples EPHPM 1992-2003 National
Jamaica Jamaica Survey of Living Conditions JSLC 1990-2002 National
Mexico Encuesta Nacional de Ingresos y Gastos de los Hogares ENIGH 1992-2002 National
Nicaragua Encuesta Nacional de Hogares sobre Medición de Nivel de Vida EMNV 1993-2001 National
Panama Encuesta de Hogares EH 1995-2003 National
Paraguay Encuesta Integrada de Hogares EIH 1997 National
Encuesta Permanente de Hogares EPH 1999-2003 National Encuesta Integrada de Hogares EIH 2001 National
Peru Encuesta Nacional de Hogares ENAHO 1997-2003 National
Suriname Expenditure Household Survey EHS 1999 Urban/Paramaribo
Uruguay Encuesta Continua de Hogares ECH 1989-2004 Urban
Venezuela Encuesta de Hogares Por Muestreo EHM 1989-2003 National
[image:19.595.85.390.376.708.2]Table 3.2
Workers by labor category
Self-employed Salaried Self-employed Workers with Self-employed Salaried Self-employedWorkers with Entrepreneurs Large firms Public sector professionals Small firms Unskilled zero income Entrepreneurs Large firms Public sector professionals Small firms Unskilled zero income
Argentina Ecuador
EPH-15 cities ECV
1995 5.2 34.1 15.3 3.3 20.3 20.5 1.5 1994 5.6 21.2 6.9 1.1 20.9 24.7 19.8 1996 4.6 33.4 15.2 3.2 22.6 19.2 1.7 1998 5.0 21.1 6.3 0.9 17.7 27.1 21.9 1997 5.0 35.4 15.0 3.0 21.9 18.4 1.4 ENEMDU
1998 4.8 35.4 15.2 3.1 22.2 18.1 1.3 2003 4.6 19.5 8.4 1.1 21.2 30.1 15.2
EPH - 28 cities El Salvador
1998 4.7 33.5 16.0 3.0 22.3 19.2 1.4 1991 7.5 27.7 9.9 0.2 16.6 26.5 11.8 1999 4.6 33.2 16.1 2.9 22.4 19.3 1.5 2000 5.4 28.0 9.3 0.6 19.2 29.3 8.3 2000 4.8 31.6 16.5 2.9 22.9 20.1 1.3 2002 4.6 27.4 8.5 0.5 19.6 29.9 9.4 2001 4.5 30.5 17.3 3.1 22.6 21.0 1.0 2003 4.6 29.7 8.2 0.5 20.3 27.6 9.1 2003 4.3 29.8 17.2 3.9 22.0 21.6 1.3 Guatemala
EPH-C ENCOVI
2003-II 4.3 29.5 16.5 3.3 24.5 20.0 1.9 2000 7.8 22.9 4.5 0.6 19.3 25.0 20.0 2004-I 4.3 31.7 15.4 3.3 24.6 19.0 1.7 ENEI
2004-II 4.6 31.5 15.8 3.6 24.2 18.9 1.5 2002 5.1 21.1 3.9 0.5 15.4 30.1 24.1 2005-I 4.3 32.4 15.5 3.8 24.4 18.5 1.2 Haiti
Bolivia 2001 0.5 2.8 0.9 77.1 5.0
Urban Honduras
1993 6.4 18.9 14.6 1.7 21.8 28.8 7.8 1992 8.5 24.1 10.2 0.3 15.6 30.3 11.1 1997 6.9 23.0 11.4 1.5 16.6 33.2 7.4 1997 9.9 23.4 6.5 0.1 16.9 31.3 11.9 2002 4.5 17.7 10.6 1.8 18.2 36.4 11.0 1999 10.1 22.4 6.6 0.2 17.2 30.5 13.0
National 2003 10.0 20.3 5.8 0.2 18.3 33.2 12.2
1997 5.2 11.8 6.7 0.8 10.0 35.1 30.4 Jamaica
2000 1.9 13.7 7.2 0.6 10.0 40.5 26.0 1996 3.0 32.1 10.3 0.5 14.9 37.0 2.2 2002 4.3 10.9 6.8 1.0 11.8 35.1 30.0 1999 3.3 28.5 12.0 0.1 15.6 38.2 2.3
Brazil 2002 2.7 26.6 12.6 0.6 17.8 38.2 1.6 1992 3.7 25.8 11.6 0.6 21.6 21.1 15.6 Mexico
1993 3.6 25.6 12.2 0.7 21.5 21.0 15.5 1996 4.8 31.5 11.6 0.5 20.1 21.7 9.9 1995 3.9 25.1 11.4 0.8 22.1 21.8 14.9 2000 4.7 33.9 11.0 0.8 20.7 20.7 8.3 1996 3.7 26.1 11.7 0.9 22.6 21.4 13.7 2002 3.9 30.0 11.2 0.8 23.9 22.1 8.1 1997 4.0 26.0 11.3 0.9 22.4 21.8 13.6 Nicaragua
1998 4.1 26.4 11.5 0.9 21.8 22.1 13.3 2001 5.0 23.2 6.7 0.4 19.8 27.4 17.5 1999 4.1 25.7 11.2 1.0 22.0 22.2 14.0 Panama
2001 4.2 28.1 11.2 1.1 22.8 21.2 11.4 1995 3.1 33.4 18.4 0.4 15.1 24.9 4.7 2002 4.2 28.4 11.1 1.1 22.4 21.2 11.5 1997 2.9 34.1 17.7 0.0 14.0 27.4 3.9 2003 4.2 28.6 11.1 1.1 22.4 21.3 11.4 2001 2.5 31.5 17.0 0.4 14.3 29.0 5.4
Chile 2002 2.9 30.2 16.1 0.6 15.8 29.6 4.9
1990 2.6 43.2 10.6 1.4 18.2 22.1 1.9 2003 2.9 29.9 16.2 0.9 15.4 29.7 5.1 1994 3.4 1.6 17.6 21.4 1.4 Paraguay
1996 3.8 46.7 10.2 1.3 17.0 19.6 1.4 1997 5.6 16.4 7.6 0.6 21.7 36.7 11.4 1998 4.2 1.8 18.0 18.9 1.5 1999 5.2 17.5 8.0 0.7 20.7 36.0 12.0 2000 4.3 44.5 12.6 1.8 16.1 19.2 1.6 2001 5.8 15.7 7.2 0.9 21.8 36.4 12.2 2003 4.1 45.9 11.2 1.8 15.7 19.7 1.6 2002 3.7 13.5 8.2 0.9 20.5 37.9 15.3
Colombia 2003 4.3 14.1 8.3 1.0 21.6 38.4 12.4
ENH-Urban Peru
1992 3.8 34.9 9.3 2.9 23.3 24.2 1.5 ENAHO 1
2000 4.3 32.0 6.7 3.7 21.4 30.0 1.8 1997 5.6 18.6 8.5 2.4 14.7 34.8 15.4
ENH-National 1999 5.9 16.1 7.9 2.7 16.8 35.4 15.3
1996 4.5 30.3 7.5 1.5 20.2 31.3 4.8 ENAHO 2
1999 4.0 28.0 6.8 2.1 18.7 35.4 5.0 2001 5.1 17.0 7.9 2.5 16.1 35.2 16.4 2000 4.3 24.9 9.6 2.2 16.6 36.4 6.1 2002 5.2 17.2 8.2 2.4 15.1 34.1 17.7
ECH-Urban 2003 4.7 16.4 6.6 2.8 14.1 35.0 20.4
2000 5.8 29.9 6.8 3.3 20.0 31.5 2.7 Suriname
2004 4.8 26.2 8.2 3.7 17.5 35.1 4.5 1999 4.8 40.8 29.0 0.5 4.9 18.6 1.4
ECH-National Uruguay
2004 4.4 25.4 6.5 2.8 16.9 38.2 5.9 1992 4.5 40.1 18.7 1.4 13.7 19.4 2.3
Costa Rica 1995 4.6 39.2 18.9 1.8 13.9 19.5 2.2 1992 4.9 36.7 16.4 0.2 18.5 19.7 3.6 1998 4.5 39.7 16.2 1.9 16.5 19.4 1.8 1997 7.5 33.5 14.4 0.3 21.5 19.7 3.1 2000 3.7 38.6 17.1 1.9 17.1 20.1 1.5 2000 5.8 34.8 14.2 0.3 21.2 21.1 2.6 2001 3.9 35.7 16.6 2.1 18.7 21.6 1.4 2001 8.1 34.5 14.5 0.3 19.2 20.4 3.0 2002 3.7 33.4 17.9 2.2 18.7 22.6 1.5 2003 8.7 35.6 14.0 0.3 19.5 19.3 2.7 2003 3.4 32.8 18.0 2.2 19.4 22.9 1.4
Dominican Rep. 2004 3.5 34.3 17.7 2.2 18.3 22.5 1.6
ENFT 1 Venezuela
1996 4.1 36.5 9.9 1.3 13.6 30.4 4.1 1989 7.5 37.2 19.1 0.7 10.4 21.8 3.3 1997 3.6 31.3 11.2 0.9 12.8 36.2 3.9 1995 5.6 29.9 17.5 1.7 13.8 30.0 1.5
ENFT 2 1998 5.0 30.1 15.7 2.1 13.2 32.3 1.6
2000 2.6 32.1 12.0 1.7 12.5 37.3 1.8 2000 5.0 28.0 14.6 1.8 13.7 34.6 2.2 2003 3.5 30.9 12.1 1.9 11.6 38.4 1.8 2003 5.0 24.8 13.8 2.3 14.7 35.9 3.5 2004 4.6 32.0 10.8 1.3 12.2 37.1 2.0
Salaried workers Formal Informal
Salaried workers
Formal Informal
Source: own calculations based on SEDLAC (CEDLAS and The World Bank).
Table 3.3
Share of informal workers (productive definition)
Total (15-24) (25-64) (65 +) Female Male Low Medium High Rural Urban Female Male
Argentina
EPH-15 cities
1995 0.422 0.496 0.397 0.634 0.440 0.370 0.546 0.410 0.123 0.397 0.506 0.489 1996 0.435 0.517 0.408 0.654 0.440 0.388 0.584 0.422 0.139 0.408 0.518 0.516 1997 0.417 0.480 0.395 0.593 0.423 0.377 0.566 0.399 0.140 0.395 0.478 0.481 1998 0.416 0.481 0.393 0.586 0.424 0.371 0.567 0.409 0.134 0.393 0.491 0.475 EPH - 28 cities
1998 0.428 0.504 0.402 0.613 0.432 0.383 0.571 0.420 0.141 0.402 0.523 0.492 1999 0.432 0.510 0.405 0.643 0.438 0.383 0.587 0.424 0.143 0.405 0.499 0.518 2000 0.442 0.515 0.419 0.650 0.439 0.405 0.592 0.450 0.154 0.419 0.512 0.517 2001 0.446 0.542 0.420 0.626 0.431 0.413 0.606 0.449 0.162 0.420 0.563 0.528 2003 0.448 0.581 0.419 0.580 0.408 0.427 0.634 0.467 0.155 0.419 0.572 0.587 EPH-C
2003-II 0.464 0.578 0.433 0.614 0.455 0.418 0.646 0.507 0.170 0.433 0.588 0.572 2004-I 0.453 0.582 0.416 0.645 0.440 0.400 0.615 0.482 0.168 0.416 0.616 0.561 2004-II 0.445 0.547 0.414 0.647 0.438 0.397 0.616 0.463 0.147 0.414 0.608 0.510 2005-I 0.441 0.520 0.415 0.635 0.450 0.390 0.616 0.462 0.155 0.413 0.556 0.499
Bolivia
Urban
1993 0.584 0.690 0.532 0.677 0.664 0.433 0.735 0.560 0.158 0.532 0.814 0.579 1997 0.572 0.642 0.535 0.705 0.658 0.442 0.766 0.578 0.183 0.535 0.772 0.539 2002 0.655 0.712 0.613 0.797 0.715 0.529 0.797 0.643 0.209 0.613 0.807 0.631 National
1997 0.755 0.798 0.693 0.876 0.800 0.611 0.858 0.594 0.177 0.875 0.563 0.878 0.734 2000 0.765 0.792 0.715 0.944 0.787 0.658 0.895 0.632 0.196 0.923 0.592 0.838 0.756 2002 0.769 0.816 0.708 0.883 0.796 0.638 0.848 0.660 0.208 0.863 0.613 0.871 0.775
Brazil
1992 0.583 0.615 0.531 0.834 0.590 0.492 0.646 0.275 0.049 0.861 0.435 0.640 0.599 1993 0.580 0.611 0.530 0.834 0.589 0.490 0.646 0.286 0.053 0.844 0.440 0.633 0.597 1995 0.588 0.617 0.542 0.831 0.598 0.504 0.665 0.302 0.056 0.857 0.455 0.643 0.601 1996 0.577 0.604 0.537 0.833 0.577 0.510 0.662 0.317 0.061 0.842 0.456 0.617 0.597 1997 0.578 0.603 0.539 0.827 0.586 0.507 0.669 0.319 0.066 0.848 0.456 0.626 0.589 1998 0.571 0.595 0.532 0.824 0.571 0.506 0.666 0.326 0.064 0.827 0.454 0.603 0.590 1999 0.581 0.610 0.542 0.825 0.582 0.513 0.679 0.333 0.067 0.831 0.464 0.627 0.600 2001 0.554 0.567 0.525 0.807 0.566 0.495 0.675 0.330 0.066 0.858 0.458 0.574 0.562 2002 0.552 0.570 0.521 0.818 0.560 0.492 0.678 0.332 0.066 0.862 0.454 0.578 0.565 2003 0.550 0.566 0.522 0.807 0.561 0.493 0.684 0.345 0.064 0.859 0.456 0.571 0.563
Chile
1990 0.422 0.423 0.413 0.658 0.471 0.385 0.583 0.383 0.106 0.569 0.383 0.471 0.398 1994 0.404 0.372 0.400 0.658 0.465 0.367 0.572 0.379 0.093 0.568 0.373 0.413 0.349 1996 0.380 0.343 0.376 0.606 0.438 0.344 0.557 0.365 0.084 0.545 0.350 0.386 0.320 1998 0.383 0.341 0.380 0.611 0.449 0.342 0.578 0.375 0.101 0.584 0.352 0.358 0.331 2000 0.369 0.337 0.362 0.602 0.434 0.321 0.554 0.374 0.084 0.550 0.337 0.385 0.308 2003 0.370 0.329 0.364 0.634 0.429 0.324 0.571 0.381 0.088 0.540 0.341 0.367 0.305
Colombia
ENH-Urban
1992 0.490 0.527 0.476 0.718 0.503 0.472 0.678 0.519 0.189 0.476 0.458 0.497 2000 0.532 0.565 0.517 0.740 0.532 0.523 0.739 0.586 0.224 0.517 0.505 0.538 ENH-National
1996 0.562 0.578 0.545 0.762 0.564 0.544 0.719 0.541 0.182 0.638 0.503 0.497 0.557 1999 0.590 0.614 0.571 0.777 0.588 0.571 0.747 0.595 0.182 0.661 0.531 0.539 0.597 2000 0.591 0.617 0.568 0.778 0.593 0.561 0.731 0.598 0.205 0.635 0.537 0.550 0.603 ECH-Urban
2000 0.542 0.584 0.524 0.732 0.554 0.514 0.735 0.584 0.221 0.524 0.526 0.556 2004 0.571 0.616 0.548 0.774 0.584 0.532 0.777 0.626 0.185 0.548 0.565 0.589 ECH-National
2004 0.610 0.642 0.584 0.789 0.623 0.567 0.779 0.629 0.184 0.714 0.548 0.609 0.604
Costa Rica
1992 0.418 0.402 0.405 0.773 0.429 0.396 0.509 0.317 0.113 0.487 0.318 0.383 0.411 1997 0.443 0.445 0.421 0.718 0.454 0.405 0.543 0.317 0.120 0.500 0.334 0.444 0.445 2000 0.449 0.449 0.435 0.715 0.468 0.419 0.547 0.350 0.135 0.511 0.363 0.458 0.444 2001 0.426 0.439 0.404 0.721 0.457 0.374 0.534 0.340 0.107 0.503 0.348 0.453 0.431 2003 0.414 0.448 0.390 0.697 0.457 0.352 0.523 0.333 0.118 0.475 0.341 0.458 0.443
Dominican Rep.
ENFT 1
1996 0.482 0.465 0.471 0.671 0.441 0.482 0.616 0.403 0.119 0.533 0.419 0.424 0.482 1997 0.529 0.506 0.518 0.750 0.503 0.524 0.635 0.409 0.157 0.612 0.457 0.419 0.544 ENFT 2
2000 0.517 0.476 0.509 0.771 0.466 0.532 0.667 0.440 0.091 0.682 0.428 0.381 0.522 2003 0.517 0.501 0.505 0.736 0.470 0.523 0.662 0.472 0.101 0.646 0.433 0.387 0.554 2004 0.512 0.511 0.491 0.774 0.460 0.508 0.657 0.424 0.113 0.626 0.424 0.457 0.534
Ecuador
ECV
1994 0.653 0.677 0.595 0.843 0.711 0.521 0.731 0.501 0.157 0.739 0.485 0.738 0.640 1998 0.667 0.697 0.601 0.874 0.704 0.528 0.760 0.514 0.168 0.790 0.473 0.768 0.654 ENEMDU
2003 0.664 0.680 0.619 0.822 0.689 0.575 0.759 0.576 0.190 0.748 0.520 0.747 0.642 Youths (15-24)
Gender Age
Adults (25-64)
Gender Education Area