1 2 3 4 5 6 7 8 9 10 11 12 13 14 15 16 17 18 19 20 21 22 23 24 25 26 27 28 29 30 31 32 33 34 35 36 37 38 39 40 41 42 43 44 45 46 47 48 49 50 51 52 53 54 55 56 57 58 59 60 61 62 63 64 65
Long-term photosynthetic CO2 removal from biogas and flue-gas: exploring the potential of closed photobioreactors for high-value biomass production
Alma Toledo-Cervantes1,2, Tamara Morales1, Álvaro González1, Raúl Muñoz1, Raquel
Lebrero1*
1.-Department of Chemical Engineering and Environmental Technology, Valladolid, Dr.
Mergelina s/n., Valladolid 47011, Spain.
2.- Department of Chemical Engineering, CUCEI-Universidad de Guadalajara, Blvd. M.
García Barragán 1451, C.P. 44430, Guadalajara, Jalisco, México.
*Corresponding author: [email protected]
Highlights
CO2 abatement from biogas and flue-gas was studied in a tubular
photobioreactor
A feast-famine regime was applied for continuous production of high-energy storage compounds
CO2 removals > 98% and complete C and N recovery as biomass was achieved
Microalgae consumed nitrogen in the dark period regardless of the N source
The N-dark feeding strategy increased the carbohydrates productivity by 1.7 times
1 Long-term photosynthetic CO2 removal from biogas and flue-gas: exploring the 1
potential of closed photobioreactors for high-value biomass production 2
3
Alma Toledo-Cervantes1,2, Tamara Morales1, Álvaro González1, Raúl Muñoz1, Raquel 4
Lebrero1* 5
6
1.-Department of Chemical Engineering and Environmental Technology, Valladolid, 7
Dr. Mergelina s/n., Valladolid 47011, Spain. 8
2.- Department of Chemical Engineering, CUCEI-Universidad de Guadalajara, Blvd. 9
M. García Barragán 1451, C.P. 44430, Guadalajara, Jalisco, México. 10
11
*Corresponding author: [email protected] 12
13
14
*Manuscript (double-spaced and continuously LINE and PAGE numbered)
2 Abstract
15
The long-term performance of a tubular photobioreactor interconnected to a gas 16
absorption column for the abatement of CO2 from biogas and flue-gas was investigated.
17
Additionally, a novel nitrogen feast-famine regime was implemented during the flue-gas 18
feeding stage in order to promote the continuous storage of highly-energetic 19
compounds. Results showed effective CO2 (~98%) and H2S (~99%) removals from
20
synthetic biogas, supported by the high photosynthetic activity of microalgae which 21
resulted in an alkaline pH (~10). In addition, CO2 removals of 99 and 91% were
22
observed during the flue-gas operation depending on the nutrients source: mineral salt 23
medium and digestate, respectively. A biomass productivity of ~8 g m-2 d-1 was 24
obtained during both stages, with a complete nitrogen and carbon recovery from the 25
cultivation broth. Moreover, the strategy of feeding nutrients during the dark period 26
promoted the continuous accumulation of carbohydrates, their concentration increasing 27
from 22% under normal nutrition up to 37% during the feast-famine cycle. This 28
represents a productivity of ~3 g-carbohydrates m-2 d-1, which can be further valorized to
29
contribute to the economic sustainability of the photosynthetic CO2 removal process.
30
31
Keywords: Algal-bacterial technology; Biogas upgrading; Carbohydrates production; 32
CO2 abatement; Photobioreactors.
33
3 1. Introduction
35
Carbon dioxide (CO2) represents nowadays the most important greenhouse gas (GHG),
36
with 77% of the total GHG emissions worldwide and an annual atmospheric 37
concentration increase of 0.5% over the last decade (López et al., 2014). In addition, the 38
amount of CO2 emitted from anthropogenic sources has increased from 22 Gt in 1990 to
39
33 Gt in 2010, and it is expected to reach 41 Gt by 2030 (World Bank, 2014; United 40
Nations, 2015). From these anthropogenic CO2 emissions, 93.5% are produced from
41
the combustion of fossil fuels, with a typical concentration in the emitted gases ranging 42
from 5 to 20% (Raeesossadati et al., 2014; Warmuzinski et al., 2014). Energy 43
production from biogas also constitutes an important source of anthropogenic CO2
44
emissions (CO2 content in raw biogas can vary from 15 up to 60%), which production
45
in Europe is expected to reach 18-20 million m3 by 2030 (Muñoz et al., 2015). The 46
detrimental effects of this GHG on the environment (i.e. global warming, modification 47
of the pH of oceans, etc.) demand the implementation of cost-effective technologies for 48
CO2 removal from industrial emissions. In the particular case of biogas, the abatement
49
of the CO2 not only entails environmental benefits but also contributes to the upgrading
50
of this biofuel, decreasing its transportation costs and increasing the energy content. 51
Conventional physical/chemical technologies for CO2 removal from flue-gas or biogas,
52
such as scrubbing, adsorption, or cryogenic separation, have been widely implemented 53
due to the extensive knowledge on their design and operation and the high removal 54
efficiencies achieved. However, only biological technologies offer a low environmental 55
impact, besides reducing the operating costs associated to the treatment process. In this 56
regard, CO2-capturing biotechnologies supported by the photosynthetic activity of
57
microalgae in photobioreactors allow for the removal of CO2 in a cost-effective,
58
4 microalgae-based process, the CO2 is transferred from the gas to the liquid phase when
60
the flue-gas/biogas is sparged into the cultivation broth, being subsequently fixed by 61
microalgae during photosynthesis in the presence of light. Therefore, the CO2 is not
62
only removed from the gas preventing its emission to the atmosphere, but the C-CO2 is
63
recovered as valuable algal biomass, which can be further valorized (Raeesossadati et 64
al., 2014; Muñoz et al. 2015). Moreover, the necessary nutrients for microalgae growth 65
can be supplemented from wastewaters, which increases the environmental 66
sustainability of the process (Park and Cragss, 2010). However, most wastewaters are 67
characterized by a low C/N/P ratio compared to that needed for microalgae growth 68
(20:8:1 for urban wastewaters vs 106:16:1 to ensure balanced algae growth), therefore 69
carbon limitation usually hinders nutrient recovery from wastewater. In this sense, CO2
70
supply into the cultivation broth from biogas or flue-gas increases the availability of 71
inorganic carbon, enhancing biomass productivity, ensuring complete nutrient recovery 72
from wastewater and mitigating microalgae pH-derived inhibition (Arbid et al., 2013; 73
Posadas et al., 2015). 74
The potential of algal-bacterial symbiosis for biogas (Toledo-Cervantes et al., 2016; 75
Toledo-Cervantes et al., 2017b) or flue-gas (Posadas et al. 2015) purification combined 76
to wastewater treatment has been already studied and demonstrated in open 77
photobioreactors. However, few studies have focused on the implementation of this 78
process in closed photobioreactors, which offers higher photosynthetic efficiencies by 79
avoiding light limitation, enhanced biomass productivities and better CO2 mass transfer
80
(Chisti, 2007; Arbid et al., 2013). On the other hand, this photosynthetic CO2-abatement
81
process can be further optimized by implementing nutrient supplementation strategies to 82
promote the production of storage compounds in the algal biomass (Mooij et al., 2013). 83
5 interest will increase the economic sustainability of the process (Toledo-Cervantes et 85
al., 2017a). 86
This work aimed at evaluating the long-term performance of a tubular photobioreactor 87
interconnected to a CO2 absorption column for the abatement of CO2 from biogas and
88
flue-gas. Furthermore, a feast-famine regime was implemented in order to exploit the 89
cyclic nitrogen absence for the continuous production of high-energy storage 90
compounds. 91
92
2. Materials and methods 93
2.1 Experimental system 94
The experimental system consisted of a tubular photobioreactor interconnected to a 95
mixing chamber and a CO2 absorption column (AC) (Figure 1). The tubular
96
photobioreactor was composed of 12 tubes of 6 cm inner diameter and 94 cm of length, 97
with a total volume of 45.5 L. The mixing chamber (60 cm height, 50 cm width and 35 98
cm length) had a working volume of 60 L. The absorption column was 2 m height (1.73 99
m water column) with an internal diameter of 5 cm and a working volume of 3.5 L. Two 100
sets of high intensity LED PCBs were placed at both sides of the photobioreactor to 101
provide a photosynthetic active radiation (PAR) of ~1100 μmol m-2
s-1. Light:dark 102
cycles of 12:12 h of the PAR were fixed. The cultivation broth was re-circulated 103
through the tubular photobioreactor and the mixing chamber at a linear velocity of 0.5 104
m s-1. The absorption column was operated by supplying co-currently the cultivation 105
broth from the mixing chamber and biogas/flue-gas (through a stainless steel diffuser of 106
2 µm pore size) at the bottom of the column. The operating parameters such as liquid 107
and gas flow rates of the absorption column and nutrients/digestate solution flow rates 108
6 110
2.2 Experimental system operation 111
2.2.1 Operation with biogas (A): 112
Prior operation, an abiotic CO2/H2S removal test was performed in order to determine
113
the optimum liquid to gas flow rates (L/G) ratio in the AC, which maximizes the CO2
114
and H2S removal from biogas without compromising the CH4 content and the quality of
115
the upgraded biogas due to N2 and O2 desorption (Toledo-Cervantes et al., 2016). The
116
biogas used was a synthetic mixture of 29.5% CO2, 0.5% H2S and 70% CH4. The liquid
117
phase was a modified Bristol medium (final pH = 7.5) (g L-1): NaNO3 (1.5), CaCl2
118
2H2O (0.025), MgSO4·7H2O (0.075), K2HPO4 (0.075), KH2PO4 (0.175), NaCl (0.025),
119
and 1 mL L-1 of a micronutrient solution (2.86 g L-1 H3BO3, 1.81 g L-1 MnCl2 4H2O,
120
0.22 g L-1 ZnSO47H2O, 0.39 g L-1 Na2MoO42H2O, 0.079 g L-1 CuSO45H2O and 49.4
121
mg L-1 Co(NO3)26H2O). The liquid recirculation rates tested were 60, 150, 300 and 450
122
mL min−1 while the biogas flow rate was set at 40 mL min-1. Hence, L/G ratios ranging 123
from 1 to 11 were studied. The AC was allowed to stabilize for two times the hydraulic 124
retention time prior monitoring the upgraded biogas composition by GC-TCD. 125
126
The system was inoculated with the microalgae Acutudesmus obliquus at an initial 127
suspended solids concentration (SST) of 0.1 g L-1, and operated for biogas upgrading 128
during 150 days. The CO2 contained in the synthetic biogas previously described was
129
used as carbon source for microalgae growth, while nutrients were supplied by means of 130
the modified Bristol medium. During stage IA (from day 1 to 54) the synthetic biogas 131
was fed during the illuminated period into the absorption column at a flow rate of 40 132
mL min-1 and the liquid broth was recirculated through the AC at a flow rate of 400 mL 133
7 at a flow rate of 3 mL min-1 (hydraulic retention time, HRT = 50 d) during the light 135
period. The feed flow rate was selected according to the nitrogen load needed for the 136
complete photosynthetic fixation of the CO2 contained in the biogas, assuming a
137
biomass composition of 50 % of carbon and 10 % of nitrogen (Groobelar, 2004). From 138
days 54 to 77 (stage IIA) the synthetic biogas was continuously fed into the absorption 139
column (24 h gas feeding), therefore the mineral medium flow rate was increased to 6 140
mL min-1 (HRT= 25 d). During this stage, both the gas and the liquid flow rates through 141
the AC were maintained constant (L/G ratio = 10). Finally, in Stage IIIA (days 77 to 142
150) the synthetic biogas was only fed during the light period at 80 mL min-1 (L/G ratio 143
= 5) while the mineral medium feeding flow rate was kept at 6 mL min-1 (HRT= 25 d). 144
145
2.2.2 Operation with flue-gas (B): 146
During experiment B, a synthetic flue-gas composed of 20% of CO2 and 80% of N2 was
147
used as carbon source for the growth of microalgae. During Stage IB (from day 151 to 148
280) the synthetic flue-gas was fed at 50 mL min-1 during the light period (L/G = 5). 149
The mineral medium previously described was modified by decreasing the NaNO3
150
concentration to 0.75 g L-1 and the nitrogen load rate was adjusted to the photosynthetic 151
fixation of the CO2 contained in the flue-gas. Therefore, the nutrient solution was fed
152
into the mixing chamber at a flow rate of 10 mL min-1 (HRT= 15 d). From days 284 to 153
297 (Stage IIB) no nitrogen source was added to the mineral medium in order to 154
decrease the concentration of nitrogen in the cultivation broth to the non-assimilative 155
nitrogen concentration (<2 mg-N L-1). No further modifications were implemented 156
during this period. 157
During stage IIIB (days 297 to 336) mineral medium was fed at the same HRT (15 d) 158
8 compounds. The nitrogen load was set at 511 mg d-1 based on the biomass productivity 160
observed in stage IIB and considering a biomass nitrogen content of 7% (experimental 161
data from stage IB). No nutrient was supplemented during the light period in which the 162
flue-gas was fed (Mooij et al., 2015). From days 336 to 380 (Stage IVB) the synthetic 163
nutrient solution was substituted by a diluted anaerobic digestate solution obtained from 164
the wastewater treatment plant of Valladolid city (Spain), with an average composition 165
of total nitrogen (TN), inorganic carbon (IC) and total phosphorus (TP) of 660 ± 46, 524 166
± 49 and 48 ± 3 mg L-1, respectively. The digestate feeding flow rate was adjusted to 167
ensure the same nitrogen load as in Stage IIIB. 168
The steady state biomass chemical (C, N, P, and S) and biochemical (proteins, 169
carbohydrates, lipids, and ashes) composition were determined at the end of the light 170
and dark periods two times a week. 171
During both operating periods (i.e. A and B), the biomass concentration, measured as 172
TSS, was determined twice a week. The temperature and dissolved oxygen 173
concentration (DO) in the cultivation broth were daily in-situ monitored. Inlet (biogas 174
and flue-gas) and outlet (upgraded biogas and treated gas) gas samples were drawn 175
twice a week to analyze the composition by GC-TCD. The inlet and outlet gas flow 176
rates in the AC were also periodically measured in order to perform the gas mass 177
balance. Samples of 100 mL of the cultivation broth and mineral medium or diluted 178
digestate were taken twice a week to determine the pH and concentrations of TN, IC, 179
nitrate (NO3-), sulfate (SO42-) and phosphate (PO43-). The population of microalgae in
180
the photobioreactor was identified by microscopic observation at the end of each steady 181
state. 182
9 2.3 Analytical methods
184
Biomass concentration was determined by dry weight (105 ºC, 24 h). NO3-, PO43- and
185
SO42- concentrations were analyzed by HPLC-IC according to Serejo et al., (2015).
186
Dissolved IC and TN concentrations were determined using a Shimadzu TOC-VCSH 187
analyzer (Japan) equipped with a TNM-1 chemiluminescence module. The PAR was 188
measured with a LI-190 quantum sensor and recorded with a LI-250A light meter 189
(Lincoln, Nebraska, USA). The pH was monitored with a pH meter Eutech Cyberscan 190
pH 510 (Eutech instruments, The Netherlands), while the DO concentration was 191
measured with an Oxi 330i oximeter (WTW, Germany). The gas composition (CO2,
192
H2S, O2, N2, and CH4 concentrations) was analyzed by GC-TCD according to Posadas
193
et al. (2015). Microalgae identification was performed by microscopic observations 194
(OLYMPUS IX70, USA) after sample fixation with 5% of lugol acid. 195
The carbohydrate and protein content of the biomass was determined according to the 196
methodology described in Dubois et al. (1956) and Lowry et al. (1951), respectively. 197
For carbohydrates determination, 1.5 mL of cultivation broth (biomass concentration 198
~0.2 g L-1) was mixed with 4 mL of H2SO4 1 M. Afterwards, the sample was heated for
199
20 min at 100 ºC and centrifuged for 5 min at 10000 rpm. A volume of 0.5 mL of the 200
supernatant was mixed with 0.5 mL of a 5% phenol solution and stood for 40 min. After 201
that period, 2.5 mL of concentrated H2SO4 were added, and then the optical density was
202
determined at 485 nm. Protein content was measured by mixing 1 mL of the cultivation 203
broth and 1 mL of NaOH 1 N and heated at 100 ºC for 20 min. After centrifugation (5 204
min at 10000 rpm), 0.4 mL of the supernatant were mixed with 2 mL of a solution 205
composed of 1:25 (v/v) of 5% (w/v) Na2CO3 and 0.5% (w/v) CuSO4 in 1% (p/v) sodium
206
potassium tartrate. The mixture was stood for 10 min. Subsequently, 0.4 mL of 1 N 207
10 density of the preparation was then read at 750 nm. Total lipids were determinate by 209
direct extraction in an automatic Soxhlet extraction unit (SER 148 Series, Velp 210
Scientifica) using hexane as solvent. The extraction conditions were set as follows: 211
extraction temperature 130°C, immersion time 60 min, and solvent recovery time 120 212
min. The ashes content was determine as volatile solids according to Standard methods 213
(Eaton et al., 2005). Finally, the elemental composition of biomass was determined 214
using a CHNS analyzer (LECO CHNS-932) for C and N content, while an Inductively 215
Coupled Plasma-Optical Emission Spectrometer (ICP-OES, Varian 725-ES) was used 216
for P and S content determination. 217
218
3. Results and Discussions 219
3.1. Biogas upgrading 220
3.1.1. Abiotic removal of CO2 and H2S 221
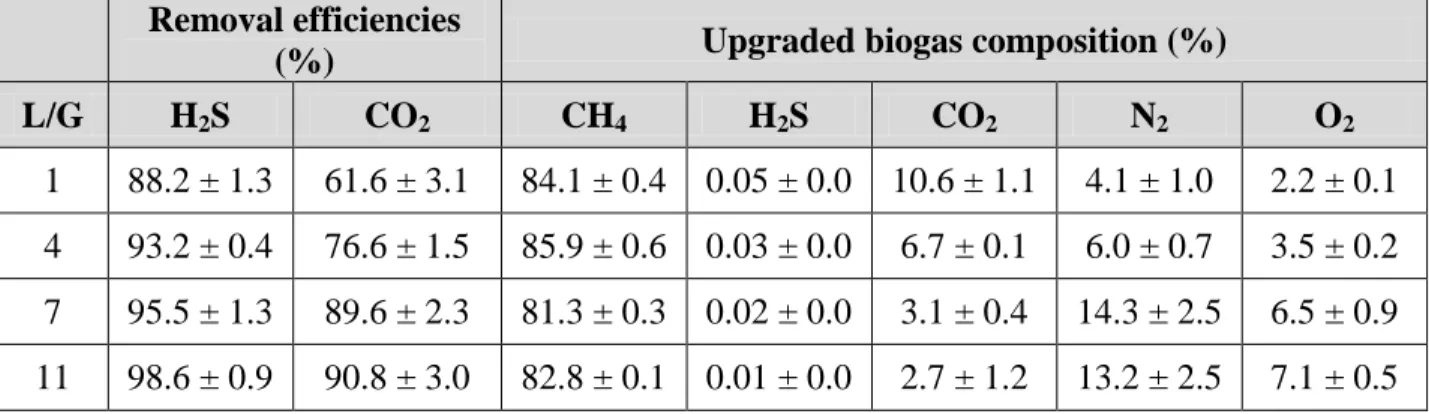
Table 1 shows the upgraded biogas composition and removal efficiencies obtained at 222
different liquid to biogas flow rate ratios during the preliminary abiotic test. Maximum 223
mass transfer efficiencies for both CO2 and H2S were obtained at an L/G of 11 (~91 and
224
99%, respectively). Similar studies have reported higher CO2 and H2S removal
225
efficiencies (REs) of 98.8 ± 0.2 and 97.1 ± 1.4%, respectively, regardless of the L/G 226
ratio tested but using the algal-bacterial broth at a pH of 10 (Toledo-Cervantes, 2016). 227
Furthermore, Serejo et al. (2015) obtained a CO2-RE of 95 ± 2% at L/G ratios above 15
228
because of the lower pH (≈7.9) of the cultivation broth. During these studies, higher N2
229
(7-25%) and O2 (3-7%) concentrations were observed in the upgraded biogas as a result
230
of the photosynthetic activity (DO ≥ 8 mg-O2 L-1) and the nitrogen concentration in the
231
liquid broth (~14 mg-N2 L-1), and its subsequent stripping from the cultivation broth. In
232
11 for preventing desorption of nitrogen in the absorption column, since the cultivation 234
broth is not in contact with the atmosphere. However, to the best of our knowledge, this 235
is the first study reporting the upgraded biogas composition in a closed tubular 236
photobioreactor (Table 1). Maximum methane concentrations of ~85% were achieved in 237
the abiotic test since methane content in the upgraded biogas is compromised between 238
the low nitrogen desorption and the low CO2 removal reached at L/G ratios <11 and a
239
pH of the cultivation broth of 7.5. In this sense, it is worth noticing that, since H2S and
240
CO2 are acidic gases, higher absorption of these components from the biogas is
241
expected under biotic conditions as a result of the increase in pH by algal 242
photosynthetic activity. 243
244
3.1.2. Photosynthetic CO2 and H2S removal from biogas 245
During stage IA, CO2 and H2S were effectively removed from biogas at 97.6 ± 0.4 and
246
98.3 ± 0.0%, respectively (Figure 2a). As previously discussed, the high removals here 247
observed were supported by the photosynthetic activity of microalgae, which allowed 248
for a dissolved oxygen concentration of 8.1 ± 1.1 mg-O2 L-1 and a pH of 10.7 ± 0.5.
249
Some studies have previously reported efficient biogas upgrading by alkalophilic 250
microalgae cultivation or by using highly alkaline digestate (Franco-Morgado et al., 251
2017; Toledo-Cervantes et al., 2016, 2017b). However, during this study, only the high 252
photosynthetic activity of microalgae supported the alkaline pH needed for the effective 253
transfer of CO2 and H2S from the gas phase into the cultivation broth. Under these
254
conditions, the upgraded biogas had a composition of CO2 0.4 ± 0.4 %, H2S 0.01 ±
255
0.01%, O2 8.3 ± 2.9%, N2 7.7 ± 2.9% and CH4 83.6 ± 1.8%, which is suitable for
256
12 During stage IIA, the operating strategy of feeding the biogas continuously decreased 258
the pH of the cultivation broth to 7.2 ± 0.7. This acidic condition and the likely toxic 259
effect of the H2S inhibited the microalgae activity, which was confirmed by the low DO
260
concentration observed, 3.6 ±1.8 mg-O2 L-1. Despite some studies have demonstrated
261
that biogas containing up to 0.5% of H2S (5000 ppmv) does not inhibit microalgae
262
growth, González-Sánchez and Posten (2017) have recently reported inhibitory effects 263
at concentrations higher than 200 ppmv. These results were associated to the closed
264
configuration of the photobioreactor, which likely induced the accumulation of HS- in 265
the cultivation broth during the dark period when dissolved oxygen concentration 266
decreases, thus preventing further HS- oxidation. However, the H2S removal remained
267
similar to that observed in stage IA at 99.7 ± 0.0 %, due its higher solubility compared 268
to that of CO2 (Henry law constants: H2S = 1 × 10⁻³ vs. CO2 = 3.3 × 10⁻⁴ mol m-3 Pa-1)
269
(Sanders, 1999). This promotes the mass transfer of H2S to the liquid phase, leading to a
270
toxic effect at low DO concentrations. In contrast, because of the decrease in pH driven 271
by the low photosynthetic activity, the CO2 removal decreased to 57.0 ± 0.1 % (Figure
272
2a). It is worth noticing that similar photosynthetic biogas upgrading studies have 273
reported CO2 removals in the range of 50–98.8% depending on the alkalinity of the
274
cultivation broth and the environmental conditions in high rate algal ponds (both 275
indoors and outdoors) (Franco-Morgado et al., 2017; Posadas et al., 2017; Toledo-276
Cervantes et al., 2017). These findings highlight the need of pH control in this 277
bioreactor configuration to avoid the deterioration of the CO2 removal performance.
278
In order to recover the cultivation broth conditions suitable for biogas upgrading, the 279
biogas inlet flow was doubled during the illuminated period (stage IIIA). This operating 280
strategy allowed increasing the pH up to 10.0 ± 0.2 and the CO2 and H2S removals
281
13 conditions, the upgraded biogas had a similar composition of that obtained in stage IA: 283
CO2 1.8 ± 3.4%, H2S 0.00 ± 0.00, O2 9.6 ± 3.3%, N2 6.0 ± 2.2% and CH4 82.6 ± 3.8%
284
(Figure 2b). The slightly higher oxygen concentration recorded in the upgraded biogas 285
was correlated with the higher DO concentration in the cultivation broth (10.8 ± 1.2 mg-286
O2 L-1) when compared to stage IA.
287
Regarding algal biomass production, the photobioreactor operation at a HRT = 50 d 288
during stage IA lead to a biomass productivity of 2.5 ± 0.2 g m-2 d-1, which entailed 289
nitrogen and carbon recoveries of 56.6 ± 3.1% and 50.5 ± 4.5%, respectively. In stage 290
IIA, the lower HRT of 25 days resulted in an increase in biomass concentration from 1.6 291
± 0.1 to 2.2 ± 0.1 g L-1, that corresponded to a biomass productivity of 7.2 ± 0.3 g m-2 d -292
1
. During this period, the mass balance showed that 86.2 ± 2.6% of the C-CO2 removed
293
from biogas and 81.4 ± 3.2% of the nitrogen fed were recovered as biomass. Finally, in 294
stage IIIA, the doubling of the carbon load during the illuminated period allowed 295
increasing the biomass concentration to 2.5 ± 0.1 g L-1 together with a biomass 296
productivity of 8.0 ± 0.2 g m-2 d-1. Under these conditions, a complete nitrogen and 297
carbon recovery as algal biomass was observed. These results confirm the potential of 298
tubular photobioreactors for effective C-CO2 recovery from biogas and nutrients
299
removal. Furthermore, closed photobioreactors are recognized for the higher biomass 300
productivities achieved in comparison with open systems. However, due to the lack of 301
standardization of the reported values, volumetric productivities (g L-1 d-1) are often 302
used for closed photobioreactors instead of areal productivity (g m-2 d-1), which hampers 303
a fair comparison between both configurations. In this sense, while productivities of 304
0.06 g L-1 d-1 have been reported for closed photobioreactors treating biogas (Meier et 305
al., 2016), productivities in the range of 2.2 – 15 g m-2 d-1 are commonly achieved in 306
14 g L d-1 (Toledo-Cervantes et al., 2016; Posadas et al., 2017; Toledo-Cervantes et al., 308
2017). In this study, the biomass productivity of 8.0 g m-2 d-1 was equivalent to a 309
volumetric biomass productivity of 0.18 g L d-1, which exceeds previous values 310
reported for open systems. 311
312
3.2. High-value algal biomass production from flue-gas 313
Microalgae are capable of producing high-energy compounds, which can contribute to 314
the economic viability of the photosynthetic CO2 removal processes either from biogas
315
or flue-gas. Carbohydrates accumulation triggered by nitrogen starvation is one of the 316
most effective ways to obtain added-value biomass (Ho et al., 2015). It is important to 317
highlight that this operation is performed batch-wise, since a previous biomass 318
production stage is typically required before inducing such accumulation due to the 319
different nutrient requirements of both biochemical processes. In this sense, the concept 320
of “survival of the fattest” introduced by Mooij et al. (2013) was here applied as a 321
strategy to induce the continuous accumulation of high-energy storage compounds in 322
the produced microalgae while cleaning flue-gas. 323
In stage IB, the biogas fed during operation stages IA-IIIA was replaced by a synthetic 324
flue-gas containing 20% of CO2; therefore, the mineral medium was modified
325
accordingly in order to balance the carbon/nitrogen load to keep the same assimilative 326
nutrient removal reached in section 3.1.2. Consequently, the nutrient solution was fed at 327
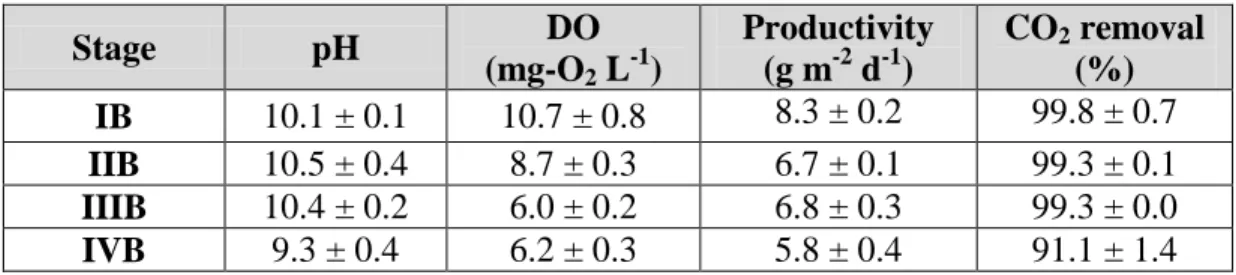
an HRT of 15 days and the system was operated until constant biomass concentration of 328
1.5 ± 0.0 g L-1 was achieved. Under steady conditions, ~100% of the N-NO3 fed and the
329
C-CO2 removed from flue-gas were recovered as biomass (Table 2). The harvested
330
15 period (i.e. after the light period), reached 8.3 ± 0.2 g m-2 d-1, with a composition of 332
~22.1% carbohydrates, 48.3 % proteins and 14.6 % ashes (Table 3). 333
During stage IIB, the nitrogen source was removed from the mineral medium while 334
maintaining the same nutrients load (Figure 3). The latter strategy was implemented in 335
order to decrease the nitrogen concentration in the cultivation broth to a non-336
assimilative concentration of ~1.3 mg-N L-1 in which the accumulation of high-energy 337
compounds such as lipids and/or carbohydrates can occur (Figure 3). 338
Once N concentrations <2 mg-N L-1 were achieved in the cultivation broth, the mineral 339
medium was supplemented with N-NO3 and fed only during the dark period at the
340
required nitrogen load to keep the same biomass productivity of that recorded in stage 341
IIB (Table 2). As can be observed from Figure 3, microalgae were initially not able to 342
consume the nitrogen in the absence of light (days 297-320 of stage IIIB). This can be 343
explained by the fact that nitrogen assimilation requires the fixed CO2 and the energy
344
generated in the photosynthetic process. Moreover, to assimilate nitrate, the molecule 345
has to be transported across the membrane and be reduced to ammonia, consuming in 346
the process large amounts of energy, carbon, and protons (Perez-Garcia et al., 2011). 347
After this initial adaptation period of ~20 days, consumption of the supplied nitrogen 348
during the dark phase was observed from day 320 onwards. This fact was attributed to 349
the concomitant degradation of storage starch in the dark period. This phenomenon 350
would require a regenerative cycling of adenine nucleotides and phosphate that can be 351
supported by chlororespiration, which plays an important role in the dark recovery of 352
plants from photoinhibition through de novo protein synthesis (Beardall et al., 2003). It 353
has been suggested that chlororespiration supplies ATP for maintenance and synthetic 354
processes in chloroplasts in the dark, supplementing ATP from glycolysis in the plastids 355
16 form of glucose-based carbohydrates might be oxidized through the Embden–Meyerhof 357
pathway and/or the Pentose Phosphate pathway, the energy production routes (NADPH, 358
ATP), during the dark period. In that way, enzymes involved in nitrate assimilation 359
(nitrate reductase and nitrite reductase) that work sequentially, had the required energy 360
to catalyze nitrate to ammonium in the dark period; while during the light period CO2 is
361
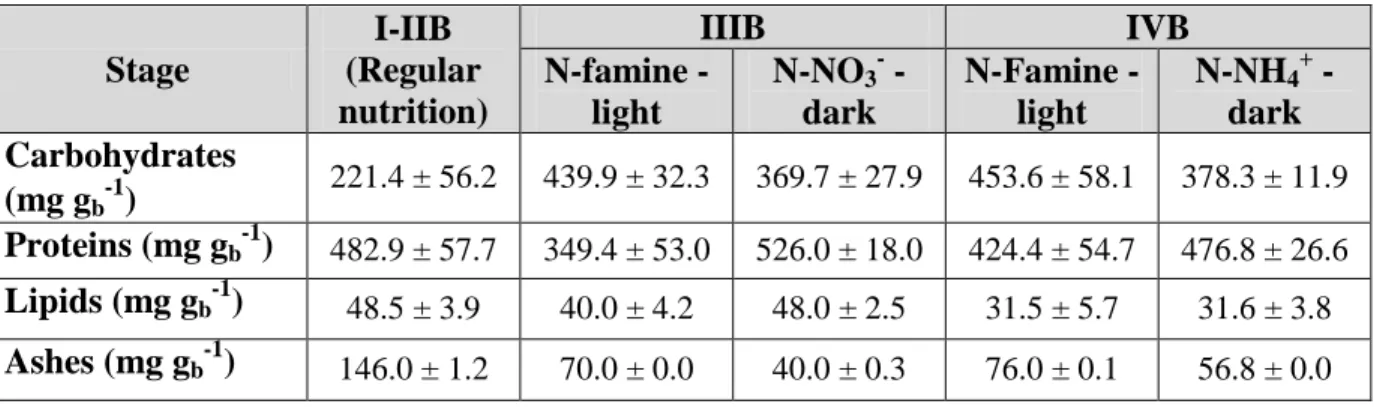
reduced to carbohydrates through the Calvin cycle. This hypothesis was supported by 362
the higher carbohydrate content recorded by the end of the light period, i.e. the 12 h 363
nitrogen famine period, in contrast to that recorded by the end of the dark period, i.e. the 364
12 h nitrogen supplementation period (Table 3). 365
Similar results were observed during stage IVB, when the mineral medium was replaced 366
by an anaerobic digestate but keeping the same nitrogen (N-NH4+) load. At this point, it
367
is worth noticing that the variation in biomass productivity observed in stage IVB was 368
likely due to the decrease in CO2 removal down to 91.6± 11.3%, driven by the lower pH
369
as a result of ammonium feeding. Furthermore, during this period the occurrence of 370
Pseudanabaena sp. (12%) was recorded which was attributed to lack of aseptic 371
conditions of the digestate. This fact is frequently reported in open systems where rapid 372
variations in microalgae population are expected. Moreover, the appearance of this 373
cyanobacterium has been previously reported in wastewater treatment processes 374
coupled to biogas upgrading (Serejo et al., 2015). 375
Finally, carbohydrates productivities ~3 g m-2 d-1 were recorded under the N-dark 376
feeding strategies, which represents 1.7 times the productivity reached under normal 377
nutrition conditions (Figure 4). The high concentration of carbohydrates reached is 378
preferred for its chemical or biological valorization, for instance as the substrate for 379
biohydrogen by dark-fermentation (Chen et al., 2016), ethanol (John et al., 2011) or 380
17 wastewater treatment significantly contributes to the flue-gas or biogas cleaning process 382
(Toledo-Cervantes et al., 2017a.). These results confirm the feasibility of applying this 383
novel strategy for inducing the accumulation of high-energy storage compounds during 384
the photosynthetic abatement of CO2 coupled with wastewater treatment, since it allows
385
for a continuous production of added-value algal biomass. 386
387
4. Conclusions 388
To the best of our knowledge, this is the first experimental study reporting the long-term 389
performance of a tubular photobioreactor for the abatement of CO2 from exhaust gases
390
(biogas and flue-gas) coupled with algal biomass production. The system here proposed 391
showed an efficient removal of CO2 from gas streams (>98%), the upgraded biogas
392
composition meeting the required standards for electricity production. Moreover, the 393
innovative nutrient supplementation strategy, i.e. feeding nutrients during the dark 394
period, allowed enhancing the carbohydrates content in the produced biomass by 1.7 395
times regardless of the nitrogen source. In summary, this study confirmed the potential 396
of the photosynthetic CO2 removal process in closed photobioreactors to support
397
nutrient recovery from digestate and production of added-value biomass with high 398
carbohydrates content, resulting in a cost-efficient and environmentally-friendly 399
technology. 400
401
Acknowledgments 402
This work was supported by the research grants of the Fundación Iberdrola, the 403
Regional Government of Castilla y León (UIC 71), MINECO and the European Union 404
through the FEDER program (CTM2015-70722-R). CONACyT-México is gratefully 405
18 407
References 408
1. Arbid Z., Ruiz J., Álvarez-Díaz P., Garrido-Pérez C., Barragán J., Perales J. A., 409
Effect of pH control by means of flue gas addition on three different photo-bioreactors 410
treating urban wastewater in long-term operation. Ecol. Eng. 2013, 57: 226-235. 411
2. Beardall, J., Quigg, A., & Raven, J. A. 2003. Oxygen consumption: 412
photorespiration and chlororespiration. In Photosynthesis in algae. pp. 157-181. 413
Springer Netherlands. 414
3. Chisti, Y., Biodiesel from microalgae. Biotechnol. Adv. 2007, 25: 294–306. 415
4. Chen, C. Y., Chang, H. Y., & Chang, J. S. Producing carbohydrate-rich 416
microalgal biomass grown under mixotrophic conditions as feedstock for biohydrogen 417
production. International journal of hydrogen energy, 2016, 41(7), 4413-4420. 418
5. Perez-Garcia, O., Escalante, F. M., de-Bashan, L. E., Bashan, Y. Heterotrophic 419
cultures of microalgae: metabolism and potential products. Water research, 2011, 45(1), 420
11-36. 421
6. Dubois, M., Gilles, K.A., Hamilton, J.K., Rebers, P.A., Smith, F., Colorimetric 422
method for determination of sugars and related substances. Anal. Chem. 1956, 28:, 350– 423
356. 424
7. Eaton, A.D., Clesceri, L.S., Greenberg, A.E. Standard Methods for the 425
Examination of Water and Wastewater, 21st ed. American Public Health 426
Association/American Water Works Association/Water Environment Federation, 427
Washington, DC, 2005. 428
8. Franco-Morgado, M., Alcántara, C., Noyola, A., Muñoz, R., González-Sánchez, 429
19 alkaline conditions: Influence of the illumination regime. Sci. Total Environ. 2017, 592: 431
419–425. 432
9. González-Sánchez, A., and Posten C. Fate of H2S during the cultivation of
433
Chlorella sp. deployed for biogas upgrading. J. Environ. Manage. 2017, 191: 252-257. 434
10. Grobbelaar, J.U. 2013. Inorganic Algal Nutrition, in: Richmond, A., and Hu, Q. 435
(Eds), Handbook of Microalgal Culture: Applied Phycology and Biotechnology; 2nd 436
edition, John Wiley & Sons, UK, pp 123-133 437
11. Ho, S. H., Huang, S. W., Chen, C. Y., Hasunuma, T., Kondo, A., & Chang, J. S. 438
Characterization and optimization of carbohydrate production from an indigenous 439
microalga Chlorella vulgaris FSP-E. Bioresource Technology, 2013, 135, 157-165. 440
12. John, R. P., Anisha, G. S., Nampoothiri, K. M., & Pandey, A. Micro and 441
macroalgal biomass: a renewable source for bioethanol. Bioresource technology, 2011, 442
102(1), 186-193. 443
13. López J.C., Quijano G., Souza T.S.O., Estrada J.M., Lebrero R., Muñoz R. 444
Biotechnologies for greenhouse gases (CH4, N2O, and CO2) abatement: state of the art
445
and challenges. Appl Microbiol Biotechnol, 2013, 97: 2277–2303. 446
14. Lowry, O., Rosenbrough, N., Farr, A., Randall, R., Protein measurement with 447
the folin phenol reagent. J. Biol. Chem. 1951, 193: 265−275. 448
15. Meier, L., Barros, P., Torres, A., Vilchez, C., Jeison, D. Photosynthetic biogas 449
upgrading using microalgae: Effect of light/dark photoperiod. Renewable Energy, 2017, 450
106, 17-23. 451
16. Mooij, P.R., Stouten, G.R.; Tamis, J.; van Loosdrecht, M.C.M., Kleerebezem R., 452
20 17. Mooij, P.R., de Graaff, D.R., van Loosdrecht, M.C.M., Kleerebezem R., Starch 454
productivity in cyclically operated photobioreactors with marine microalgae—effect of 455
ammonium addition regime and volume exchange ratio. J Appl Phycol, 2015, 27: 1121. 456
18. Muñoz R., Meier L., Díaz I., Jeison D., A review on the state-of-the-art of 457
physical/chemical and biological technologies for biogas upgrading, Rev. Environ. Sci. 458
Biotechnol. 2015, 14(4): 727-759. 459
19. Park J.B.K., Craggs R.J., Wastewater treatment and algal production in high rate 460
algal ponds with carbon dioxide addition, Wat. Sci. Technol. 2010, 61: 633–639. 461
20. Posadas, E., Marín, D., Blanco, S., Lebrero, R., & Muñoz, R. Simultaneous 462
biogas upgrading and centrate treatment in an outdoors pilot scale high rate algal pond. 463
Bioresource Technology, 2017, 232, 133-141. 464
21. Posadas E., Morales M. M., Gómez C., Acién F. G., Muñoz R., Influence of pH 465
and CO2 source on the performance of microalgae-based secondary domestic
466
wastewater treatment in outdoors pilot raceways, Chem. Eng. J. 2015, 265: 239-248. 467
22. Raeesossadati M.J., Ahmadzadeh H., McHEnry M.P., Moheimani N.R. CO2
468
bioremediation by microalgae in photobioreactors: Impacts of biomass and CO2
469
concentrations, light, and temperature, Algal Res. 2014, 6: 78-85. 470
23. Raven, J. A., Beardall, J. 2003. Carbohydrate metabolism and respiration in 471
algae. In Photosynthesis in algae. pp. 205-224. Springer Netherlands. 472
24. Sander R. Compilation of Henry’s Law Constants for Inorganic and Organic 473
Species of Potential importance in Environmental Chemistry 1999. 474
25. Serejo, M.L., Posadas, E., Boncz, M.A., Blanco, S., García-Encina, P., Muñoz, 475
R., Influence of biogas flow rate on biomass composition during the optimization of 476
biogas upgrading in microalgal-bacterial processes. Environ. Sci. Technol. 2015, 49: 477
21 26. Toledo-Cervantes A., Serejo M., Blanco S., Pérez R., Lebrero R., Muñoz R., 479
Photosynthetic biogas upgrading to bio-methane: boosting nutrient recovery via 480
biomass productivity control. Algal Res., 2016, 17: 56-52. 481
27. Toledo-Cervantes, A., Estrada, J. M., Lebrero, R., Muñoz, R. A comparative 482
analysis of biogas upgrading technologies: Photosynthetic vs physical/chemical 483
processes. Algal Res., 2017a. 25: 237-243. 484
28. Toledo-Cervantes, A., Madrid-Chirinos, C., Cantera, S., Lebrero, R., Muñoz, R. 485
Influence of the gas-liquid flow configuration in the absorption column on 486
photosynthetic biogas upgrading in algal-bacterial photobioreactors, Bioresour. 487
Technol, 2017b, 225: 336-342. 488
29. United Nations (2015) Climate change (Last access: March 2017): 489
http://www.cop21.gouv.fr/en/ 490
30. Warmuzinski K., Tanczyk M., Jaschik M., Experimental study on the capture of 491
CO2 from flue gas using adsorption combined with membrane separation, Int. J.
492
Greenh. Gas Con. 2015, 37: 182-190. 493
31. World Bank. 2014. World Development Indicators: Energy dependency, 494
efficiency and carbon dioxide emission, (Last access: March 2017): 495
http://wdi.worldbank.org/table/3.8 496
32. Zamalloa, C., Vulsteke, E., Albrecht, J., & Verstraete, W. The techno-economic 497
potential of renewable energy through the anaerobic digestion of microalgae. 498
22 Figure captions
500
501
Figure 1. Schematic diagram of the experimental system used for the photosynthetic 502
CO2 removal from biogas and flue-gas.
503
Figure 2. Time course of a) the CO2 (○) and H2S (▲) removal efficiencies; and b) the
504
upgraded biogas composition CH4 (●), CO2 (■), N2 (□) and O2 (+).
505
Figure 3. Time course of the total nitrogen (TN) concentration in the cultivation broth. 506
Open circles represent the nitrogen concentration at the end of the dark period where the 507
nitrogen supplementation took place (8:00 am) and solid squares represent the nitrogen 508
concentration at the end of the illuminated period (8:00 pm). 509
Figure 4. Biomass concentration (■) and carbohydrates productivity (white bars) 510
Table 1. Abiotic removal efficiencies and upgraded biogas composition obtained at
different liquid to biogas flow rate ratios (L/G).
Removal efficiencies
(%) Upgraded biogas composition (%)
L/G H2S CO2 CH4 H2S CO2 N2 O2
1 88.2 ± 1.3 61.6 ± 3.1 84.1 ± 0.4 0.05 ± 0.0 10.6 ± 1.1 4.1 ± 1.0 2.2 ± 0.1
4 93.2 ± 0.4 76.6 ± 1.5 85.9 ± 0.6 0.03 ± 0.0 6.7 ± 0.1 6.0 ± 0.7 3.5 ± 0.2
7 95.5 ± 1.3 89.6 ± 2.3 81.3 ± 0.3 0.02 ± 0.0 3.1 ± 0.4 14.3 ± 2.5 6.5 ± 0.9
11 98.6 ± 0.9 90.8 ± 3.0 82.8 ± 0.1 0.01 ± 0.0 2.7 ± 1.2 13.2 ± 2.5 7.1 ± 0.5
Table
Table 2. Average values for operating parameters recorded during flue-gas cleaning.
Stage pH DO
(mg-O2 L-1)
Productivity (g m-2 d-1)
CO2 removal (%)
IB 10.1 ± 0.1 10.7 ± 0.8 8.3 ± 0.2 99.8 ± 0.7
IIB 10.5 ± 0.4 8.7 ± 0.3 6.7 ± 0.1 99.3 ± 0.1
IIIB 10.4 ± 0.2 6.0 ± 0.2 6.8 ± 0.3 99.3 ± 0.0
Table 3. Biochemical composition of algal biomass under different nutrition strategies
Stage
I-IIB (Regular nutrition)
IIIB IVB
N-famine - light
N-NO3- - dark
N-Famine - light
N-NH4+ - dark Carbohydrates
(mg gb-1)
221.4 ± 56.2 439.9 ± 32.3 369.7 ± 27.9 453.6 ± 58.1 378.3 ± 11.9
Figure 1
Figure 2
Figure 3
Figure 4
Data Statement