Hospitalization and mortality in Mexico
due to breast cancer since its inclusion
in the catastrophic expenditures scheme
Carmelita Elizabeth Ventura-Alfaro, MSc,(1) Gabriela Torres-Mejía, PhD,(1) Leticia del Socorro Ávila-Burgos,PhD.(2)
(1) Centro de Investigación en Salud Poblacional, Instituto Nacional de Salud Pública. Cuernavaca, México. (2) Centro de Investigación en Sistemas de Salud, Instituto Nacional de Salud Pública. Cuernavaca, México.
Received on: January 16, 2015 • Accepted on: July 28, 2015
Corresponding author: Carmelita Elizabeth Ventura Alfaro. Instituto Nacional de Salud Pública. Av. Universidad 655, col. Santa María Ahuacatitlán. 62100 Cuernavaca, Morelos, México.
Email: [email protected]
Ventura-Alfaro CE, Torres-Mejía G, Ávila-Burgos LS. Hospitalization and mortality in Mexico due to breast cancer since its inclusion in the catastrophic expenditures scheme. Salud Publica Mex 2016;58:187-196.
Abstract
Objective. To compare trends in hospital discharges and
mortality due to breast cancer (BC) in Mexico from 2004 to 2012 by insurance condition before and after incorpora-ting BC comprehensive treatment into the System of Social Protection in Health (Sistema de Protrección Social en Salud, SPSS) in 2007. Materials and methods. Data on BC hospital discharges and mortality reported in women aged 25 years and over were obtained from the National Health Information System. Mortality rates were adjusted by age and state. Results. At the national level, a growing tendency in hospital discharges was observed, mainly for women without social security, while mortality rate remained constant. Mortality rates by state show that lower marginalization index corresponded to higher mortality. Conclusions. A differential behavior was observed among women according to insurance condition, partly due to the inclusion of BC treatment in the SPSS.
Keywords: breast cancer; mortality rate; hospitalization; Mexico
Ventura-Alfaro CE, Torres-Mejía G, Ávila-Burgos LS. Hospitalización y mortalidad en México
por cáncer de mama a partir de su inclusión en el esquema de gastos catastróficos. Salud Publica Mex 2016;58:187-196.
Resumen
Objetivo. Comparar las tendencias de egresos hospitalarios
y mortalidad por cáncer de mama (CaMa) en México de 2004 a 2012, según esquema de aseguramiento, antes y después de la incorporación del tratamiento integral del CaMa al Sistema de Protección Social en Salud (SPSS) en 2007. Material y
métodos. Los egresos hospitalarios y de mortalidad por
CaMa en mujeres de 25 años o más se obtuvieron del Sistema Nacional de Información en Salud. Las tasas de mortalidad se ajustaron por edad y entidad federativa. Resultados. A nivel nacional, hubo una tendencia creciente de los egresos hospitalarios, principalmente para mujeres sin seguridad social, mientras que la tasa de mortalidad se mantuvo constante. Las tasas de mortalidad fueron mayores en estados con menor índice de marginación. Conclusiones. Se observó un com-portamiento diferencial entre las mujeres según esquema de aseguramiento en salud debido, en parte, a la inclusión del tratamiento de CaMa al SPSS.
Palabras clave: cáncer de mama; tasa de mortalidad; hospi-talización; México
W
orldwide, breast cancer (BC) is the most common cancer among women. In 2012, more than 1.67 million new cases were diagnosed, representing one in four cancers among women (25.2%) and 12% of all can-cers.1 Breast cancer is the fifth leading cause of cancerAlthough Mexico is one of the 10 countries with the lowest incidence and mortality rates in the Ameri-cas,1,2 standardized mortality rates per 100 000 women aged 25 years and older in 2009 ranged between 9.10 and 26.69 in the individual states.3 A trend of increas-ing standardized mortality rates, which rose from 11.7 to 17.0 deaths per 100 000 women aged 25 years and over between 1980 and 2009, was observed.3
There are no figures available on the incidence of BC because Mexico does not have a histopathological cancer registry. However, less than 10% of BC cases are estimated to be detected in a timely manner.4,5 and 50-80% of those cases are found in advanced stages.5,6 In Mexico5,7,8 and other countries,9-12 low screening coverage13 and diagnostic delay cause lower survival, lower quality of life, less efficient use of resources and, above all, increased mortality.
A policy that reformed the Mexican health sys-tem was established in 2003.14 The System of Social Protection in Health (Sistema de Protección Social en Salud, SPSS) was established. SPSS provisions entered into force in 2004. The main financial component of SPSS is voluntary public insurance, known as Popular Insurance (Seguro Popular).15 Another com-ponent of the SPSS is the Fund for Protection against Catastrophic Expenditures (Fondo de Protrección contra
Gastos Catastróficos, FPGC), which aims to support the Mexican population that lacks any health insurance scheme in the care of high-cost diseases and those that cause catastrophic expenditures.14-16 In 2007, a com-prehensive BC treatment was included in the FPGC and thereby guaranteed that Mexican women with BC have access to comprehensive and free medical care in units certified by the SPSS.14
A greater increase in the number of hospital dis-charges in hospitals affiliated with the SPSS than in the social security hospitals could be expected due to the decrease of financial barriers through the incorporation of BC into the FPGC; consequently, a decrease in BC mortality rates should be expected.17 In this context, the aim of this study was to examine the trends in hospital discharges and mortality by BC in Mexico from 2004 to 2012 according to insurance scheme to identify the medium-term changes that have been caused by the inclusion of the comprehensive BC treatment into the FPCE of the SPSS since 2007.
Materials and methods
Design
An ecological study was conducted to compare trends in hospital discharges and mortality from BC in Mexico
from 2004 to 2012 among women aged 25 years and older, according to insurance scheme before and after the inclusion of the comprehensive BC treatment into the FPGC of the SPSS in 2007. This period was chosen because the SPSS entered into force in 2004 and based on the availability of hospital databases at the time the analysis was performed.
Information sources
Data on hospital discharge and mortality in the period 2004-2012 were disaggregated by age, federal state and insurance scheme. Databases in dynamic cube format, which are available on the website of the General Directorate of Health Information (Dirección General de Información en Salud, DGIS) of the National Health Information System, constituted the data source.18 The International Statistical Classification of Diseases and Related Health Problems (CIE-10) code C50 was used to identify the pathology of interest. Projections of the female population disaggregated by age, federal state and insurance scheme for the years 1998-2011 and 2010-2015, conducted by the College of Mexico and the National Population Council (Consejo Nacional de Po-blación, Conapo), were also used.18 The marginalization index estimated by the Conapo19 was included in the analysis to include the heterogeneity of socioeconomic development between federative states. The study was authorized by the ethics and research committees of the National Institute of Public Health (Instituto Nacional de Salud Pública, INSP) record number 774.
Information analysis
Information tables about women with BC aged 25 years or older were built per year, federal state and insur-ance scheme with data from the databases, drawing from discharge and mortality information. Discharges and deaths with unspecified age (0.006 and 0.057%, respectively) were excluded. Specific mortality rates among age groups of women aged 25 years and older were calculated at the national and federative state levels. For comparison purposes, it was standardized for age* within each group. Subsequently, the rates were adjusted by the direct method to eliminate the effects of any age difference between the insurance scheme, the federative states and the analyzed years.20 The standard population corresponded to the combined populations
of women aged 25 or older per analyzed year, nationally and by federative state. The annual percentage change was used to assess trends, and statistical significance was estimated using joinpoint* models.
Results
Hospital discharges for breast cancer
Nationally, joinpoint analysis allowed the two increase periods for uninsured women (UW), 2003-2007 and 2007-2012, to be distinguished, with mean annual in-creases of 0.9% (p=0.9) and 34.2% (p<0.05), respectively.
For insured women (IW), these percentages were 3.3% (p<0.05) and 4.2% (p<0.05), respectively (figure 1). The numbers of hospital discharges by federative state are shown in table I. During 2004-2009, the Federal District, Veracruz and Jalisco were highlighted as the states that concentrated the largest numbers of hospital discharges for BC. However, the increase was remarkable since 2009 for Jalisco and 2010 for Michoacan. As a result, from 2007 to 2012, the percentages of the mean annual increase of hospital discharge numbers nationwide and among UW were 14.8% (p<0.05) and 34.2% (p<0.05), respectively. By excluding the states of Michoacan and Jalisco, this trend continued, but at lower rates: 5.4% (p<0.05) and 9.8% (p<0.05), respectively.
Breast cancer mortality
The number of breast cancer deaths at the national level also showed an upward trend during the periods
Figure 1. HospitaldiscHargesinwomenwitH breastcanceraged 25 yearsorolder, accordingto insurancescHeme. mexico, 2004-2012
IW: Insured women (affiliated to the health services of the Mexican Social Security Institute, Institute for Social Security and Services for State Workers, Pemex, Navy Ministry or National Defense Ministry)
UW: Uninsured women (without any insurance scheme and affiliated with the System of Social Protection in Health)
Source: own calculations from the sectoral databases of hospital discharges, 2004-2012, General Direction of Health Information/Health Secretariat. Insured women Uninsured women National
IW without considering UW without considering National without considering Jalisco and Michoacan Jalisco and Michoacan Jalisco and Michoacan 0
5 000 10 000 15 000 20 000 25 000 30 000 35 000
2003 2004 2005 2006 2007 2008 2009 2010 2011 2012 2013
Number of hospital discharges
2004-2007 and 2007-2012 (figure 2a), with annual rates of 3.4% (p<0.05) and 3.9% (p<0.05). The analysis of mor-tality among women with and without social security showed that mortality was higher in IW; however, the annual growth rate during 2004-2007 was higher (4.2%,
p=0.3) in the UW group than in the the IW group (2.4%,
p<0.05). After 2007, deaths reached a higher rate in the
UW group, with an annual growth rate of 7.1% (p<0.05), while the death rate was 2.9% (p<0.05) in the IW group.
The mortality rates standardized by age in 25-year-old women or 25-year-older show that mortality remained constant over the 2004-2012 period nationally (figure 2b). However, when analyzed by insurance scheme, the mortality rates of the IW group were above the Table I
HospitaldiscHargesinwomenwitHbreastcanceraged 25 yearsorolder, accordingto insurancescHemeand Federativestate. mexico, 2004-2012
Federative state 2004 2005 2006 2007 2008 2009 2010 2011 2012 IW UW IW UW IW UW IW UW IW UW IW UW IW UW IW UW IW UW
Aguascalientes 113 319 70 283 179 159 96 196 76 214 91 424 85 733 105 514 74 344 Baja California 284 42 256 62 344 56 355 117 423 61 392 85 398 83 469 125 545 237 Baja California Sur 48 21 61 23 80 15 103 25 71 36 102 22 104 24 103 32 108 31
Campeche 20 9 25 6 33 25 29 21 35 11 37 4 42 15 29 32 22 58
Coahuila 354 70 314 98 401 70 447 66 418 77 382 110 406 134 470 106 538 135
Colima 51 12 64 19 74 27 66 39 42 47 53 41 71 58 63 69 85 71
Chiapas 88 40 78 46 61 39 66 48 75 40 100 39 83 53 67 60 92 67
Chihuahua 397 84 416 94 339 148 388 101 439 135 498 156 457 193 562 268 613 313 Federal District 3 158 2 372 3 014 2 035 3 241 2 142 3 373 1 876 3 438 2 090 3 504 2 138 3 561 2 382 3 895 2 382 3 745 2 246 Durango 54 50 59 80 106 100 115 70 152 106 119 109 134 96 146 87 148 170 Guanajuato 291 93 288 89 294 91 294 123 359 183 352 240 365 278 420 312 433 327
Guerrero 68 5 102 8 77 9 65 10 75 6 125 7 115 14 114 10 126 14
Hidalgo 73 17 89 18 63 20 32 24 44 22 52 14 43 12 55 16 45 13
Jalisco 848 86 989 122 934 114 898 202 967 202 1 036 2 797 1 109 4 097 1 191 3 990 1 176 4 596
Mexico 195 1 203 9 289 28 219 41 287 42 223 26 297 18 290 20 330 25
Michoacán 98 172 159 203 138 271 179 150 167 100 147 202 170 1 975 232 4 532 289 6 336 Morelos 101 12 115 7 113 10 129 9 110 24 103 43 159 46 165 53 171 49
Nayarit 79 26 68 35 81 49 53 55 75 77 74 96 77 59 59 61 104 115
Nuevo Leon 906 20 1 040 41 979 62 992 41 1 056 61 996 59 1 050 76 1 242 73 1 125 62 Oaxaca 89 47 79 44 93 84 117 103 108 164 102 181 128 160 153 165 140 187 Puebla 411 16 398 71 486 81 586 123 571 114 573 133 555 130 553 148 591 194 Queretaro 143 61 96 49 133 60 195 68 125 55 147 76 152 96 145 107 121 114
Quintana Roo 23 2 18 9 18 9 23 7 34 8 73 8 65 13 126 21 84 56
San Luis Potosi 105 72 125 87 119 90 127 103 108 130 126 125 145 104 173 167 151 178 Sinaloa 312 67 412 104 353 90 425 78 541 119 416 140 420 130 459 136 469 143 Sonora 211 93 226 69 243 101 251 118 251 126 303 135 266 164 261 171 345 168 Tabasco 100 79 79 135 93 115 74 89 93 93 90 149 72 90 128 286 99 338 Tamaulipas 558 99 501 144 653 151 652 178 532 166 644 194 776 192 866 172 989 197
Tlaxcala 6 6 7 10 2 4 10 6 8 12 13 6 13 7 10 2 28 6
Veracruz 839 145 779 221 1 133 311 736 298 773 355 831 333 928 376 823 377 755 510 Yucatan 221 17 224 19 231 25 253 28 254 58 262 71 218 72 202 84 218 104
Zacatecas 85 25 101 27 80 34 101 27 85 25 100 19 89 32 86 89 109 82
National 10 329 4 182 10 455 4 267 11 463 4 590 11 449 4 440 11 792 4 959 12 066 8 182 12 553 11 912 13 662 14 667 13 868 17 486
IW: Insured women (Mexican Social Security Institute, Institute for Social Security and Services for State Workers, Pemex, Navy Ministry or National Defense Ministry)
UW: Uninsured women (without any insurance scheme and affiliated with the System of Social Protection in Health)
Figure 2. deatHsandmortality* bybreastcancerinwomenaged 25 yearsorolder, byinsurance scHeme. mexico, 2004-2012
IW: Insured women (affiliated to the health services of the Mexican Social Security Institute, Institute for Social Security and Services for State Workers, Pemex, Navy Ministry or National Defense Ministry)
UW: Uninsured women (without any insurance scheme and affiliated with the System of Social Protection in Health) *Age-standardized rates
Source: own calculations from the mortality databases, 2004-2012, General Direction of Health Information/Health Secretariat. Insured population projections for 1998-2011 and 2010-2015, National Population Council / General Directorate of Health Information.
0 1 000 2 000 3 000 4 000 5 000 6 000
2003 2004 2005 2006 2007 2008 2009 2010 2011 2012 2013
Number of deaths
2a) Deaths
Insured women Uninsured women National
Mor
tality rate for 100 000
wo
men
2003 2004 2005 2006 2007 2008 2009 2010 2011 2012 2013 0.00
3.00 6.00 9.00 12.00 15.00 18.00 21.00
2b) Mortality*
Insured women Uninsured women National
national rates, opposite to the situation seen with the rates in UW. For IW, joinpoint analysis allowed the observation that the annual mortality rate remained constant for the 2004-2007 period; however, an annual percentage change of -1.9% (p=0.1) was observed for
group than in UW; this finding agrees with nationwide results (table II).
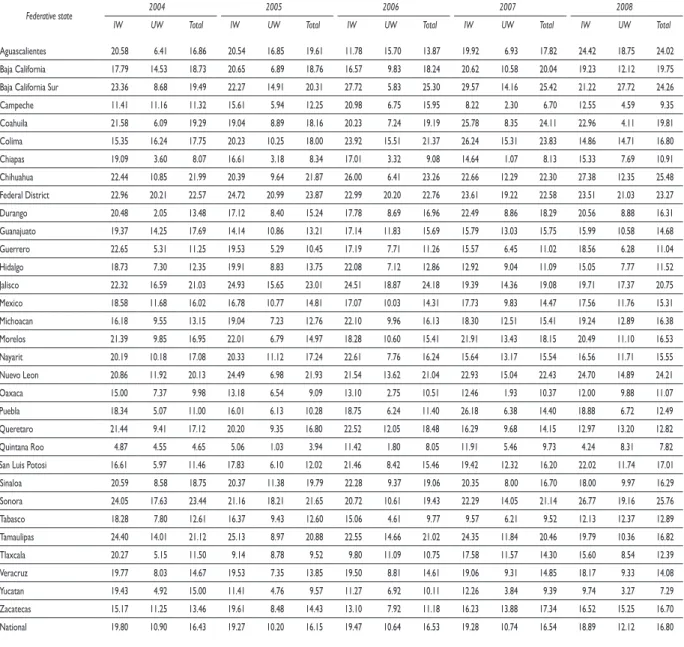
In general, the distribution of mortality rates by federative state indicates that BC remained constant until prior to 2007. From that year, the trends varied considerably, especially in those states with the high-est marginalization rate (figure 3a). This finding is consistent with what is shown in figure 3b, which suggests a decreasing trend in BC mortality in women
aged 25 years or older as the marginalization rate increases (2012).
Discussion
Nationally, a growing trend of hospital discharges was observed, particularly in UW, whereas mortality rates standardized by age in 25-year-old or older women remained constant. However, these rates decreased in
Table II
breastcancer* mortalityinwomenaged 25 yearsorolder, age-standardized, byinsurancescHemeandFederativestate. mexico, 2004-2012
Federative state 2004 2005 2006 2007 2008
IW UW Total IW UW Total IW UW Total IW UW Total IW UW Total
Aguascalientes 20.58 6.41 16.86 20.54 16.85 19.61 11.78 15.70 13.87 19.92 6.93 17.82 24.42 18.75 24.02 Baja California 17.79 14.53 18.73 20.65 6.89 18.76 16.57 9.83 18.24 20.62 10.58 20.04 19.23 12.12 19.75 Baja California Sur 23.36 8.68 19.49 22.27 14.91 20.31 27.72 5.83 25.30 29.57 14.16 25.42 21.22 27.72 24.26 Campeche 11.41 11.16 11.32 15.61 5.94 12.25 20.98 6.75 15.95 8.22 2.30 6.70 12.55 4.59 9.35 Coahuila 21.58 6.09 19.29 19.04 8.89 18.16 20.23 7.24 19.19 25.78 8.35 24.11 22.96 4.11 19.81 Colima 15.35 16.24 17.75 20.23 10.25 18.00 23.92 15.51 21.37 26.24 15.31 23.83 14.86 14.71 16.80 Chiapas 19.09 3.60 8.07 16.61 3.18 8.34 17.01 3.32 9.08 14.64 1.07 8.13 15.33 7.69 10.91 Chihuahua 22.44 10.85 21.99 20.39 9.64 21.87 26.00 6.41 23.26 22.66 12.29 22.30 27.38 12.35 25.48 Federal District 22.96 20.21 22.57 24.72 20.99 23.87 22.99 20.20 22.76 23.61 19.22 22.58 23.51 21.03 23.27 Durango 20.48 2.05 13.48 17.12 8.40 15.24 17.78 8.69 16.96 22.49 8.86 18.29 20.56 8.88 16.31 Guanajuato 19.37 14.25 17.69 14.14 10.86 13.21 17.14 11.83 15.69 15.79 13.03 15.75 15.99 10.58 14.68 Guerrero 22.65 5.31 11.25 19.53 5.29 10.45 17.19 7.71 11.26 15.57 6.45 11.02 18.56 6.28 11.04 Hidalgo 18.73 7.30 12.35 19.91 8.83 13.75 22.08 7.12 12.86 12.92 9.04 11.09 15.05 7.77 11.52 Jalisco 22.32 16.59 21.03 24.93 15.65 23.01 24.51 18.87 24.18 19.39 14.36 19.08 19.71 17.37 20.75 Mexico 18.58 11.68 16.02 16.78 10.77 14.81 17.07 10.03 14.31 17.73 9.83 14.47 17.56 11.76 15.31 Michoacan 16.18 9.55 13.15 19.04 7.23 12.76 22.10 9.96 16.13 18.30 12.51 15.41 19.24 12.89 16.38 Morelos 21.39 9.85 16.95 22.01 6.79 14.97 18.28 10.60 15.41 21.91 13.43 18.15 20.49 11.10 16.53 Nayarit 20.19 10.18 17.08 20.33 11.12 17.24 22.61 7.76 16.24 15.64 13.17 15.54 16.56 11.71 15.55 Nuevo Leon 20.86 11.92 20.13 24.49 6.98 21.93 21.54 13.62 21.04 22.93 15.04 22.43 24.70 14.89 24.21 Oaxaca 15.00 7.37 9.98 13.18 6.54 9.09 13.10 2.75 10.51 12.46 1.93 10.37 12.00 9.88 11.07 Puebla 18.34 5.07 11.00 16.01 6.13 10.28 18.75 6.24 11.40 26.18 6.38 14.40 18.88 6.72 12.49 Queretaro 21.44 9.41 17.12 20.20 9.35 16.80 22.52 12.05 18.48 16.29 9.68 14.15 12.97 13.20 12.82 Quintana Roo 4.87 4.55 4.65 5.06 1.03 3.94 11.42 1.80 8.05 11.91 5.46 9.73 4.24 8.31 7.82 San Luis Potosi 16.61 5.97 11.46 17.83 6.10 12.02 21.46 8.42 15.46 19.42 12.32 16.20 22.02 11.74 17.01 Sinaloa 20.59 8.58 18.75 20.37 11.38 19.79 22.28 9.37 19.06 20.35 8.00 16.70 18.00 9.97 16.29 Sonora 24.05 17.63 23.44 21.16 18.21 21.65 20.72 10.61 19.43 22.29 14.05 21.14 26.77 19.16 25.76 Tabasco 18.28 7.80 12.61 16.37 9.43 12.60 15.06 4.61 9.77 9.57 6.21 9.52 12.13 12.37 12.89 Tamaulipas 24.40 14.01 21.12 25.13 8.97 20.88 22.55 14.66 21.02 24.35 11.84 20.46 19.79 10.36 16.82 Tlaxcala 20.27 5.15 11.50 9.14 8.78 9.52 9.80 11.09 10.75 17.58 11.57 14.30 15.60 8.54 12.39 Veracruz 19.77 8.03 14.67 19.53 7.35 13.85 19.50 8.81 14.61 19.06 9.31 14.85 18.17 9.33 14.08 Yucatan 19.43 4.92 15.00 11.41 4.76 9.57 11.27 6.92 10.11 12.26 3.84 9.39 9.74 3.27 7.29 Zacatecas 15.17 11.25 13.46 19.61 8.48 14.43 13.10 7.92 11.18 16.23 13.88 17.34 16.52 15.25 16.70 National 19.80 10.90 16.43 19.27 10.20 16.15 19.47 10.64 16.53 19.28 10.74 16.54 18.89 12.12 16.80
…continuation
Federative state 2009 2010 2011 2012
IW UW Total IW UW Total IW UW Total IW UW Total
Aguascalientes 17.95 10.31 16.74 14.06 10.27 14.12 18.91 14.96 17.89 21.09 16.06 20.46 Baja California 20.80 12.00 19.87 18.84 12.24 18.88 17.14 13.05 18.47 18.13 14.19 19.15 Baja California Sur 23.97 18.85 22.47 24.00 6.18 18.34 24.65 12.09 21.74 20.49 16.35 19.03 Campeche 13.29 8.56 12.33 11.49 9.95 11.41 9.09 6.78 9.34 7.85 7.70 8.56 Coahuila 22.80 9.14 21.39 20.43 9.16 20.29 23.17 12.30 22.14 23.78 10.63 22.68 Colima 17.24 21.90 19.20 21.37 17.00 20.52 18.83 22.18 21.49 20.86 25.18 22.34 Chiapas 19.00 6.31 10.57 14.94 7.89 10.82 16.64 7.54 11.46 13.22 9.43 11.82 Chihuahua 23.36 14.86 23.01 18.86 15.20 19.29 24.52 11.77 23.36 22.04 10.43 20.06 Federal District 24.20 19.32 22.88 22.81 21.26 22.33 22.07 20.19 22.39 20.96 21.58 21.49 Durango 14.49 8.03 13.00 12.95 11.78 13.76 17.13 9.21 14.26 18.09 14.38 17.79 Guanajuato 15.73 12.17 14.59 13.28 10.86 12.84 17.98 11.74 15.66 17.07 13.96 16.09 Guerrero 17.98 7.45 11.85 22.41 5.89 12.34 15.74 5.93 10.41 17.25 6.21 11.05 Hidalgo 20.18 9.09 13.62 12.67 7.66 10.21 16.79 9.54 12.92 19.08 9.00 13.44 Jalisco 20.60 14.62 19.70 20.74 15.47 19.90 21.43 18.97 21.69 21.66 16.74 21.59 Mexico 16.78 9.95 14.06 15.41 11.64 13.99 15.06 10.71 13.56 14.73 11.69 13.81 Michoacan 24.21 14.97 19.28 17.38 13.62 15.91 17.85 10.69 14.75 17.87 14.22 16.49 Morelos 17.03 8.69 13.11 17.78 12.37 16.44 20.58 9.40 16.75 24.80 11.89 19.07 Nayarit 14.18 15.40 17.69 14.78 9.13 13.74 10.74 17.30 14.31 16.15 12.96 15.70 Nuevo Leon 22.24 15.33 22.32 22.07 13.06 22.17 20.92 11.38 19.62 22.40 10.51 20.78 Oaxaca 7.28 5.84 7.71 8.63 7.24 8.40 8.92 6.61 8.20 10.88 5.66 8.16 Puebla 21.57 7.34 12.98 16.71 6.36 11.04 16.78 6.71 11.16 17.50 7.24 12.49 Queretaro 22.70 12.59 18.67 19.14 9.90 15.66 14.58 11.10 13.70 16.28 14.94 16.31 Quintana Roo 6.88 4.79 6.73 8.98 1.51 7.00 7.85 4.37 6.83 10.08 6.14 9.14 San Luis Potosi 21.88 8.51 15.80 19.22 10.74 15.94 18.81 11.67 15.79 13.53 12.72 14.54 Sinaloa 23.01 13.24 20.51 20.83 8.21 17.40 16.36 7.72 14.82 19.44 17.07 19.79 Sonora 16.50 21.66 19.76 22.12 20.60 22.05 19.12 17.50 19.24 19.64 23.95 21.84 Tabasco 13.96 10.31 12.22 14.92 11.93 13.45 10.11 10.02 11.18 12.44 11.05 12.08 Tamaulipas 21.90 11.77 19.54 20.37 13.51 18.96 21.47 10.94 18.23 20.63 10.00 17.69 Tlaxcala 20.54 7.40 13.26 12.85 9.37 10.56 11.43 6.69 9.88 14.36 8.87 12.24 Veracruz 24.25 8.76 15.48 15.75 10.24 14.36 16.30 11.68 14.45 18.98 11.41 16.31 Yucatan 14.58 7.37 12.02 12.92 5.60 10.64 14.37 6.52 12.96 10.35 12.49 12.07 Zacatecas 19.45 7.41 13.92 19.18 9.61 15.30 17.01 7.68 12.76 19.62 13.51 17.67 National 19.67 11.67 16.60 17.55 11.94 15.85 17.62 11.83 15.93 17.90 12.94 16.57
* Mortality rate per 100 000 women aged 25 years or older
IW: Insured women (affiliated to the health services of the Mexican Social Security Institute, Institute for Social Security and Services for State Workers, Pemex, Navy Ministry or National Defense Ministry)
UW: Uninsured women (without any insurance scheme and affiliated with the System of Social Protection in Health)
Source: Own calculations from mortality databases, 2004-2012, General Direction of Health Information/Health Secretariat. Insured population projections for 1998-2011 and 2010-2015, National Population Council / General Directorate of Health Information.
IW from 2009, while in UW, rates increased from 2007. In addition, mortality rates were higher in federative states with low marginalization levels than in states with high marginalization levels.
The results of this study show an increase in the number of hospital discharges for BC from the inclu-sion of the comprehensive BC treatment into the FPGC.
*Aged-standardized rate
Source: own calculations from mortality databases 2012, General Direction of Health Information/Health Secretariat. Insured population projections 2010-2015, Marginalization index data. National Population Council/General Directorate of Health Information, 2010
Figure 3. breastcancer* andmarginalizationindexinwomenaged 25 yearsorolder, byFederative state. mexico, 2004-2012
2003 2004 2005 2006 2007 2008 2009 2010 2011 2012 2013
Mor
tality rate for 100 000
wo
men
3a) According to the federative state with the lowest and highest rate of marginalization
5.00 7.00 9.00 11.00 13.00 15.00 17.00 19.00 21.00 23.00 25.00
Chiapas Oaxaca
Guerrero National
Baja California Nuevo Leon
Federal District
3b) By federative state, Mexico 2012
Coahuila Colim
a
Sonora Jalisco
Fe
deral District Nu
ev
o Leon
Aguascalientes
Chihuahua
Sinalo
a
Baja Californi
a
Mor
elos
Baja California Sur
Durang
o
Ta
maulipas Zacateca
s
Michoacan Quer
eta
ro
Veracruz
Guanajuato
Na
yari
t
San Luis
Po
tosi
Mexico Hidalgo Puebl
a
Tlaxcala Yucata
n
Ta
basc
o
Chiapas
Guer
re
ro
Quintana Ro
o
Campeche
Oaxaca
0.00 5.00 10.00 15.00 20.00 25.00
-2.00 -1.50 -1.00 -0.50 0.00 0.50 1.00 1.50 2.00 2.50 3.00
noted, which could result from a difference from the other states in terms of the hospitalization criteria. Simi-larly, other studies have shown an increase in the use of public hospital services associated with an increased SPSS affiliation,22,23 which is more pronounced when the condition is included in the FPGC.24 This finding is consistent with studies stating that when removing financial barriers to access the health services, there is an increased utilization of hospital health services, par-ticularly in populations that did not use these services previously..25,26
The number of deaths and the mortality rates ex-perienced growing trends nationwide, which contrasts with expected results given the greater availability and access to health services.27,28 Studies in other countries have suggested, after a reform in the health system, that the health coverage improvement increases the use of services and decreases mortality.29-31 However, this reduction is hampered by inequalities in educa-tion30,32 and socioeconomic levels.29,32 Thus, in Mexico, Bautista-Arredondo et al.32 found that people with lower education levels and who are poorer are less likely to access outpatient medical services, even if the service is a beneficiary of SPSS. This finding suggests that the coverage of social health protection is a necessary but insufficient condition to reduce inequalities in access to primary outpatient care. This factor may be one reason why such a result in this study was not found, as most members of the SPSS are located in groups with social inequalities. Another possible explanation is that breast cancer in women is detected at an advanced clinical stage; thus, improvements should be incorporated in terms of access, screening by mammography, and the timeliness of diagnosis and treatment. Another expla-nation could correspond to the fact that FPGC covers only the costs of the disease; however, the infrastructure, equipment and the number of available spots may not be sufficient to provide the treatment with the required timeliness and quality.33 Subsequent studies could deepen these hypotheses, with the additional advantage that the period of inclusion of breast cancer in the FPGC would be higher.
In Mexico, there is a legal and regulatory framework for universal access to BC treatment; however, this frame-work needs to be translated into effective and timely access to a health services infrastructure and sufficient human resources to meet the demand of such services.14 However, increasing the available information about the benefits of using FPGC through awareness campaigns about the existing regulations to both health care provid-ers and women would be advisable.
The nationwide breast cancer mortality rates in women aged 25 years or older presented here are similar
to those reported in other studies.3,34 However, this study is one of the first that takes into account the insurance scheme, which gives an added value to generate an hypotheses about the differential impact of the inclu-sion of comprehensive BC treatment between FPGC populations with and without social security.
One limitation of this study is that it does not mea-sure BC prevalence and incidence because the number of hospital discharges is different from the number of patients. Moreover, for some years (2005 and 2011), no reliable data at the national and federative state levels were available on the number of hospital discharges for BC per age group. To resolve this issue, some popula-tions for which the number of hospital discharges for BC was not available were estimated; therefore, the results may not reflect actual trends for these years. This estimation is a limitation of this study because of the lack of population information disaggregated by age groups and the lack of access to original source data (i.e., medical records). Another limitation of the study is not upholding the correlations between mortality rates and some determinants of health inequalities because they were not part of the objectives of this study. How-ever, this analysis attempts to establish the foundations to perform other studies in greater depth that could identify the factors that limit the effects of including comprehensive BC treatment in the FPGC.
In conclusion, the results of this study suggest that trends in mortality rates among women are heteroge-neous according to insurance scheme and are higher for UW than for IW, who showed a decreasing trend. These findings could be a reflection of differences in socioeco-nomic status or could be because the coverage of mam-mography screening is higher among IW than among UW.7 This difference results in BC treatment beginning at an earlier stage for IW than for UW. Although the current FPGC operation has not yet shown the desired change in the health indicator, improvements in access, strengthening the mechanisms to recruit women to the SPSS, and ensuring the implementation of regulations and consolidating systems for training, evaluation, monitoring and compliance of operating regulations and treatment guides for BC systems is necessary. The adaptation of the established capacity to the demand for services is necessary, as is the development of a leadership capacity of health authorities to fulfill the roles of coordination and regulation. These changes would improve equity in access to BC treatment care and would inform on population-wide results.
References
1. Ferlay J, Soerjomataram I, Ervik M, Dikshit R, Eser S, Mathers C, et al. Globocan 2012 v1.0, Cancer Incidence and Mortality Worldwide: IARC CancerBase No. 11 [internet document]. 2012 [consulted 2014 April 12]. Available at: http://globocan.iarc.fr
2. Organización Panamericana de la Salud. Cáncer de mama en las Améri-cas. Washington, DC: OMS, 2014.
3. de la Vara-Salazar E, Suárez-López L, Ángeles-Llerenas A, Torres-Mejía G, Lazcano-Ponce E. Tendencias de la mortalidad por cáncer de mama en México, 1980-2009. Salud Publica Mex 2011;53(5):385-393.
4. Secretaría de Salud. Programa de acción: cáncer de mama, 2007-2012. México: Secretaría de Salud, 2007.
5. Bright K, Barghash M, Donach M, de la Barrera M, Schneider R, Formenti S. The role of health system factors in delaying final diagno-sis and treatment of breast cancer in Mexico City, Mexico. The Breast 2011;20(Suppl 2):S54-S59.
6. Mohar A, Bargalló E, Ramírez M, Lara F, Beltrán-Ortega A. Recursos dis-ponibles para el tratamiento del cáncer de mama en México. Salud Publica Mex 2009;51(Suppl 2):S263-S269.
7. Unger-Saldaña K, Infante-Castañeda C. Breast cancer delay: a grounded model of help-seeking behaviour. Soc Sci Med 2011;72(7):1096-1104. 8. Nigenda G, Caballero M, González-Robledo L. Barreras de acceso al diagnóstico temprano del cáncer de mama en el Distrito Federal y en Oaxaca. Salud Publica Mex 2009;51(Suppl 2):S254-S262.
9. Piñeros M, Sánchez R, Perry F, García O, Ocampo R, Cendales R. Demo-ras en el diagnóstico y tratamiento de mujeres con cáncer de mama en Bogotá, Colombia. Salud Publica Mex 2011;53(6):478-485.
10. Hafström L, Johansson H, Ahlberg J. Diagnostic delay of breast cancer: an analysis of claims to Swedish Board of Malpractice. The Breast 2011;20(6):539-542.
11. Norsa’adah B, Rampal K, Rahmah M, Naing N, Biswal B. Diagnosis delay of breast cancer and its associated factors in Malaysian women. BMC Cancer 2011;17(11):141.
12. Richardson L, Royalty J, Howe W, Helsel W, Kammerer W, Benard V. Timeliness of breast cancer diagnosis and initiation of treatment in the National Breast and Cervical Cancer Early Detection Program, 1996-2005. Am J Public Health 2010;100(9):1769-1776.
13. Torres-Mejía G, Ortega-Olvera C, Ángeles-Llerenas A, Villarobos-Hernández AL, Salmerón-Castro J, Lazcano-Ponce E, et al. Patrones de utilización de programas de prevención y diagnóstico temprano de cáncer en la mujer. Salud Publica Mex 2013;55(Suppl 2):S241-S248.
14. Knaul F, Nigenda G, Lozano R, Arreola-Ornelas H, Langer A, Frenk J. Cáncer de mama en México: una prioridad apremiante. Salud Publica Mex 2009;51(Suppl 2):S335-S344.
15. Frenk J, Gonzalez-Pier E, Gomez-Dantes O, Lezama M, Knaul F. Comprehensive reform to improve health system performance in Mexico. Lancet 2006;368(9546):1524-1534.
16. Knaul F, Frenk J. Health insurance in Mexico: achieving universal cove-rage through structural reform. Health Affairs 2005;24(6):1467-1476. 17. Secretaría de Salud. Programa Sectorial de Salud 2013-2018. México, DF: Diario Oficial de la Federación, 2013.
18. Base de datos en formato de cubo dinámico, 2004-2012. Sistema Nacional de Información en Salud (SINAIS), Secretaría de Salud [internet document] [consulted 2014 June 10]. Available at: http://dgis.salud.gob. mx/cubos
19. de la Vega-Estrada S, Romo-Viramontes R, González-Barrera A. Índice de marginación por entidad federativa y municipio 2010. México, DF: Consejo Nacional de Población, 2011.
20. Gordis L. Epidemiología. 3° ed. Barcelona: Elservier Saunders, 2004. 21. Gakidou M, Lozano R, González-Pier E, Abbot-Klafter J, Barofsky JT, Bryson-Cahn C, et al. Assesing the effect of the 2001-06 Mexican health reform: an interim repord card. Lancet 2006;368(9550):1920-1935. 22. González-Block M, Sauceda-Valenzuela A, Santa Ana-Téllez Y. Factores asociados a la demanda de servicios para la atención del parto en México. Salud Publica Mex 2010;52(5):416-423.
23. Sosa-Rubi S, Galarraga O, Harris J. Heterogeneous impact of the “Segu-ro Popular” p“Segu-rogram on the utilization of obstetrical services in Mexico, 2001-2006: a multinomial probit model with a discrete endogenous variable. Nber Working Paper Series No. 13498, 2007.
24. Navarrete-López M, Puentes-Rosas E, Pineda-Pérez D, Martínez-Ojeda H. El papel del Fondo de Protección contra Gastos Catastróficos en la cobertura de atención a pacientes con cataratas. Salud Publica Mex 2013;55(4):394-398.
25. Rashidian A, Joudaki H, Khodayari-Moez E, Omranikhoo H, Geraili B, Arab M. The impact of rural health system reform on hospitalization rates in the Islamic Republic of Iran: an interrupted time series. Bull World Health Organ 2013;91(12):942-949.
26. Xu K, Evans D, Kadama P, Nabyonga J, Ogwal PO, Nabukhenzo P, et al. Undestanding the impact of eliminating user fees: Utilization and catastro-phic health expenditures in Uganda. Soc Sci Med 2006;62:866-876. 27. Wheeler S, Carpenter W, Peppercorn J, Schenck A, Weinberger M, Biddle A. Sctructural/organizational characteristics of health services partly explain racial variation in timeliness of radiation therapy among elderly breast cancer patients. Breast Cancer Res Treat 2012;133(1):333-345. 28. Gerend M, Pai M. Social determinants of black-white disparities in breast cancer mortality: a review. Cancer Epidemiol Biomarkers Prev 2008;17(11):2913-2923.
29. Cheng S, Chiang T. The effect of universal health insurance on health care utilization in Taiwan. JAMA 1997;278(2):89-93.
30. Arroyave I, Cardona D, Burdorf A, Avendano M. The impact of increa-sing health insurance coverage on disparities in mortality: health care re-form in Colombia, 1998-2007. Am J Public Health 2013;103(3):e100-e106. 31. Sommers B, Long S, Baicker K. Changes in mortality after Massachu-setts health care reform. Ann Intern Med 2014;160:585-593.
32. Bautista-Arredondo S, Serván-Mori E, Colchero A, Ramírez-Rodríguez B, Sosa-Rubí S. Análisis del uso de servicios ambulatorios curativos en el contexto de la reforma para la protección universal en salud en México. Salud Publica Mex 2014;56(1):18-31.
33. Consejo Nacional de Evaluación de la Política de Desarollo Social. Indicadores de acceso y uso efectivo de los servicios de salud afiliados al Seguro Popular. México, DF: Coneval, 2014.