Validation study of systems for noninvasive diagnosis
of fibrosis in nonalcoholic fatty liver disease in Latin population
Ome Z. Pérez-Gutiérrez,* Cristian Hernández-Rocha,** Roberto A. Candia-Balboa,** Marco A. Arrese,** Carlos Benítez,** Diana C. Brizuela-Alcántara,*
Nahum Méndez-Sánchez,* Misael Uribe,* Norberto C. Chávez-Tapia*
*Obesity and Digestive Disease Unit, Medica Sur Clinic & Foundation, México. **Department of Gastroenterology, Pontificia Universidad Católica de Chile. Santiago, Chile.
ABSTRACT
Background. The incidence of liver cirrhosis is significantly high in Latin population. The high prevalence of nonalcoholic fatty liver disease NAFLD is likely partially responsible for these figures. Liver biopsy is not a practical diagnostic option in this scenario. The validation of noninvasive markers of fibrosis is important
in populations with a high prevalence of NAFLD. Aim. To compare the diagnostic value of noninvasive
as-sessment systems to detect fibrosis in a cohort of Latin patients with biopsy-proven NAFLD. Material and
methods. Patients with biopsy-proven NAFLD were included. Noninvasive evaluations included calculations of NAFLD fibrosis, FIB-4, BARD scores, APRI, and AST/ALT ratio. The sensitivity, specificity, positive predicti-ve value, negatipredicti-ve predictipredicti-ve value, and area under the receipredicti-ver-operating characteristic curpredicti-ve (AUROC)
were calculated. Results. A total of 228 patients (mean age, 48.6 ± 12.7 years) were included. Fifty-one
per-cent were women; 48% were overweight and 23% were obese. The severity of fibrosis was classified as G0, 56.6%; G1, 25%; G2, 6.6%; G3, 7%; and G4, 4.8%. The AUROC values for advanced fibrosis were 0.72 for the NAFLD fibrosis score, 0.74 for FIB-4 score, 0.67 for AST/ALT ratio, 0.66 for APRI score, and 0.65 for BARD score. In 54% of patients with undetermined FIB-4 score and in 60% of patients with undetermined
NA-FLD fibrosis score, fibrosis was observed in the liver biopsy. Conclusions. The NAFLD fibrosis, FIB-4, and
APRI scores can be used for the noninvasive diagnosis of fibrosis. However, 25% of patients evaluated by these methods have an indeterminate degree of fibrosis.
Key words. Biopsy. Mexico. Chile. Evaluation studies. Biomarkers.
Correspondence and reprint request: Norberto C. Chávez-Tapia, M.D. Obesity and Digestive Diseases Unit, Medica Sur Clinic & Foundation Puente de Piedra, Núm. 150, Col. Toriello Guerra, Tlalpan 14050, Mexico City, México.
E-mail: [email protected]
Manuscript received: December 5, 2012. Manuscript accepted: January 09, 2013.
INTRODUCTION
Nonalcoholic fatty liver disease (NAFLD) refers to a broad spectrum of liver damage that varies from fat deposition in the hepatocytes (steatosis) to chronic inflammatory damage (non-alcoholic steatohepatitis [NASH]). Patients with NASH are at risk of develop-ing fibrosis and liver cirrhosis, and their
complica-tions.1 Of note, the presence and severity of fibrosis
dictates both overall and liver-related mortality in patients with NAFLD.2 Liver biopsy is the gold
standard for assessing fibrosis. Moreover, it pro-vides direct information about inflammation, degree of steatosis, iron deposition, and other findings. However, liver biopsy has several limitations, including its cost, complications, and variability between observers, within the sample and the gastroenterologist’s sampling technique.3-6
There-fore, the development of noninvasive markers for the diagnosis of fibrosis in patients with NAFLD has become important in clinical practice.7 Many
a more accurate reflection of global liver fibrosis. The accuracy of transient elastography (Fibros-can™) has been demonstrated in meta-analysis for the detection of advance liver fibrosis and early liver cirrhosis.8-10
The clinical and biological variables most frequently associated with advanced fibrosis in NAFLD are advanced age, elevated body mass index (BMI), type 2 diabetes mellitus, the metabolic syndrome, increased aspartate aminotransaminase (AST)/alanine aminotransferase (ALT) ratio (AAR), and decreased platelet count.12 These
variables are included in some of the evaluation tools for non-invasive assessment of fibrosis. Some of these scores are made based on simple mathematical standardized formulas (e.g., AAR), whereas others such as the FIB-4 and NAFLD fibrosis scores require more complex mathematical algorithms, although these can be calculated easi-ly with on-line calculators (http://nafldscore.com). Compared with other liver diseases, only a limited number of serum markers have been evaluated to predict fibrosis in NAFLD patients. These scores include the AST-to-Platelet Ratio Index (APRI), AAR, BARD score, FIB-4, and NAFLD fibrosis score.7,12 These have been validated against the
current gold standard, the liver biopsy, and have been applied in many clinical settings, although the accuracy differs between populations. A valid method for detecting fibrosis in patients with NA-FLD is needed for large populations in which liver biopsy is not feasible. Thus, it is essential to deve-lop noninvasive markers of fibrosis in populations with a high prevalence of NAFLD, such as the Latin population.13-18 In Mexico, this disease is
es-timated to be the most prevalent cause of cirrhosis in women and the second leading cause in men, and it is expected that about one million people will have fatty liver cirrhosis in 2050.19 In Chile, the
age-adjusted mortality rate for cirrhosis is among the highest in the world (32/100,000 habi-tants).20 This is not completely explained by the
prevalence of hepatitis C or alcohol consumption which are lower or similar to other populations.21
Thereby, the high prevalence of liver steatosis in a population-based study with ultrasound was 23%21 may explain this difference. This
hig-hlights the need to develop a convenient and inexpensive tool for clinical practice. The aim of this study was to compare the diagnostic utility of several scores used in the noninvasive eva-luation of fibrosis in patients with NAFLD in the Latin population.
MATERIAL AND METHODS
Information was obtained about patients with NAFLD undergoing liver biopsy during of cholecys-tectomy due to abnormal liver test, performed in the Department of Pathology at Medica Sur Clinic Foundation Hospital in Mexico City between Janua-ry 2005 and December 2010 and in the Department of Gastroenterology at the Pontificia Universidad Católica de Chile between January 2007 and Novem-ber 2011. The biopsies included were those from pa-tients with the following:
• Histopathological diagnosis of NAFLD according to Brunt’s criteria.
• Complete data from liver function tests and a blood count within 3 months of the date of the li-ver biopsy.
• Anthropometric measurements (weight, height, and BMI) recorded in the electronic file.
Information was also obtained about comorbidi-ties recorded during the medical history on the day of the liver biopsy.
We excluded patients who exhibited histological evidence or clinical data suggesting the presence of other associated liver diseases (primary biliary cir-rhosis, chronic infection with hepatitis B or C, au-toimmune hepatitis, sclerosing cholangitis, or overlapping syndrome) or evidence of alcohol intake of more than three drinks of any alcoholic beverage per week.
The clinical parameters obtained were age, sex, weight, height, BMI, and the presence of carbohydra-te intolerance or type 2 diabecarbohydra-tes mellitus. BMI was calculated as weight (kg)/height (m)2. The diagnosis
of type 2 diabetes mellitus was recorded for any pa-tient taking oral hypoglycemic agents or insulin, or if the patient knew that the diagnosis of type 2 diabe-tes mellitus was reported in the clinical record.
Noninvasive markers of fibrosis
The noninvasive methods used to assess fibrosis were the APRI, AAR, FIB-4, BARD, and NAFLD fi-brosis scores. These were calculated using the follo-wing equations:
• APRI = {AST (IU/1)/[upper normal value of 41 (IU/l)]}/platelet count (x109/l) x 100.22
• AAR = AST (IU/l)/ALT (IU/l).
• NAFLD fibrosis score = 1.675 + 0.037 x age (years) + 0.094 x BMI (kg/m2) + 1.13 x
abnor-mal fasting glucose level or diabetes (yes = 1, no = 0) + 0.99 x AAR - 0.013 x number of platelets (x109/l) - 0.66 x albumin concentration (g/dL).24
• BARD score = sum obtained from the three va-riables:25
° BMI > 28 = 1 point. ° AAR > 0.8 = 2 points. ° Diabetes = 1 point.
The cutoff values used for the diagnosis of severe fibrosis were: APRI ≥ 1, AAR ≥ 0.8, NAFLD score ≥
0.676, BARD score ≥ 2, and FIB-4 score ≥ 3.25.26
Liver biopsy
Liver biopsy samples were stained with hema-toxylin and eosin, and Masson’s trichrome stain. Biopsies were reviewed by two expert pathologists in each centre, who reached a consensus on the results. The diagnosis of NAFLD was made according to the Brunt criteria, which are described as steatosis, ballooning of hepatocytes, presence of Mallory bo-dies, inflammation, and fibrosis. NAFLD fibrosis was graded as grade (G) 1, fibrosis in zone 3 and pe-risinusoidal and/or pericellular fibrosis; grade 2, fi-brosis in zone 3 and periportal fifi-brosis; grade 3, bridging fibrosis; and grade 4, nodule formation and cirrhosis.
The study was approved by the Human Subjects Committee at the Medica Sur Clinic & Foundation, and the Ethics Committee of the Pontificia Universi-dad Católica de Chile, which were conformed to the ethical guidelines of the 1983 Declaration of Helsinki.
Statistical analysis
Continuous variables are described as means and standard deviations; differences between means were analyzed using Student’s t test or the Mann–Whitney U test. Categorical variables are described as num-bers and percentages; differences between proportions were analyzed using the χ2 test or Fisher’s exact test.
The diagnostic accuracy data were obtained by analyzing 2 x 2 tables for sensitivity, specificity, posi-tive predicposi-tive value (PPV), and negaposi-tive predicposi-tive value (NPV). The 95% confidence interval (CI) was calculated for each system of noninvasive assessment of fibrosis (APRI, AAR, and FIB-4, BARD, and NAFLD fibrosis scores) using the same method for
determining the diagnostic accuracy. Also the con-ventional likelihood ratios (LR) were calculated. The coefficient of reliability with Cronbach’s alpha was calculated to obtain the internal consistency between the different scores. The area under the curve for ad-vanced fibrosis was determined using receiver-opera-ting characteristic curves (AUROC) for each test. All analyses were performed using SPSS/PC v 16.0 (Chi-cago, IL). Differences were considered significant with P values < 0.05.
RESULTS
We reviewed a total of 243 patients with liver biopsy data and histological diagnosis of NAFLD, and their medical records. We excluded 15 patients who lacked clinical, laboratory, or other secondary diagnostic results. A total of 228 biopsies and pa-tients were analyzed in the study. The papa-tients in-cluded 117 women (51%) and 111 men (49%); the median age was 48.6 ± 12.7 years. Sixty-three (27.6%) patients had a normal BMI, one hundred eleven (48.6%) were overweight, 65 (28.5%) had obe-sity grade I, nine (3.9%) had obeobe-sity grade II, two (0.8%) had grade III obesity, and two (0.8%) had morbid obesity. Forty-nine (21.5%) patients had a diagnosis of carbohydrate intolerance or type 2 dia-betes mellitus.
Findings related to liver fibrosis degree were as it follows: 56.6 % (129 biopsies) did not display fibrosis (G0), 25% (57) had G1, 6.6% (15) had G2, 7% (16) had G3, and 4.8% (11) had cirrhosis (G4). The bio-chemical data are shown in table 1.
Table 1. General characteristics of the total population.
Variable n (%)
Female 117 (51)
Age (years)* 48.6 ± 12.7
Normal weight 63 (27.6)
Overweight 111 (48.6)
Obesity 54 (23.6)
Glucose intolerance or diabetes mellitus 49 (21.5) NAFLD fibrosis grade
G0 129 (56.6)
G1 57 (25)
G2 15 (6.6)
G3 16 (7)
G4 11 (4.8)
Platelets (103/µL)* 238 ± 95.2
Albumin (g/dL)* 3.5 ± 0.65
Alanine aminotransferase (ALT) (U/l)* 73 ± 82.7 Aspartate transaminase (AST) (U/l)* 57.6 ± 58
Glucose (mg/dL)* 107.4 ± 25.8
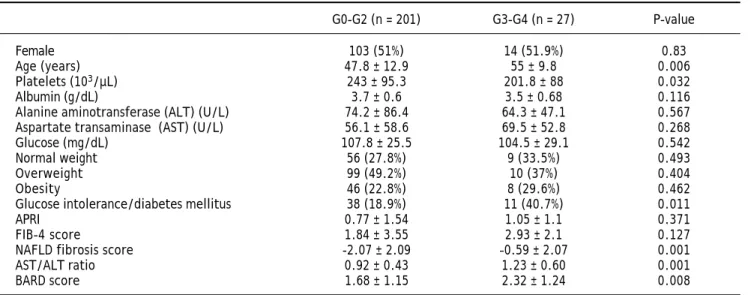
To compare the noninvasive markers of fibrosis with the results of the liver biopsies, we divided the patients into two groups: mild fibrosis (0-2, n = 201, 88.1%) and severe fibrosis (3-4, n = 27, 11.8%). The only variables that differed significantly (p < 0.05) between these two groups were platelet count, age, and the presence of carbohydrate intolerance or type 2 diabetes mellitus (Table 2). The platelet count was higher in the group with mild fibrosis than in the group with severe fibrosis (243 ± 95.3 x 10³/µL vs.
201.8 ± 88 x 103/µL, p = 0.032). Patients with the
higher degree of fibrosis were older. Glucose intole-rance or type 2 diabetes was more prevalent in pa-tients with severe fibrosis (n = 11, 40.7%) than in those with mild fibrosis (n = 38, 18.9%). The ALT and AST levels and AAR, albumin and glucose con-centrations, sex, and BMI did not differ significantly between groups.
The sensitivity, specificity, PPV, NPV and LH of all noninvasive scores and their diagnostic accuracy and AUROC were analyzed (Table 3). The AAR had a diagnostic accuracy of 0.62 and the AUROC was 0.67 (95%CI, 0.57-0.77). The accuracy in the APRI was 0.80 and the AUROC was 0.66 (95%CI, 0.55-0.77). For the BARD score the accuracy was 0.47 with the AUROC 0.65 (95% CI, 0.52-0.77); the FIB 4 get an accuracy was 0.85 (AUROC 0.74; 95%CI, 0.65-0.84). The NAFLD fibrosis score had diagnostic accuracy of 0.84 and the AUROC was 0.72 (95%CI, 0.60-0.83) (Figure 1).
All systems included patients in both the mild fi-brosis and severe fifi-brosis groups (Figure 2). Howe-ver, the degree of fibrosis could not be determined
for all patients in two of the five systems-FIB-4 and NAFLD fibrosis scores. For the biopsies of speci-mens that showed indeterminate results in the FIB-4 score, 46% of the samples corresponded to G0, 27.3% to G1, 10.9% to G2, 9.5% to G3 and 5.4% to G4. For the biopsies of specimens that showed indeterminate results in the NAFLD fibrosis score, 40% correspon-ded to G0, 27% to G1, 9.6% to G2, 16% to G3, and 6.4% to G4 (Figure 3). In biopsies with indetermi-nate results, about 45% of the samples were graded as no fibrosis in the two systems.
Table 2. Characteristics of patients classified according to fibrosis stage.
G0-G2 (n = 201) G3-G4 (n = 27) P-value
Female 103 (51%) 14 (51.9%) 0.83
Age (years) 47.8 ± 12.9 55 ± 9.8 0.006
Platelets (103/µL) 243 ± 95.3 201.8 ± 88 0.032
Albumin (g/dL) 3.7 ± 0.6 3.5 ± 0.68 0.116
Alanine aminotransferase (ALT) (U/L) 74.2 ± 86.4 64.3 ± 47.1 0.567
Aspartate transaminase (AST) (U/L) 56.1 ± 58.6 69.5 ± 52.8 0.268
Glucose (mg/dL) 107.8 ± 25.5 104.5 ± 29.1 0.542
Normal weight 56 (27.8%) 9 (33.5%) 0.493
Overweight 99 (49.2%) 10 (37%) 0.404
Obesity 46 (22.8%) 8 (29.6%) 0.462
Glucose intolerance/diabetes mellitus 38 (18.9%) 11 (40.7%) 0.011
APRI 0.77 ± 1.54 1.05 ± 1.1 0.371
FIB-4 score 1.84 ± 3.55 2.93 ± 2.1 0.127
NAFLD fibrosis score -2.07 ± 2.09 –0.59 ± 2.07 0.001
AST/ALT ratio 0.92 ± 0.43 1.23 ± 0.60 0.001
BARD score 1.68 ± 1.15 2.32 ± 1.24 0.008
Figure 1. Area under the curve for advanced fibrosis using receiver-operating characteristic curves. Diagonal segments are produced by ties.
1.0
0.8
0.6
0.4
0.2
0.0
Sensitivity
0.0 0.2 0.4 0.6 0.8 1.0
1-Specificity
Source of the curve APRI FIB4 NAFLD_score BARD AST_ALT_ratio Reference line
a a a a aaaaaaaa aaaaaaaaaaaaaaaaa aaaaaaaa aaaaaa a aaaaaaaaa aaaaaaaaa aaaaaaaaa aaaaaaaaa aaaaaaaaa aaaaaaaaa aaaaaaaaa aaaaaaaaa aaaaaaaaa aaaaaaaaa aaaaaaaaa aaaaaaaaa aaaaaaaaa aaaaaaaaa aaaaaaaaa aaaaaaaaa aaaaaaaaa aaaaaaaaa aaaaaaaaa aaaaaaaaa aaaaaaaaa aaaaaaaaa aaaaaaaaa aaaaaaaaa aaaaaaaaa aaaaaaaaa aaaaaaaaa aaaaaaaaa aaaaaaaaa aaaaaaaaa aaaaaaaaa aaaaaaaaaaaaaaaaa aaaa aaa aaaaaaaaa aaaaaaaaa aaaaaaaaa aaaaaaaaa aaaaaaaaa aaaaaaaaa aaaaaaaaa aaaaaaaaa aaaaaaaaa aaaaaaaaa aaaaaaaaa aaaaaaaaa aaaaaaaaa aaaaaaaaa aaaaaaaaa aaaaaaaaa aaaaaaaaa aaaaaaaaa aaaaaaaaa aaaaaaaaa aaaaaaaaaaaaaaaaa a aaaaa aaaaaaaa aaaaaaaa aaaaaaaa aaaaaaaa aaaaaaaa aaaaaaaa aaaaaaaa aaaaaaaa aaaaaaaa aaaaaaaa aaaaaaaa aaaaaaaa aaaaaaaa aaaaaaaa aaaaaaaa aaaaaaaa aaaaaaaa aaaaaaaa aaaaaaaa aaaaaaaa aaaaaaaa aaaaaaaa aaaaaaaa aaaaaaaa aaaaaaaa aaaaaaaa aaaaaaaa aaaaaaaa aaaaaaaa aaaaaaaa aaaaaaaa aaaa aaa aaaaaaaaa aaaaaaaaa aaaaaaaaa aaaaaaaaa aaaaaaaaa aaaaaaaaa aaaaaaaaa aaaaaaaaa aaaaaaaaa aaaaaaaaa aaaaaaaaa aaaaaaaaa aaaaaaaaa aaaaaaaaa aaaaaaaaa aaaaaaaaa aaaaaaaaa
aa a aaa aaaaaaaaa aaaaaaaaa aaaaaaaaa aaaaaaaaa aaaaaaaaa aaaaaaaaa aaaaaaaaa aaaaaaaaa aaaaaaaaa aaaaaaaaa aaaaaaaaa aaaaaaaaa aaaaaaaaa aaaaaaaaa aaaaaaaaa aaaaaaaaa aaaaaaaaa aaaaaaaaa aaaaaaaaa aaaaaaaaa aaaaaaaaa aaaa aaa aaaaaaaaa aaaaaaaaa aaaaaaaaa aaaaaaaaa aaaaaaaaa aaaaaaaaa aaaaaaaaa aaaaaaaaa aaaaaaaaa aaaaaaaaa aaaaaaaaa aaaaaaaaa aaaaaaaaa aaaaaaaaa aaaaaaaaa aaaaaaaaa aaaaaaaaa aaaaaaaaa aaaaaaaaa aaaaaaaaa aaaaaaaaa aaaaaaaaaaaaaaaaa Table 3.
Comparison between noninvasive markers.
Noninvasive score Sensitivity Specificity PP V N PV Accuracy AUROC PL R N LR AST/ALT ratio 0.66 (0.56-0.68) 0.62 (0.55-0.68) 0.19 (0.12-0.28) 0.93 (0.87-0.96) 0.62 0.67 1.76 (1.27-2 .42) 0.53 (0.31-0.91) APRI 0.37 (0.20-0.57) 0.86 (0.80-0.90) 0.26 (0.13-0.43) 0.91 (0.85-0.94) 0. 80 0. 66 2.94 (1.46-5.9) 0.80 (0.66-0.97) BARD 0.76 (0.54-0.89) 0.43 (0.36-0.51) 0.15 (0.9-0.23) 0.93 (0.84-0.97) 0. 47 0. 65 1.35 (1.05-1.75) 0.54 (0.26-1.11) FIB-4 0.56 (0.30-0.79) 0.89 (0.82-0.93) 0.37 (0.19-0.59) 0.94 (0.88-0.97) 0. 85 0. 74 5.21 (2.73-9.92) 0.49 (0.28-0.85) NAFLD 0.53 (0.26-0.79) 0.87 (0.81-0.92) 0.26 (0.12-0.48) 0.95 (0.90-0.98) 0. 84 0. 72 4.33 (2.25-8.35) 0.52 (0.29-0.94)
Sensitivity, specificity, positive predictive value (PPV), negative predictive value (NPV), positive likelihood ratio (PLR), ne
gative likelihood ratio (NLR) and AUROC are expressed as fractions of 1 with 95%
confidence intervals.
Figure 2. Fibrosis stage according to the noninvasive sco-res compared with liver biopsy.
250 200 150 100 50 0 Patients (n)
Biopsy AST/ALT APRI BARD FIB-4 NAFLD
score
Undeterminated G3-G4 G0-G2
Figure 3. Fibrosis stage in patients with undetermined fibrosis according to the FIB-4 (A) and NAFLD fibrosis (B) scores.
A B a a aaaaaaa a aaaaaaaaaaa aaaaaaaaaaaaa aaaaaaaaaaaaaaaa aaaaaaaaaaaaaaaaaa aaaaaaaaaaaaaaaaaaaaa aaaaaaaaaaaaaaaaaaaaaa aaaaaaaaaaaaaaaaaaaaaaa aaaaaaaaaaaaaaaaaaaaaaaaa aaaaaaaaaaaaaaaaaaaaaaaaaa aaaaaaaaaaaaaaaaaaaaaaaaaaaa aaaaaaaaaaaaaaaaaaaaaaaaaaaa aaaaaaaaaaaaaaaaaaaaaaaaaaaaa aaaaaaaaaaaaaaaaaaaaaaaaaaaaaa aaaaaaaaaaaaaaaaaaaaaaaaaaaaaa aaaaaaaaaaaaaaaaaaaaaaaaaaaaaaa aaaaaaaaaaaaaaaaaaaaaaaaaaaaaaaa aaaaaaaaaaaaaaaaaaaaaaaaaaaaaaaa aaaaaaaaaaaaaaaaaaaaaaaaaaaaaaaa aaaaaaaaaaaaaaaaaaaaaaaaaaaaaaa aaaaaaaaaaaaaaaaaaaaaaaaaaaaaaa aaaaaaaaaaaaaaaaaaaaaaaaaaaaaa aaaaaaaaaaaaaaaaaaaaaaaaaaaaaa aaaaaaaaaaaaaaaaaaaaaaaaaaaaaa aaaaaaaaaaaaaaaaaaaaaaaaaaaa aaaaaaaaaaaaaaaaaaaaaaaaaaaa aaaaaaaaaaaaaaaaaaaaaaaaaa aaaaaaaaaaaaaaaaaaaaaaaaaa aaaaaaaaaaaaaaaaaaaaaaaa aaaaaaaaaaaaaaaaaaaaaa aaaaaaaaaaaaaaaaaaaa aaaaaaaaaaaaaaaaaa aaaaaaaaaaaaaaaaa aaaaaaaaaaa a
n = 73
a a aaaaaaa a aaaaaaaaaaa aaaaaaaaaaaaaa aaaaaaaaaaaaaaaa aaaaaaaaaaaaaaaaaa aaaaaaaaaaaaaaaaaaaaa aaaaaaaaaaaaaaaaaaaaaa aaaaaaaaaaaaaaaaaaaaaaaa aaaaaaaaaaaaaaaaaaaaaaaaa aaaaaaaaaaaaaaaaaaaaaaaaaaa aaaaaaaaaaaaaaaaaaaaaaaaaaaa aaaaaaaaaaaaaaaaaaaaaaaaaaaa aaaaaaaaaaaaaaaaaaaaaaaaaaaaaa aaaaaaaaaaaaaaaaaaaaaaaaaaaaaa aaaaaaaaaaaaaaaaaaaaaaaaaaaaaaa aaaaaaaaaaaaaaaaaaaaaaaaaaaaaaaa aaaaaaaaaaaaaaaaaaaaaaaaaaaaaaaa aaaaaaaaaaaaaaaaaaaaaaaaaaaaaaaa aaaaaaaaaaaaaaaaaaaaaaaaaaaaaaaa aaaaaaaaaaaaaaaaaaaaaaaaaaaaaaa aaaaaaaaaaaaaaaaaaaaaaaaaaaaaaa aaaaaaaaaaaaaaaaaaaaaaaaaaaaaaa aaaaaaaaaaaaaaaaaaaaaaaaaaaaaa aaaaaaaaaaaaaaaaaaaaaaaaaaaaaa aaaaaaaaaaaaaaaaaaaaaaaaaaaaa aaaaaaaaaaaaaaaaaaaaaaaaaaaa aaaaaaaaaaaaaaaaaaaaaaaaaaaa aaaaaaaaaaaaaaaaaaaaaaaaaaa aaaaaaaaaaaaaaaaaaaaaaaaa aaaaaaaaaaaaaaaaaaaaaaa aaaaaaaaaaaaaaaaaaaaa aaaaaaaaaaaaaaaaaaa aaaaaaaaaaaaaaaaa aaaaaaaaaaa a
The reproducibility coefficient (Cronebach alpha) between NAFLD score and APRI score was 0.48, with the AST / ALT score was 0.58, with BARD sco-re 0.58 and the FIB-4 0.94.
DISCUSSION
Noninvasive methods for detecting fibrosis are used to reduce the need for liver biopsies to identify patients with NAFLD in populations at risk. The purpose of identifying patients by mild fibrosis in NAFLD, is to prevent progression to later stages of fibrosis (cirrhosis) and the development of their complications (hepatocellular carcinoma). Many treatments had been studied to reverse fibrosis from one stage to another, primarily in early stages of the disease, and here is where differentiation bet-ween mild and severe fibrosis becomes relevant. Mo-retto, et al, showed reversal of portal and lobar fibrosis in 16 of 35 morbid obese patients after gas-tric bypass surgery.27 However, it is important to
note, also showed deterioration in the degree of fi-brosis in some patients in this and other studies.28
Although there are known variables, such as obesity and diabetes mellitus, that can be used to identify patients at risk of having significant fibrosis, the clinician cannot rely solely on these factors. In this study we found significant differences bet-ween patients with mild and severe fibrosis in the prevalence of diabetes mellitus, a finding that has also been reported in other populations.29 By
contrast, we found that high BMI was not related to the degree of fibrosis in our cohort, which is already known for the development of fibrosis.30,31 Even
though only 23% of our patients had a BMI ≥ 30 kg/m2,
only 1.7% of the sample had a BMI > 40 kg/m2.
Importantly, 30% of severe fibrosis patients had a BMI < 25 kg/m2. However, because of the
retrospec-tive nature of this study, we do not know whet-her the patients had a higwhet-her BMI at some point before the study.
Of the laboratory parameters, the only surrogate marker of advanced fibrosis, that differed between the two groups in our cohort was the platelet count. Blood platelets, by connecting hemostasis and inflammatory processes, participate in the pathoge-nesis of chronic liver disease. Kondo et al demons-trated pathological findings for the accumulation of platelets in the liver in cases with chronic hepatitis C.32 So, platelets count in chronic liver diseases is
modified by many factors, making it surveillance a simple marker to demonstrated progression of the liver disease.
Our data show the importance of screening for fi-brosis in patients with fatty liver identified by ima-ging but with normal laboratory parameters.
The diagnosis of fibrosis in patients with NAFLD is the major predictor of disease progression in the-se patients. The development of new diagnostic no-ninvasive fibrosis, are designed to detect these patients early to track suitable to control and pro-long the complications that develop in the future. As has been previously determined, the elevation of li-ver enzymes may or may not be present in patients who have fibrosis, for that reason, other factors have taken importance as predictors of fibrosis in patients with NAFLD (glucose intolerance or diabe-tes mellitus33), and may have better accuracy in the
diagnosis of fibrosis, that together with the enzyme elevations, we can get a better prediction of fibrosis grade. In our cohort we found none difference bet-ween two populations (mild fibrosis vs. severe fibro-sis) but if there was higher prevalence glucose intolerance or diabetes mellitus in patients with se-vere fibrosis.
This takes us back to the question of whether cli-nicians should use noninvasive markers or perform a liver biopsy. Although liver biopsy is the gold standard and complications occurs in only a low percentage of patients, subjecting the patient to this risk is questionable. This is where the role of nonin-vasive methods becomes important.
The usefulness of the evaluation systems has been evaluated in different NAFLD populations around the world. The AAR was validated for NAFLD and had a reported sensitivity of 52%, spe-cificity of 90%, PPV of 55%, and NPV of 89%.26
When applied to our population, the figures were similar, although the NPV was higher (93%). How-ever, our analysis showed a diagnostic accuracy of 0.62, which raises questions about its effectiveness in diagnosing fatty liver disease in Latino population.
The APRI was originally developed for assessing fibrosis in patients infected with hepatitis C virus, but this method has been validated recently for NAFLD.34,35 One study that assessed the usefulness
of this system26 in 145 patients found a sensitivity of
27%, specificity of 89%, PPV of 37%, and NPV of 95%. Another assessment of the NAFLD in a French cohort showed a sensitivity of 66%, specificity of 90%, PPV of 72%, and NPV of 87%; these are the highest sensitivity and PPV values reported.36
Our results are similar to the values for sensitivity and NPV reported by McPherson.26 Extrapolating
exclude the presence of severe fibrosis. The APRI has an advantage in that it uses two variables avail-able in routine practice and a simple formula for the calculation, although it is unable to obtain values for indeterminate fibrosis.
The NAFLD fibrosis score was created to evalua-te fibrosis in fatty liver. In 138 patients included in a previous study, this system showed sensitivity, specificity, PPV, and NPV of 22.7%, 100%, 81.3%, and 100%, respectively.24 Other studies26,29 have
re-ported sensitivity, specificity, PPV, and NPV in the ranges of 22-78%, 58-100%, 30-81%, and 92-100%, respectively. We found a sensitivity of 53%, specifici-ty of 87%, low PPV of 26%, and NPV of 95%. The values obtained in our study are comparable with those obtained in different geographic locations and with data from a more recent study of the English population, which obtained a diagnostic accuracy of 0.84. This provides even greater statistical power supporting the use of this marker for detecting ad-vanced fibrosis in our population. However, one drawback of this marker is the need for a calculator to produce the value because the formula is com-plex. However, this method is applicable to Latino populations because of its high diagnostic accura-cy for severe fibrosis.
The BARD score includes variables such as the presence of diabetes, which as shown in this study, is a predictor of fibrosis. This score identifies pa-tients at increased risk of advanced fibrosis. Some studies have shown a low sensitivity and PPV26,37
and Ruffillo, et al.29 reported an NPV < 90%. By
contrast, the original validation study was reprodu-ced by McPherson, et al.,26 who reported a PPV and
NPV for advanced fibrosis of 44% and 95%, respecti-vely. In our sample, the BARD score had a sensitivi-ty, specificisensitivi-ty, and PPV < 80%; although the NPV was 93%, the accuracy was low (0.47). These data show that the BARD score has poor diagnostic value for advanced fibrosis.
The FIB-4 system has shown interesting results in studies published from around the world. The sensitivity was reported as 85%, specificity 65%, PPV 75–80%, and NPV 95%.26,38 We found different
results in our study: a lower sensitivity and PPV, but an NPV of 94% and accuracy of 0.85.
In our study, of the samples that produced inde-terminate values in the FIB-4 and NAFLD scores, 3.5% were graded as G4. In the patients whose sta-tus remains undetermined, there is no consensus about the need for liver biopsy, although this group would be the most likely candidate for biopsy for adequate staging of fibrosis as part of appropriate
surveillance and monitoring. According to our data, the likelihood will be classified as undetermined and then subjected to biopsy but will not have fibrosis is about 50%; the other 50% of such patients will have some stage of fibrosis. Also, we obtained a coefficient of reliability between these two scores of 0.94, which indicates a reproducibility of the results with the two different diagnostic methods.
One limitation of the study is the number of study population, however there is not a constraint to evaluate the diagnostic accuracy as well as the va-lidation study of the NAFLD score by Angulo, et al.,
where the number of patients was 253 and the prevalence of advanced fibrosis was 14%.24 Another
important limitation is the lack of some data, as the hip circumference and waist/hip ratio, which are important for Latino population.39
CONCLUSION
The APRI, FIB-4 and NAFLD fibrosis scores have a higher accuracy and may be used for the noninva-sive diagnosis of advanced fibrosis in NAFLD in the Mexican and Chilean population, mainly to rule out severe fibrosis. These tools are very useful in coun-tries with high prevalence of overweight and obesi-ty, as Mexico or Chile having a higher risk of developing fatty liver and fibrosis.
However, 25% of patients evaluated by these me-thods have an indeterminate degree of fibrosis and may need to be evaluated by a second noninvasive system or even by an invasive procedure such as a liver biopsy. Future research to assess the clinical implications of non-invasive markers is needed.
ACKNOWLEDGEMENT
This work was partially supported by Medica Sur & Clinic and Foundation and by grants from the Chilean National Fund for Research in Science and Technology (FONDECYT #1110455 to MA and # 11100113 to CB) and the National Council for Scientific and Technological Research (CONICYT – Chile, Project ACT79 to MA).
REFERENCES
1. Preiss D, Sattar N. Non-alcoholic fatty liver disease: an overview of prevalence, diagnosis, pathogenesis and treatment considerations. Clinical science 2008; 115: 141-50.
3. Piccinino F, Sagnelli E, Pasquale G, Giusti G. Complications following percutaneous liver biopsy. A multicentre retrospective study on 68,276 biopsies. J Hepatol 1986; 2: 165-73.
4. Bedossa P, Dargere D, Paradis V. Sampling variability of liver fibrosis in chronic hepatitis C. Hepatology 2003; 38: 1449-57.
5. Ratziu V, Charlotte F, Heurtier A, Gombert S, Giral P, Bruckert E, Grimaldi A, et al. Sampling variability of liver biopsy in nonalcoholic fatty liver disease. Gastroenterolo-gy 2005; 128: 1898-906.
6. Janiec DJ, Jacobson ER, Freeth A, Spaulding L, Blaszyk H. Histologic variation of grade and stage of non-alcoholic fatty liver disease in liver biopsies. Obesity surgery 2005; 15: 497-501.
7. Chavez-Tapia NC, Tiribelli C. Are non-invasive tests accu-rate enough to predict hepatic fibrosis in non-alcoholic fatty liver disease (NAFLD)? Gut 2008; 57: 1351-3. 8. Friedrich-Rust M, Ong MF, Martens S, Sarrazin C, Bojunga
J, Zeuzem S, Herrmann E. Performance of transient elas-tography for the staging of liver fibrosis: a meta-analysis.
Gastroenterology 2008; 134: 960-74.
9. Tsochatzis EA, Gurusamy KS, Ntaoula S, Cholongitas E, Da-vidson BR, Burroughs AK. Elastography for the diagnosis of severity of fibrosis in chronic liver disease: a meta-analy-sis of diagnostic accuracy. J Hepatol 2011; 54: 650-9. 10. Abenavoli L, Beaugrand M. Transient elastography in
non-alcoholic fatty liver disease. Ann Hepatol 2012; 11: 172-8. 11. Rodriguez-Hernandez H, Gonzalez JL, Marquez-Ramirez MD, Flores-Hernandez M, Rodriguez-Moran M, Guerrero-Romero F. Risk factors associated with nonalcoholic fatty liver disease and its relationship with the hepatic histological changes. Eur J Gastroenterol Hepatol 2008; 20: 399-403.
12. Chavez-Tapia NC, Mendez-Sanchez N, Uribe M. Role of no-nalcoholic fatty liver disease in hepatocellular carcinoma. Ann Hepatol 2009; 8(Suppl. 1): S34-S39.
13. Lizardi-Cervera J, Laparra DI, Chavez-Tapia NC, Ostos ME, Esquivel MU. Prevalence of NAFLD and metabolic syn-drome in asymtomatics subjects. Rev Gastroenterol Mex 2006; 71: 453-9.
14. Roesch-Dietlen F, Dorantes-Cuellar A, Carrillo-Toledo MG, Martinez-Sibaja C, Rojas-Carrera S, Bonilla-Rojas QC, Uchino-Higueras V, et al. Frequency of NAFLD in a group of patients with metabolic syndrome in Veracruz, Mexico. Rev Gastroenterol Mex 2006; 71: 446-52.
15. Ramos-De la Medina A, Remes-Troche JM, Roesch-Dietlen FB, Perez-Morales AG, Martinez S, Cid-Juarez S. Routine li-ver biopsy to screen for nonalcoholic fatty lili-ver disease (NAFLD) during cholecystectomy for gallstone disease: is it justified? J Gastrointest Surg 2008; 12: 2097-2102; dis-cussion 2102.
16. Carrion AF, Ghanta R, Carrasquillo O, Martin P. Chronic li-ver disease in the Hispanic population of the United Sta-tes. Clin Gastroenterol Hepatol 2011; 9: 834-41; quiz e109-e810.
17. Bambha K, Belt P, Abraham M, Wilson LA, Pabst M, Ferrell L, Unalp-Arida A, et al. Ethnicity and nonalcoholic fatty li-ver disease. Hepatology 2012; 55: 769-80.
18. Williams CD, Stengel J, Asike MI, Torres DM, Shaw J, Contre-ras M, Landt CL, et al. Prevalence of nonalcoholic fatty liver disease and nonalcoholic steatohepatitis among a largely middle-aged population utilizing ultrasound and liver biopsy: a prospective study. Gastroenterology 2011; 140: 124-31. 19. Mendez-Sanchez N, Villa AR, Chavez-Tapia NC,
Ponciano-Rodriguez G, Almeda-Valdes P, Gonzalez D, Uribe M. Trends
in liver disease prevalence in Mexico from 2005 to 2050 through mortality data. Ann Hepatol 2005; 4: 52-5. 20. Medina E, Kaempffer AM. Adult mortality in Chile. Rev Med
Chil 2000; 128: 1144-9.
21. Riquelme A, Arrese M, Soza A, Morales A, Baudrand R, Pe-rez-Ayuso RM, Gonzalez R, et al. Non-alcoholic fatty liver disease and its association with obesity, insulin resistan-ce and increased serum levels of C-reactive protein in His-panics. Liver Int 2009; 29: 82-8.
22. Wai CT, Greenson JK, Fontana RJ, Kalbfleisch JD, Marrero JA, Conjeevaram HS, Lok AS. A simple noninvasive index can predict both significant fibrosis and cirrhosis in patients with chronic hepatitis C. Hepatology 2003; 38: 518-26. 23. Vallet-Pichard A, Mallet V, Pol S. FIB-4: a simple,
inexpensi-ve and accurate marker of fibrosis in HCV-infected pa-tients. Hepatology 2006; 44: 769; author reply 769-70. 24. Angulo P, Hui JM, Marchesini G, Bugianesi E, George J,
Fa-rrell GC, Enders F, et al. The NAFLD fibrosis score: a no-ninvasive system that identifies liver fibrosis in patients with NAFLD. Hepatology 2007; 45: 846-54.
25. Harrison SA, Oliver D, Arnold HL, Gogia S, Neuschwander-Tetri BA. Development and validation of a simple NAFLD cli-nical scoring system for identifying patients without advanced disease. Gut 2008; 57: 1441-7.
26. McPherson S, Stewart SF, Henderson E, Burt AD, Day CP. Simple non-invasive fibrosis scoring systems can reliably exclude advanced fibrosis in patients with non-alcoholic fatty liver disease. Gut 2010; 59: 1265-9.
27. Moretto M, Kupski C, da Silva VD, Padoin AV, Mottin CC. Effect of bariatric surgery on liver fibrosis. Obes Surg 2012; 22: 1044-9.
28. Chavez-Tapia NC, Tellez-Avila FI, Barrientos-Gutierrez T, Mendez-Sanchez N, Lizardi-Cervera J, Uribe M. Bariatric surgery for non-alcoholic steatohepatitis in obese pa-tients. Cochrane Database Syst Rev 2010: CD007340. 29. Ruffillo G, Fassio E, Alvarez E, Landeira G, Longo C,
Domin-guez N, Gualano G. Comparison of NAFLD fibrosis score and BARD score in predicting fibrosis in nonalcoholic fatty liver disease. J Hepatol 2011; 54: 160-3.
30. Park JW, Jeong G, Kim SJ, Kim MK, Park SM. Predictors re-flecting the pathological severity of non-alcoholic fatty li-ver disease: comprehensive study of clinical and immunohistochemical findings in younger Asian patients. J Gastroenterol Hepatol 2007; 22: 491-7.
31. Fierbinteanu-Braticevici C, Baicus C, Tribus L, Papacocea R. Predictive factors for nonalcoholic steatohepatitis (NASH) in patients with nonalcoholic fatty liver disease (NAFLD). J Gastrointestin Liver Dis 2011; 20: 153-9. 32. Kondo R, Yano H, Nakashima O, Tanikawa K, Nomura Y,
Kage M. Accumulation of platelets in the liver may be an important contributory factor to thrombocytopenia and liver fibrosis in chronic hepatitis C. J Gastroenterol 2012. 33. Fracanzani AL, Valenti L, Russello M, Miele L, Bertelli C, Bellia A, Masetti C, et al. Gallstone disease is associated with more severe liver damage in patients with non-alco-holic Fatty liver disease. PLoS One 2012; 7: e41183. 34. Loaeza-del-Castillo A, Paz-Pineda F, Oviedo-Cardenas E,
Sanchez-Avila F, Vargas-Vorackova F. AST to platelet ra-tio index (APRI) for the noninvasive evaluara-tion of liver fi-brosis. Ann Hepatol 2008; 7: 350-7.
35. Kruger FC, Daniels CR, Kidd M, Swart G, Brundyn K, van Rensburg C, Kotze M. APRI: a simple bedside marker for ad-vanced fibrosis that can avoid liver biopsy in patients with NAFLD/NASH. S Afr Med J 2011; 101: 477-80. 36. Cales P, Laine F, Boursier J, Deugnier Y, Moal V, Oberti
fibrosis specific or not to NAFLD. J Hepatol 2009; 50: 165-73.
37. Fujii H, Enomoto M, Fukushima W, Tamori A, Sakaguchi H, Kawada N. Applicability of BARD score to Japanese patients with NAFLD. Gut 2009; 58: 1566-7; author reply 1567. 38. Shah AG, Lydecker A, Murray K, Tetri BN, Contos MJ,
San-yal AJ. Comparison of noninvasive markers of fibrosis in
patients with nonalcoholic fatty liver disease. Clin Gas-troenterol Hepatol 2009; 7: 1104-12.