RP Myers et al. Noninvasive diagnosis of nonalcoholic fatty liver disease S25
www.medigraphic.com
Annals of Hepatology 2009; 8(1): Supplement: S25-S33Annals of
Hepatology
Noninvasive diagnosis of nonalcoholic fatty
liver disease
Robert P. Myers
Liver Unit, Division of Gastroenterology, Department of Medicine, University of Calgary, Calgary, Alberta, Canada.
Acknowledgements: Supported by a Clinical Investigator Award from the Alberta Heritage Foundation for Medical Research and New Investigator Award from the Canadian Institutes for Health Research.
Address for correspondence: Dr. Robert P. Myers
Liver Unit, University of Calgary 6D22, 3280 Hospital Drive N.W. Calgary, AB, Canada T2N 4N1
Tel: (403) 592-5049 Fax: (403) 592-5090 E-mail: [email protected]
Manuscript received and accepted: 22 January 2009
Abstract
Nonalcoholic fatty liver disease (NAFLD) is the most common cause of chronic liver disease, affecting ap-proximately 30% of Western populations and a fre-quent indication for liver transplantation. The histo-logic spectrum of NAFLD includes simple steatosis, which has a benign prognosis, and nonalcoholic steato-hepatitis, a more aggressive form of liver injury that may progress to cirrhosis and its complications. At present, the only widely accepted means of differentiat-ing these lesions, includdifferentiat-ing the severity of hepatic fibro-sis, is liver biopsy. However, due to the invasiveness of this procedure, the rising prevalence of NAFLD, and the expected availability of effective therapies for this condition, the identification of noninvasive tools for the diagnosis and staging of NAFLD has emerged as a ma-jor clinical and research priority. This review summa-rizes important advances in this field during the past decade, including the development of biomarkers of he-patic fibrosis, apoptosis, and inflammation; novel im-aging techniques such as transient elastography; and high-throughput technologies including proteomics and genomics. Future studies must focus on the devel-opment of accurate, inexpensive, and reliable tools that can differentiate the major histologic determinants of NAFLD; are responsive to changes in NAFLD severity due to therapeutic intervention and time; and have prognostic significance. Until such tools are developed,
liver biopsy remains an important tool in the assess-ment of patients with NAFLD.
Key words: Non-alcoholic fatty liver disease, nonalco-holic steatohepatitis, liver fibrosis, steatosis, non-inva-sive procedure, transient elastography (FibroScan), se-rum markers, liver biopsy.
Introduction
The development of noninvasive markers of nonalco-holic fatty liver disease (NAFLD) has emerged as a major clinical and research priority.1,2 The quest for accurate
tools to stage NAFLD-related liver injury stems from a variety of recent developments. First, the prevalence of NAFLD has grown to epidemic proportions; it is current-ly the most common cause of abnormal liver biochemis-try and cryptogenic cirrhosis, and a frequent indication for liver transplantation.3 In Western countries, the
preva-lence of NAFLD approaches 30%; in the United States alone, an estimated 80 to 100 million individuals are af-fected. Second, it is now well recognized that NAFLD ex-ists as a spectrum consisting of two major phenotypes that have drastically different natural histories. While the majority of patients have simple steatosis, which has a benign clinical course, approximately 10-20% of indi-viduals have nonalcoholic steatohepatitis (NASH), a po-tentially serious condition.4,5 In one study, patients with
NASH had significantly reduced survival compared to the general population and a higher risk of liver-related (2.8% vs. 0.2%) and cardiovascular death (15.5% vs.
7.5%).6 End-stage liver disease occurred in 10% of
pa-tients during follow-up, including three cases of hepato-cellular carcinoma. In contrast, survival of patients with simple steatosis was similar to that of the control popula-tion and none of these patients developed liver failure. Third, although there are currently no approved thera-pies for NAFLD, new treatments including insulin-sensi-tizing agents are under investigation in large-scale clini-cal trials.7 Noninvasive markers that will facilitate
identi-fication of patients most in need of these treatments (i.e. those with NASH) and serve as responsive and readily re-peatable therapeutic endpoints are vital. Finally, current-ly available tools for assessing liver injury in patients with NAFLD are sub-optimal; none satisfy all of the
crite-Artemisa
www.medigraphic.com
ria for an ‘ideal’ tool (Table I). In my opinion, the major goals of any such tool are three-fold: 1) to diagnosis NAFLD; 2) to differentiate simple steatosis from NASH; and 3) to determine the severity of hepatic fibrosis. At present, only liver biopsy can achieve these goals. Never-theless, liver biopsy has limitations; perhaps most impor-tant is its unsuitability as a screening tool for a condition that affects roughly one-third of the population. Other limitations include its cost, variability in pathological interpretation, the difficulty of performing repeated biop-sies to track hepatic injury over time, and its small, but not inconsequential risk of complications including ma-jor hemorrhage (0.1%), and death (0.01%).8 Moreover,
due to its ability to sample only 1:50,000th of the liver,
biopsy carries an important risk of sampling error. Stud-ies predominantly in viral hepatitis have suggested that a single liver biopsy will miss cirrhosis in 10-30% of pa-tients and misclassify fibrosis by at least one stage in 20-30%.9,10 In an illustrative study of 51 patients with
NAFLD by Ratziu et al.,11 dual biopsies of the right and
left hepatic lobes revealed significant discordance in measurements of steatosis (≥ 20% of hepatocytes affect-ed), inflammation (≥ 1 grade), and fibrosis (≥ 1 stage) in 18%, 41%, and 43% of patients, respectively. This issue needs to be considered when evaluating the accuracy of noninvasive tools derived using liver biopsy as the refer-ence standard.
Routine studies for the diagnosis of NAFLD
Information available to the practicing clinician when faced with a patient who may have NAFLD includes the history and physical examination, routine laboratory in-vestigations, and typically, an ultrasound (US). Since most patients with NAFLD are asymptomatic and com-plaints, when present, are nonspecific (e.g. fatigue, right upper quadrant discomfort), the presence or absence of symptoms is an unreliable means of assessing NAFLD se-verity. Likewise, although various historical features have been associated with advanced NAFLD (e.g. older
age, diabetes, obesity),12 their utility in staging disease
when used in isolation is limited. Laboratory tests, in-cluding the alanine (ALT) and aspartate aminotransferase (AST), gamma-glutamyl-transpeptidase (GGT), albumin, bilirubin, international normalized ratio (INR), and plate-lets suffer the same limitation. For example, the most commonly used screening modality, the ALT, typically fluctuates in NAFLD and is normal in more than two-thirds of NASH patients at any given time.2 In one study,
the sensitivity of serum ALT for NASH in a large bariat-ric surgery cohort was only 40%.13 For the identification
of at least 5% steatosis, Poynard and colleagues reported that an ALT > 50 IU/L had a sensitivity and specificity of only 72% and 62%, respectively (area under the receiver operating characteristic curve [AUROC] 0.61).14
Al-though some have recommended a decrease in the refer-ence ranges for ALT as a means of improving its sensitiv-ity, the resultant high false positive rates are clearly un-acceptable. Combining these measures is a potential, but imperfect means of overcoming these limitations. For ex-ample, an AST/ALT ratio above 1 may indicate advanced fibrosis; however, its sensitivity is poor (~50%).12
Simi-larly, the AST/platelet ratio index (APRI), a well-validat-ed and readily available tool for staging hepatitis C (HCV)-related fibrosis - particularly for excluding ad-vanced fibrosis15,16 - requires additional study in patients
with NAFLD.17,18 Finally, measures of liver function such
as albumin, bilirubin, and INR may be abnormal in pa-tients with advanced NAFLD-related cirrhosis, but can-not reliably differentiate earlier stages of disease.
The most commonly used imaging modality for the di-agnosis of NAFLD is US, in which steatosis manifests as a diffuse increase in hepatic echogenicity (the so-called ‘bright liver’). Additional sonographic features include hepatomegaly; decreased ability of the ultrasound beam to penetrate the liver causing posterior darkness and loss of definition of the diaphragm (‘posterior beam attenua-tion’); and decreased visualization of the portal and hepat-ic veins giving rise to a bland appearance of the liver be-cause of compression by the surrounding fat-laden paren-chyma. In various studies, the sensitivity and specificity of US for NAFLD have ranged from 60-95% and 84-100%, respectively.19 Although these are seemingly acceptable
operating characteristics, it is important to note that the sensitivity of US decreases markedly in the setting of mild steatosis affecting less than 30% of hepatocytes.20
Al-though computed tomography (CT) and magnetic reso-nance imaging (MRI) can more reliably grade steatosis than US, they are not suitable for routine screening (e.g. due to cost and radiation exposure with CT), nor can any of these tools differentiate simple steatosis from NASH.19
Novel tools for the diagnosis of hepatic steatosis
Despite the high prevalence of NAFLD, relatively few studies have examined novel, noninvasive measures for
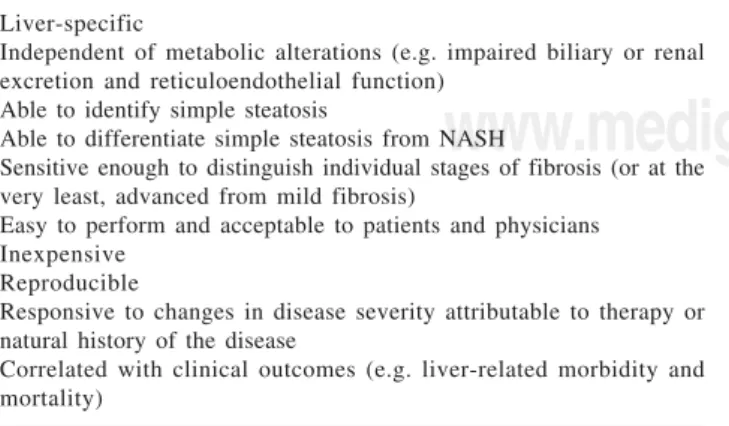
Table I. Characteristics of the ideal diagnostic marker of NAFLD. Liver-specific
Independent of metabolic alterations (e.g. impaired biliary or renal excretion and reticuloendothelial function)
Able to identify simple steatosis
Able to differentiate simple steatosis from NASH
Sensitive enough to distinguish individual stages of fibrosis (or at the very least, advanced from mild fibrosis)
Easy to perform and acceptable to patients and physicians Inexpensive
Reproducible
Responsive to changes in disease severity attributable to therapy or natural history of the disease
www.medigraphic.com
the prediction of hepatic steatosis. The identification of a simple, inexpensive tool for fatty liver would have enor-mous potential for population screening. Akin to the identification of biomarkers for the prediction of hepatic fibrosis (see below), Poynard et al. recently reported a combination of markers for steatosis referred to as the SteatoTest (BioPredictive, Paris, France).14 This
propri-etary index, which has yet to be externally validated, combines age, gender, body mass index (BMI), cholester-ol, triglycerides, glucose, ALT, GGT, bilirubin, hapto-globin, alpha-2-macroglobulin, and apolipoprotein A1 in a logistic regression formula. For the prediction of ste-atosis ≥ 5%, the SteatoTest had an AUROC of 0.80 in a cohort of 811 patients with NAFLD, HCV, hepatitis B (HBV), and alcoholic liver disease. Although this AU-ROC is generally considered indicative of a ‘good’ diag-nostic test, a substantial overlap between grades of ste-atosis will likely limit its widespread use. For example, the median SteatoTest value (which ranges between 0 and 1) was 0.14 in blood donors, 0.26 in patients without steatosis; 0.43 with 1-5% steatosis, 0.62 with 5-33% ste-atosis; 0.70 with 34-66% steatosis, and 0.75 with > 66% steatosis.14 Moreover, it is debatable whether the
diagno-sis of 5% steatodiagno-sis is of clinical significance.
An emerging imaging modality for the quantitative assessment of hepatic steatosis is proton magnetic reso-nance spectroscopy (1H MRS). This technology grades
hepatic triglyceride content (HTGC) by directly measur-ing protons in acyl groups of liver tissue triglycerides.21
In a recent illustrative study,22 Johnson et al. reported
that compared with lean individuals, obese patients with and without hepatic steatosis had relative increases in he-patic lipid saturation and decreases in polyunsaturation. The accuracy and safety of this technique make it an ide-al methodology to assess and monitor changes in HTGC in response to various therapeutic interventions. For ex-ample, in a randomized controlled trial of pioglitazone for NASH,7 Belfort et al. used 1H MRS to demonstrate a
54% reduction in hepatic fat content in patients treated with pioglitazone for 6 months; no difference was ob-served in controls. Although highly accurate and repro-ducible, the limited availability and cost of 1H MRS will
undoubtedly limit its use to research applications. Preliminary studies support a role for high-throughput or ‘omics’ technologies in the assessment of hepatic ste-atosis. For example, Younossi et al. examined hepatic gene expression and serum protein profiles in 98 bariat-ric surgery patients.23 In total, 7 genes/4 protein peaks
were identified that were differentially expressed in pa-tients with simple steatosis versus no steatosis; 3 genes/4 proteins for steatosis with nonspecific inflammation sus no steatosis; and 14 genes/4 proteins for NASH ver-sus controls. The specific genes hold clues to the patho-genesis of this condition. For example, patients with steatosis alone had a down-regulation of Mu-class glu-tathione S-transferases, which are important enzymes
in the cellular defense against oxidative stress. Con-versely, the FGFR2 gene encoding fibroblast growth fac-tor recepfac-tor 2 was significantly up-regulated. This gene likely plays a role in liver regeneration and hepatocyte survival.23 Similar studies employing a lipidomic
ap-proach have demonstrated changes in the lipid composi-tion of the liver across the histologic spectrum of NAFLD patients.24 In another recent study employing a
metabo-lomics approach, Subramanian et al. identified a small metabolite profile that was 100% sensitive and 96% spe-cific in differentiating patients with hepatic steatosis ver-sus controls.25 Specifically, principal components
analy-sis showed that increased levels of the beta anomer of glucose and decreased levels of lactate differentiated these two groups.
As the availability and expense of these technologies improve and validation studies emerge, one might envi-sion generation of a ‘hepatic steatosis profile’ that can identify the presence of fatty liver, estimate the severity of histologic features (e.g. simple steatosis versus NASH), and predict the risk of morbidity and mortality.
Novel tools for the differentiation of simple ste-atosis from NASH
NASH is characterized by hepatic steatosis with in-flammation, evidence of liver cell injury (eg. ballooning degeneration, necrosis), and fibrosis.26,27 As mentioned,
the differentiation of NASH from simple steatosis has im-portant prognostic implications and will be vital in the future to target effective therapies at individuals with the highest risk of complications. Despite extensive investi-gation, currently available tools for differentiating these important NAFLD phenotypes are not yet ready for the clinic. Different tools have been studied to identify pa-tients with NASH; they can broadly classified as biomar-kers of oxidative stress, inflammation, and hepatocyte ap-optosis (markers of fibrosis will be reviewed later).
Oxidative stress - an excess of pro-oxidant compared with anti-oxidant mechanisms – is key to the pathogene-sis of NAFLD. Both humans and experimental models of NASH have increased levels of oxidative stress within the liver. Thus, a number of investigators have examined markers of oxidative stress in the blood and/or breath of individuals with NAFLD in an attempt to different sim-ple fatty liver from NASH. In general, results have been disappointing and/or inconsistent, potentially because systemic levels of oxidative stress may or may not corre-late with hepatic levels. Nonetheless, several interesting studies along this line of research deserve mention. For example, in a study of 21 patients with NASH and 19 age/gender/BMI-matched controls,28 Chalasani et al.
acid-www.medigraphic.com
reacting substance (TBARS), these differences were not significant in multivariate analyses and ‘total antioxi-dant status’ did not differ between groups. There were also no differences in the intake of nutritional determi-nants of oxidative stress and defense (e.g. vitamin E, beta-carotene, selenium). In another study of 22 patients with NASH and 22 controls,29 the total plasma
antioxi-dant response (TAR), total plasma peroxide concentra-tion, and an oxidative stress index (OSI; the ratio of total peroxide to TAR) were significantly higher in NASH pa-tients than controls. Although fibrosis scores in those with NASH were significantly correlated with total perox-ide levels, OSI (both positively correlated), and TAR (in-versely correlated), no significant associations were ob-served with the grade of necroinflammatory activity. Fi-nally, in a recent French study including 64 patients with NAFLD and viral hepatitis,30 there was no significant
as-sociation between the presence of steatosis and blood levels of markers of oxidative stress (TBARS, superoxide dismutase activity, plasma and erythrocyte glutathione peroxidase activity, vitamin E, and selenium). Clearly, based on these discrepant results, additional studies are necessary before markers of oxidative stress can be used clinically to differentiate simple steatosis from NASH.
A variety of biomarkers of inflammation have also been studied for this purpose. It is well recognized that an imbalance between pro- and anti-inflammatory cytok-ines (e.g. tumor necrosis factor-α [TNF-α], interleukin-6 [IL-6]) and adipokines (e.g. adiponectin) are pathogenic in the progression from simple steatosis to NASH.31 As
with the aforementioned studies regarding markers of ox-idative stress, an inflammatory biomarker that has been validated and is ready for clinical use is not available. However, interesting preliminary findings have been re-ported. For example, in a study of 109 patients with NAFLD who underwent biopsy (80 of whom had NASH) and 82 controls, TNF-α levels were significantly higher and adiponectin levels lower in NAFLD patients.32
Al-though TNF-α levels did not differ between patients with simple steatosis and NASH, adiponectin levels were sig-nificantly lower in the latter subgroup. In this study, 84% of patients with NASH had adiponectin levels less than 10 µg/mL versus only 52% of those with simple ste-atosis. An index including adiponectin with the homeo-stasis model assessment of insulin resistance (HOMA-IR) had an AUROC of 0.79 (95% confidence interval [CI] 0.68-0.89) for the differentiation of simple steatosis from NASH. Jarrar and colleagues also reported lower adi-ponectin levels in patients with NASH versus simple ste-atosis, but in this study, TNF-α levels were higher in the former group.33 In comparison to simple steatosis, four
factors were independently associated with the presence of NASH: age, ALT, interleukin-8, and adiponectin.
Another inflammatory biomarker that has been stud-ied in NAFLD is C-reactive protein (CRP), an acute phase reactant synthesized in the liver that is elevated in
chron-ic inflammatory conditions and associated with central and visceral adiposity. Somewhat surprisingly, several studies have failed to show an association between CRP levels measured using highly sensitive assays and the presence of NASH.34,35 In one of these studies; however,
CC-chemokine ligand-2 (CCL2) was higher in patients with NASH than those with simple steatosis.35 This and
other inflammatory markers including cytokines (e.g. IL-6)36 and adipokines such as resistin and visfatin,33
de-serve further study as potential biomarkers of NASH. Another exciting development in the field of NAFLD biomarkers is the recognition that hepatocyte apoptosis plays an important role in the progression of NAFLD-re-lated liver injury. Both humans and animal models of NASH have increased hepatocyte cell death by apoptosis that is not seen in simple steatosis.37,38 This finding has
been exploited for diagnostic purposes via the develop-ment of assays for cleavage products of various sub-strates for effector caspases (notably caspase-3). A prom-ising assay measures caspase-generated fragments of cy-tokeratin-18 (CK-18), the major intermediate protein filament in the liver. In a study by Wieckowska and col-leagues, plasma CK-18 fragments were markedly in-creased in patients with NASH compared with simple ste-atosis or normal biopsies.37 Moreover, CK-18 fragment
levels independently predicted NASH (odds ratio [OR] 1.95 for every 50 U/L increase; 95% CI 1.18-3.22). A cut-off value of 395 U/L was 99.9% specific and 85.7% sen-sitive for NASH. In another study also restricted to bari-atric surgery patients, Diab et al. observed higher cleaved CK-18 levels in patients with NASH compared with simple steatosis and controls; the AUROC for NASH was 0.88 (95% CI 0.77-0.99).39 Interestingly, a
signifi-cant decrease in CK-18 levels was observed in most pa-tients six months postoperatively, suggesting that this tool is responsive to histologic changes attributable to effective therapy for NAFLD. Ultimately, this test is un-likely to be used in isolation since most studies would suggest that combinations of biomarkers have the high-est predictive utility. In one such study by Younossi and colleagues that included 101 patients undergoing bariat-ric surgery, cleaved CK-18 was combined with a marker of necrosis (CK-18 minus cleaved CK-18), adiponectin, and resistin in an index now referred to as the NASH Di-agnostics™ Biomarker Panel.40 For the differentiation of
simple steatosis from NASH, this index had AUROCs of 0.91 (95% CI 0.81-0.96) and 0.73 (95% CI 0.55-0.87) in the derivation and validation cohorts, respectively. If these findings are validated in large-scale, multicenter studies that include more diverse patient populations, markers of apoptosis may prove useful for the identifica-tion of patients with NASH.
The final biomarker of inflammation in NAFLD that deserves mention is the NashTest (Biopredictive; Paris, France) developed by Poynard and colleagues.41 This
Stea-www.medigraphic.com
toTest in addition to AST. In a study that included 257 patients with NAFLD who underwent liver biopsy,41 this
panel was 71% sensitive and 94% specific for the diag-nosis of NASH versus no NASH or borderline NASH ac-cording to the NAFLD Activity Score.27 The AUROC for
this outcome was 0.75 (95% CI 0.67-0.82). As this index has not been externally validated, additional study is necessary prior to its widespread dissemination.
Noninvasive assessment of hepatic fibrosis
An important endpoint for a biomarker in NAFLD is the ability to identify advanced fibrosis because patients with this degree of liver damage are at risk of major com-plications including end-stage liver disease and hepato-cellular carcinoma. A large number of biochemical mark-ers have been assessed for the evaluation of hepatic fibro-sis across a diverse spectrum of liver diseases. These assays can be broadly divided into 2 groups: 1) indirect markers of fibrosis that reflect alterations in hepatic func-tion, but do not directly reflect extracellular matrix (ECM) metabolism (e.g. liver biochemistry, platelets); and 2) direct markers of fibrosis that reflect the dynamics of ECM turnover (e.g. matrix metalloproteinases and
their inhibitors, collagens, hyaluronic acid).42,43 Most
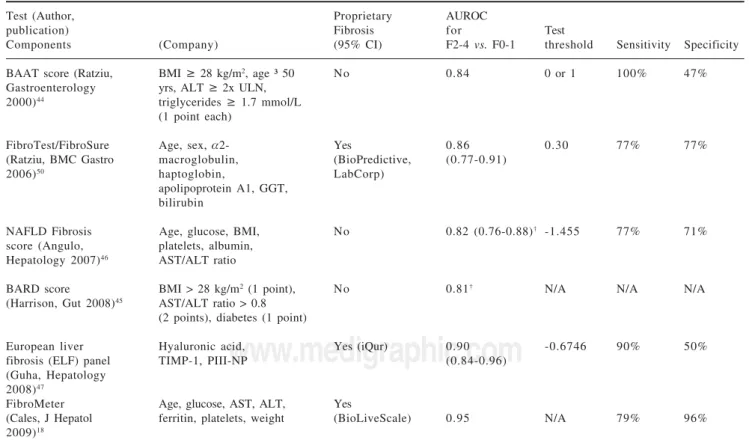
studies suggest that combinations of direct and indirect markers, with in some cases, routine clinical variables (e.g. age, sex, and BMI), are most useful. In fact a grow-ing number of fibrosis marker panels have been devel-oped and many commercialized. Although most panels were derived in patients with chronic HCV, validation studies in other conditions, including NAFLD, are emerging. Table II includes summary data for fibrosis marker panels that have been specifically examined in patients with NAFLD. Although I will briefly discuss each of these panels, interested readers are directed to ex-cellent general reviews of liver fibrosis markers.42,43
The first index developed to predict NAFLD-related fi-brosis, the BAAT score, was reported by Ratziu and col-leagues in a cohort of 93 overweight patients.44
Accord-ing to this score, 1 point is given for each of BMI ≥ 28 kg/m2, age ≥ 50 years, ALT ≥ twice normal, and triglyc-erides ≥ 1.7 mmol/L. In patients with a BAAT score of 0 or 1, significant fibrosis (≥ F2) was excluded with 100% certainty (sensitivity 100%, specificity 47%). At the op-posite end of the spectrum, a BAAT score of 4 was 100% specific for significant fibrosis, although the sensitivity was poor (14%). In a recently reported study employing a
Table II. Overview of selected serum fibrosis marker panels evaluated in patients with NAFLD.*
Test (Author, Proprietary AUROC
publication) Fibrosis for Test
Components (Company) (95% CI) F2-4 vs. F0-1 threshold Sensitivity Specificity
BAAT score (Ratziu, BMI ≥ 28 kg/m2, age ³ 50 No 0.84 0 or 1 100% 47%
Gastroenterology yrs, ALT ≥ 2x ULN,
2000)44 triglycerides ≥ 1.7 mmol/L
(1 point each)
FibroTest/FibroSure Age, sex, α2- Yes 0.86 0.30 77% 77%
(Ratziu, BMC Gastro macroglobulin, (BioPredictive, (0.77-0.91)
2006)50 haptoglobin, LabCorp)
apolipoprotein A1, GGT, bilirubin
NAFLD Fibrosis Age, glucose, BMI, No 0.82 (0.76-0.88)† -1.455 77% 71%
score (Angulo, platelets, albumin,
Hepatology 2007)46 AST/ALT ratio
BARD score BMI > 28 kg/m2 (1 point), No 0.81† N/A N/A N/A
(Harrison, Gut 2008)45 AST/ALT ratio > 0.8
(2 points), diabetes (1 point)
European liver Hyaluronic acid, Yes (iQur) 0.90 -0.6746 90% 50%
fibrosis (ELF) panel TIMP-1, PIII-NP (0.84-0.96)
(Guha, Hepatology 2008)47
FibroMeter Age, glucose, AST, ALT, Yes
(Cales, J Hepatol ferritin, platelets, weight (BioLiveScale) 0.95 N/A 79% 96%
2009)18
AUROC, area under the receiver operating characteristic curve; GGT, gamma-glutamyltranspeptidase; N/A, not available; PIII-NP, N-terminal peptide of procollagen III; TIMP-1, tissue inhibitor of metalloproteinase-1; ULN, upper limit of normal.
www.medigraphic.com
similar approach, Harrison et al. derived the BARD score, which includes a combination of BMI > 28 kg/m2 (given
1 point), AST/ALT ratio > 0.8 (2 points), and the pres-ence of diabetes mellitus (1 point), in a cohort of 827 pa-tients with NAFLD.45 The score, which ranges from 0 to 4,
had an AUROC of 0.81 for bridging fibrosis or cirrhosis. With a BARD score of 0 or 1, simple steatosis or NASH with mild fibrosis (F0-2) was confirmed with 96% cer-tainty, obviating liver biopsy in these patients. On the contrary, BARD scores of 3-4 were associated with a 43% probability of NASH with bridging fibrosis or cirrhosis (F3-4). In these patients, a liver biopsy would be recom-mended to confirm or exclude advanced disease due to this suboptimal predictive value. Although additional studies are necessary to validate this simple index, it is promising due its inclusion of readily available clinical data and the ability to exclude significant disease with very high accuracy.
In another study that included routinely available parameters, Angulo and colleagues from multiple inter-national centers derived and validated the NAFLD Fi-brosis Score, which consists of age, hyperglycemia, BMI, platelets, albumin, and the AST/ALT ratio com-bined in a logistic regression formula.46 For the
diagno-sis of bridging fibrodiagno-sis or cirrhodiagno-sis (F3-4), the AUROCs of the NAFLD Fibrosis Score were 0.88 (95% CI 0.85-0.92) and 0.82 (95% CI 0.76-0.88) in the derivation and validation groups, respectively. Scores less than a low cutoff (-1.455), present in 61% of the cohort, excluded significant fibrosis with 93% certainty (sensitivity 82%, specificity 77%). On the contrary, scores at the opposite extreme (> 0.676), present in 15% of patients, ruled in bridging fibrosis or cirrhosis with 90% accuracy (sensi-tivity 51%, specificity 98%). These results have subse-quently been validated by Guha and colleagues who re-ported an AUROC of 0.89 (95% CI 0.81-0.97) for this outcome.47 In the same study, the European Liver
Fibro-sis Panel (ELF),48 an index including hyaluronic acid,
tissue inhibitor of metalloproteinase-1 (TIMP-1), and N-terminal peptide of procollagen-III (PIII-NP) that was originally derived in patients with a broad spectrum of liver diseases, was validated. The AUROCs of the ELF panel were 0.90 (95% CI 0.84-0.96) and 0.93 (95% CI 0.88-0.98) for septal fibrosis (≥ F2) and bridging fibro-sis/cirrhosis, respectively. For septal fibrosis, using thresholds with 90% sensitivity and specificity, 62% of patients would have avoided a liver biopsy, with 52% correctly classified (i.e. a 10% error rate), and 38% would have had an indeterminate result. Ultimately, a combination of the NAFLD fibrosis score and ELF pan-el was most accurate with AUROCs of 0.93 (95% CI 0.88-0.99) for septal fibrosis and 0.98 (95% CI 0.96-1.00) for bridging fibrosis or cirrhosis.47 Additional
studies are necessary to validate these findings and con-firm the cost-effectiveness of using these algorithms in combination.
The most widely validated fibrosis marker panel is the FibroTest (Biopredictive; Paris, France), originally de-scribed by Imbert-Bismut et al. in patients with chronic HCV.49 This index includes age, gender, bilirubin, GGT,
haptoglobin, apolipoprotein A1, and alpha-2-macroglobu-lin combined in a logistic regression formula that is avail-able on a proprietary basis. Among 170 patients with NAFLD, the AUROC of the FibroTest for septal fibrosis (≥ F2) and bridging fibrosis (F3-4) were 0.86 (95% CI 0.77-0.91) and 0.92 (95% CI 0.83-0.96), respectively.50 These
figures are similar to those reported in patients with other liver conditions including chronic HCV. Importantly, there was a discordance of at least 2 fibrosis stages estimat-ed by the FibroTest and biopsy in 10% of patients; half were attributable to failure of the fibrosis marker panel. An important cause of discordance – specifically, a false nega-tive FibroTest measurement - was a highly elevated apoli-poprotein A1 concentration, potentially attributable to the dyslipidemia frequently seen in patients with NAFLD.50
The most recently developed serum marker panel for the diagnosis of NAFLD-related fibrosis is referred to as the NAFLD Fibrometer, developed by Cales and colleagues in a French study of 235 patients.18 This index, which
in-cludes age, glucose, AST, ALT, ferritin, platelets, and body weight, had AUROCs of 0.94 and 0.90 for septal fi-brosis (≥ F2) and cirrhosis (F4), respectively. Its perfor-mance was significantly better than both the NAFLD Fi-brosis Score and APRI. If validated, this index may prove very useful clinically because it includes readily available parameters in a formula that has been published.
www.medigraphic.com
ESTE DOCUMENTO ES ELABORADO POR MEDI-GRAPHIC
Transient elastography (TE; Fibroscan®, Echosens,
Paris, France) is a relatively novel approach to measuring liver stiffness - a surrogate for liver fibrosis – that has gained increasing clinical use.52 The technique utilizes
an US transducer probe mounted on the axis of a vibrator which transmits a low frequency (50 Hz), elastic shear wave through the liver. The velocity of the wave, mea-sured using pulse-echo US acquisition, is proportional to liver stiffness; stiffer, fibrotic livers are associated with faster wave propagation.53 TE is entirely noninvasive,
takes less than 5 minutes to complete, can be reliably per-formed following a short training period (≥50 examina-tions are necessary for competency), is highly reliable (coefficients of variation ~3%),52 and can be readily
inte-grated into an outpatient hepatology clinic. Moreover, since TE measures liver stiffness in a volume roughly 100-times that of the typical liver biopsy, it is likely more representative of the entire hepatic parenchyma.53
Since originally described in 2003,52 numerous
publica-tions have assessed the performance of TE across a spectrum of liver diseases. In a systematic review of 50 such studies, Friedrich-Rust et al. reported summary AUROCs (95% CI) for the diagnosis of septal fibrosis (≥ F2), bridging fibrosis (≥ F3) and cirrhosis (F4) of 0.84 (0.82-0.86), 0.89 (0.88-0.91), and 0.94 (0.93-0.95), respective-ly. Thus far, studies describing the performance of TE in patients with NAFLD are limited. However, in a recent study including 97 NAFLD patients, Yoneda et al. re-ported similar operating characteristics.55 For the
diagno-sis of septal fibrodiagno-sis (≥ F2), liver stiffness exceeding 6.65 kPa was 88% sensitive and 74% specific (AUROC 0.87). For cirrhosis, a cutoff of 17.5 kPa was 100% sensitive and 97% specific (AUROC 0.99). Similarly, Kelleher re-ported that a TE cutoff of 8.7 kPa was 81% sensitive and 78% specific for septal fibrosis among 129 patients with NASH.56
Several caveats warrant mention when discussing the utility of TE in patients with NAFLD. First, technical failure occurs in approximately 5% of patients, predomi-nantly those with obesity/thick chest walls, which is al-most universal in this patient population.57,58 In one
study, the only independent risk factor for failure to ob-tain a TE measurement was a BMI greater than 28 kg/m2
(odds ratio 10.0; 95% CI 5.7-17.9).59 Specific probes
un-der development will hopefully minimize this limitation by sampling an acoustic window that is deeper within the abdomen. Second, the best TE thresholds for the delinea-tion of fibrosis stages are unclear, and may be disease-de-pendent. For example, the optimal cutoffs reported in Friedrich-Rust and colleagues’ meta-analysis, which in-cluded predominantly patients with HCV, were 7.7 kPa and 13.0 kPa for septal fibrosis and cirrhosis, respective-ly.54 These figures are clearly different from those
de-scribed above in studies restricted to NAFLD patients. Although these discrepancies may relate to differences in study populations and fibrosis classification systems
be-tween diseases, additional investigation is necessary to clarify this issue in patients with NAFLD (and all liver diseases). Finally, it is unknown whether the severity of hepatic steatosis has an impact of liver stiffness, as has been described for hepatic inflammation in the setting of acute and chronic viral hepatitis.60,61 In studies of
poten-tial liver donors62 and a recent description of NAFLD
pa-tients,55 steatosis was not associated with liver stiffness.
On the contrary, among 324 patients with chronic HCV, the severity of hepatic steatosis was an independent pre-dictor of liver stiffness.63 In light of these unresolved
is-sues, and despite the widespread use of TE in patients with NAFLD, much further investigation is necessary to guide the optimal incorporation of this promising tech-nology into routine clinical practice.
A technique related to TE, known as magnetic reso-nance elastography (MRE), also holds promise for the noninvasive assessment of liver fibrosis, including in pa-tients with NAFLD.64,65 This tool uses a passive
pneumat-ic driver placed over the abdomen to transmit acoustpneumat-ic pressure waves (60 Hz) through the liver. Using a stan-dard MRI system and specialized software, an elastogram is produced, akin to that with TE, that quantifies liver stiffness. Advantages of MRE over conventional TE in-clude: 1) the ability to scan the entire liver and avoid sampling error; 2) insensitivity to body habitus (i.e. thickness of the chest wall) for acquisition of an acoustic window; and 3) the ability to obtain conventional MRI at the same sitting.65 In a recent study describing the
per-formance of MRE in 54 patients with NAFLD, Talwalkar et al. reported a significant association between liver stiffness values and fibrosis that was independent of BMI. For the detection of septal fibrosis (≥ F2), a thresh-old value ≥ 4.2 kPa had a sensitivity of 78%, specificity of 94%, and AUROC of 0.90.66 For cirrhosis,
correspond-ing figures were 90%, 87%, and 0.94, respectively. Inter-estingly, ten individuals with hepatic steatosis on histol-ogy had liver stiffness values consistent with healthy controls (< 2.9 kPa), suggesting that steatosis itself has a minimal impact on liver stiffness assessed using MRE. Future studies will be necessary to validate these find-ings and confirm the cost-effectiveness of MRE before it gains widespread clinical use.
Conclusions
dur-www.medigraphic.com
ing the past decade. As effective therapies for NAFLD are under development, it is vital that simple, inexpensive, widely available, and accurate tools that are responsive to changes in NAFLD severity and correlated with clini-cal outcomes are developed. To achieve these goals, large, multicenter studies that include well-defined pa-tient cohorts with adequate liver biopsy specimens and prospective follow-up will be critical.
Acknowledgements
Dr. Myers is supported by a Clinical Investigator Award from the Alberta Heritage Foundation for Medical Research (AHFMR) and a New Investigator Award from the Canadian Institutes of Health Research (CIHR).
References
1. Guha IN, Parkes J, Roderick PR, Harris S, Rosenberg WM. Non-invasive markers associated with liver fibrosis in non-alcoholic fatty liver disease. Gut 2006; 55: 1650-60.
2. Wieckowska A, McCullough AJ, Feldstein AE. Noninvasive di-agnosis and monitoring of nonalcoholic steatohepatitis: present and future. Hepatology 2007; 46: 582-9.
3. Clark JM. The epidemiology of nonalcoholic fatty liver disease in adults. J Clin Gastroenterol 2006; 40 Suppl 1: S5-10.
4. Adams LA, Lymp JF, St Sauver J, Sanderson SO, Lindor KD,
Feldstein A, Angulo P. The natural history of nonalcoholic fatty liver disease: a population-based cohort study. Gastroenterology
2005; 129: 113-21.
5. Harrison SA, Torgerson S, Hayashi PH. The natural history of nonalcoholic fatty liver disease: a clinical histopathological study.
Am J Gastroenterol 2003; 98: 2042-7.
6. Ekstedt M, Franzen LE, Mathiesen UL, Thorelius L, Holmqvist M, Bodemar G, Kechagias S. Long-term follow-up of patients with NAFLD and elevated liver enzymes. Hepatology 2006; 44: 865-73. 7. Belfort R, Harrison SA, Brown K, Darland C, Finch J, Hardies J, Balas B, Gastaldelli A, Tio F, Pulcini J, Berria R, Ma JZ, Dwivedi S, Havranek R, Fincke C, DeFronzo R, Bannayan GA, Schenker S, Cusi K. A placebo-controlled trial of pioglitazone in subjects with nonalcoholic steatohepatitis. N Engl J Med 2006; 355: 2297-307.
8. Bravo AA, Sheth SG, Chopra S. Liver biopsy. N Engl J Med
2001; 344: 495-500.
9. Bedossa P, Dargere D, Paradis V. Sampling variability of liver fibrosis in chronic hepatitis C. Hepatology 2003; 38: 1449-57. 10. Regev A, Berho M, Jeffers LJ, Milikowski C, Molina EG,
Pyrsopoulos NT, Feng ZZ, Reddy KR, Schiff ER. Sampling error and intraobserver variation in liver biopsy in patients with chronic HCV infection. Am J Gastroenterol 2002; 97: 2614-8. 11. Ratziu V, Charlotte F, Heurtier A, Gombert S, Giral P, Bruckert E,
Grimaldi A, Capron F, Poynard T. Sampling variability of liver biopsy in nonalcoholic fatty liver disease. Gastroenterology 2005; 128: 1898-906.
12. Angulo P, Keach JC, Batts KP, Lindor KD. Independent predic-tors of liver fibrosis in patients with nonalcoholic steatohepatitis.
Hepatology 1999; 30: 1356-62.
13. Kunde SS, Lazenby AJ, Clements RH, Abrams GA. Spectrum of NAFLD and diagnostic implications of the proposed new
normal range for serum ALT in obese women. Hepatology
2005; 42: 650-6.
14. Poynard T, Ratziu V, Naveau S, Thabut D, Charlotte F, Messous D, Capron D, Abella A, Massard J, Ngo Y, Munteanu M, Mercadier A, Manns M, Albrecht J. The diagnostic value of biomarkers (SteatoTest) for the prediction of liver steatosis. Comp Hepatol 2005; 4: 10.
15. Wai CT, Greenson JK, Fontana RJ, Kalbfleisch JD, Marrero JA, Conjeevaram HS, Lok AS. A simple noninvasive index can pre-dict both significant fibrosis and cirrhosis in patients with chronic hepatitis C. Hepatology 2003; 38: 518-26.
16. Shaheen AA, Myers RP. Diagnostic accuracy of the aspartate aminotransferase-to-platelet ratio index for the prediction of hepa-titis C-related fibrosis: A systematic review. Hepatology 2007; 46: 912-21.
17. Loaeza-del-Castillo A, Paz-Pineda F, Oviedo-Cardenas E, Sánchez-Ávila F, Vargas-Vorackova F. AST to platelet ratio index (APRI) for the noninvasive evaluation of liver fibrosis. Ann Hepatol 2008; 7: 350-7.
18. Cales P, Laine F, Boursier J, Deugnier Y, Moal V, Oberti F, Hunault G, Rousselet MC, Hubert I, Laafi J, Ducluzeaux PH, Lunel F. Comparison of blood tests for liver fibrosis specific or not to NAFLD. J Hepatol 2009; 50: 165-73.
19. Charatcharoenwitthaya P, Lindor KD. Role of radiologic modali-ties in the management of non-alcoholic steatohepatitis. Clin Liver Dis 2007; 11: 37-54, viii.
20. Saadeh S, Younossi ZM, Remer EM, Gramlich T, Ong JP, Hurley M, Mullen KD, Cooper JN, Sheridan MJ. The utility of radiologi-cal imaging in nonalcoholic fatty liver disease. Gastroenterology
2002; 123: 745-50.
21. Thomsen C, Becker U, Winkler K, Christoffersen P, Jensen M, Henriksen O. Quantification of liver fat using magnetic reso-nance spectroscopy. Magn Reson Imaging 1994; 12: 487-95. 22. Johnson NA, Walton DW, Sachinwalla T, Thompson CH, Smith
K, Ruell PA, Stannard SR, George J. Noninvasive assessment of hepatic lipid composition: Advancing understanding and man-agement of fatty liver disorders. Hepatology 2008; 47: 1513-23. 23. Younossi ZM, Baranova A, Ziegler K, Del Giacco L, Schlauch K, Born TL, Elariny H, Gorreta F, VanMeter A, Younoszai A, Ong JP, Goodman Z, Chandhoke V. A genomic and proteomic study of the spectrum of nonalcoholic fatty liver disease. Hepatology 2005; 42: 665-74.
24. Puri P, Baillie RA, Wiest MM, Mirshahi F, Choudhury J, Cheung O, Sargeant C, Contos MJ, Sanyal AJ. A lipidomic analysis of nonalcoholic fatty liver disease. Hepatology 2007; 46: 1081-90. 25. Subramanian V, Aithal GP, Byrne JJ, Daykin CA, Kaye P. Serum metabolomics reveals novel metabolic markers of nonalcoholic fatty liver disease (Abstract). Hepatology 2008; 48(Suppl 1): A1130.
26. Yeh MM, Brunt EM. Pathology of nonalcoholic fatty liver dis-ease. Am J Clin Pathol 2007; 128: 837-47.
27. Kleiner DE, Brunt EM, Van Natta M, Behling C, Contos MJ, Cummings OW, Ferrell LD, Liu YC, Torbenson MS, Unalp-Arida A, Yeh M, McCullough AJ, Sanyal AJ. Design and validation of a histological scoring system for nonalcoholic fatty liver disease.
Hepatology 2005; 41: 1313-21.
28. Chalasani N, Deeg MA, Crabb DW. Systemic levels of lipid peroxidation and its metabolic and dietary correlates in patients with nonalcoholic steatohepatitis. Am J Gastroenterol 2004; 99: 1497-502.
29. Horoz M, Bolukbas C, Bolukbas FF, Sabuncu T, Aslan M, Sarifakiogullari S, Gunaydin N, Erel O. Measurement of the total antioxidant response using a novel automated method in subjects with nonalcoholic steatohepatitis. BMC Gastroenterol 2005; 5: 35. 30. Bonnefont-Rousselot D, Ratziu V, Giral P, Charlotte F, Beucler I, Poynard T. Blood oxidative stress markers are unreliable markers of hepatic steatosis. Aliment Pharmacol Ther 2006; 23: 91-8. 31. Tilg H, Hotamisligil GS. Nonalcoholic fatty liver disease:
Cytokine-adipokine interplay and regulation of insulin resistance. Gastro-enterology 2006; 131: 934-45.
32. Hui JM, Hodge A, Farrell GC, Kench JG, Kriketos A, George J. Beyond insulin resistance in NASH: TNF-alpha or adiponectin?
Hepatology 2004; 40: 46-54.
www.medigraphic.com
34. Hui JM, Farrell GC, Kench JG, George J. High sensitivity C-reactive protein values do not reliably predict the severity of histological changes in NAFLD. Hepatology 2004; 39: 1458-9. 35. Haukeland JW, Damas JK, Konopski Z, Loberg EM, Haaland T, Goverud I, Torjesen PA, Birkeland K, Bjoro K, Aukrust P. Sys-temic inflammation in nonalcoholic fatty liver disease is character-ized by elevated levels of CCL2. J Hepatol 2006; 44: 1167-74. 36. Wieckowska A, Papouchado BG, Li Z, Lopez R, Zein NN, Feldstein
AE. Increased hepatic and circulating interleukin-6 levels in hu-man nonalcoholic steatohepatitis. Am J Gastroenterol 2008; 103: 1372-9.
37. Wieckowska A, Zein NN, Yerian LM, López AR, McCullough AJ, Feldstein AE. In vivo assessment of liver cell apoptosis as a novel biomarker of disease severity in nonalcoholic fatty liver disease.
Hepatology 2006; 44: 27-33.
38. Feldstein AE, Canbay A, Angulo P, Taniai M, Burgart LJ, Lindor KD, Gores GJ. Hepatocyte apoptosis and fas expression are promi-nent features of human nonalcoholic steatohepatitis. Gastroen-terology 2003; 125: 437-43.
39. Diab DL, Yerian L, Schauer P, Kashyap SR, López R, Hazen SL, Feldstein AE. Cytokeratin 18 fragment levels as a noninvasive biomarker for nonalcoholic steatohepatitis in bariatric surgery patients. Clin Gastroenterol Hepatol 2008; 6: 1249-54. 40. Younossi ZM, Jarrar M, Nugent C, Randhawa M, Afendy M,
Stepanova M, Rafiq N, Goodman Z, Chandhoke V, Baranova A. A novel diagnostic biomarker panel for obesity-related nonalco-holic steatohepatitis (NASH). Obes Surg 2008; 18: 1430-7. 41. Poynard T, Ratziu V, Charlotte F, Messous D, Munteanu M,
Imbert-Bismut F, Massard J, Bonyhay L, Tahiri M, Thabut D, Cadranel JF, Le Bail B, de Ledinghen V. Diagnostic value of biochemical markers (NashTest) for the prediction of non alcoholo steato hepatitis in patients with non-alcoholic fatty liver disease. BMC Gastroenterol 2006; 6: 34.
42. Pinzani M, Vizzutti F, Arena U, Marra F. Technology Insight: noninvasive assessment of liver fibrosis by biochemical scores and elastography. Nat Clin Pract Gastroenterol Hepatol 2008; 5: 95-106.
43. Rockey DC, Bissell DM. Noninvasive measures of liver fibrosis.
Hepatology 2006; 43: S113-20.
44. Ratziu V, Giral P, Charlotte F, Bruckert E, Thibault V, Theodorou I, Khalil L, Turpin G, Opolon P, Poynard T. Liver fibrosis in overweight patients. Gastroenterology 2000; 118: 1117-23. 45. Harrison SA, Oliver D, Arnold HL, Gogia S, Neuschwander-Tetri
BA. Development and validation of a simple NAFLD clinical scoring system for identifying patients without advanced disease.
Gut 2008; 57: 1441-7.
46. Angulo P, Hui JM, Marchesini G, Bugianesi E, George J, Farrell GC, Enders F, Saksena S, Burt AD, Bida JP, Lindor K, Sanderson SO, Lenzi M, Adams LA, Kench J, Therneau TM, Day CP. The NAFLD fibrosis score: a noninvasive system that identifies liver fibrosis in patients with NAFLD. Hepatology 2007; 45: 846-54. 47. Guha IN, Parkes J, Roderick P, Chattopadhyay D, Cross R, Harris S, Kaye P, Burt AD, Ryder SD, Aithal GP, Day CP, Rosenberg WM. Noninvasive markers of fibrosis in nonalcoholic fatty liver disease: Validating the European Liver Fibrosis Panel and explor-ing simple markers. Hepatology 2008; 47: 455-60.
48. Rosenberg WM, Voelker M, Thiel R, Becka M, Burt A, Schuppan D, Hubscher S, Roskams T, Pinzani M, Arthur MJ. Serum mark-ers detect the presence of liver fibrosis: a cohort study. Gastroen-terology 2004; 127: 1704-13.
49. Imbert-Bismut F, Ratziu V, Pieroni L, Charlotte F, Benhamou Y, Poynard T. Biochemical markers of liver fibrosis in patients with hepatitis C virus infection: a prospective study. Lancet 2001; 357: 1069-75.
50. Ratziu V, Massard J, Charlotte F, Messous D, Imbert-Bismut F, Bonyhay L, Tahiri M, Munteanu M, Thabut D, Cadranel JF, Le Bail B, de Ledinghen V, Poynard T. Diagnostic value of bio-chemical markers (FibroTest-FibroSURE) for the prediction of liver fibrosis in patients with non-alcoholic fatty liver disease.
BMC Gastroenterol 2006; 6: 6.
51. Van Ness MM, Diehl AM. Is liver biopsy useful in the evaluation of patients with chronically elevated liver enzymes? Ann Intern Med 1989; 111: 473-8.
52. Sandrin L, Fourquet B, Hasquenoph JM, Yon S, Fournier C, Mal F, Christidis C, Ziol M, Poulet B, Kazemi F, Beaugrand M, Palau R. Transient elastography: a new noninvasive method for assessment of hepatic fibrosis. Ultrasound Med Biol 2003; 29: 1705-13. 53. Castera L, Forns X, Alberti A. Non-invasive evaluation of liver
fi-brosis using transient elastography. J Hepatol 2008; 48: 835-47. 54. Friedrich-Rust M, Ong MF, Martens S, Sarrazin C, Bojunga J,
Zeuzem S, Herrmann E. Performance of transient elastography for the staging of liver fibrosis: a meta-analysis. Gastroenterol-ogy 2008; 134: 960-74.
55. Yoneda M, Mawatari H, Fujita K, Endo H, Iida H, Nozaki Y, Yonemitsu K, Higurashi T, Takahashi H, Kobayashi N, Kirikoshi H, Abe Y, Inamori M, Kubota K, Saito S, Tamano M, Hiraishi H, Maeyama S, Yamaguchi N, Togo S, Nakajima A. Noninvasive assessment of liver fibrosis by measurement of stiffness in pa-tients with nonalcoholic fatty liver disease (NAFLD). Dig Liver Dis 2008; 40: 371-8.
56. Kelleher T, MacFarlane C, de Ledinghen V, Beaugrand M, Foucher J, Castera L. Risk factors and hepatic elastography (FibroScan) in the prediction of hepatic fibrosis in non-alcoholic steatohepatitis (Abstract). Gastroenterology 2006; 130: A736.
57. Castera L, Vergniol J, Foucher J, Le Bail B, Chanteloup E, Haaser M, Darriet M, Couzigou P, De Ledinghen V. Prospective com-parison of transient elastography, Fibrotest, APRI, and liver bi-opsy for the assessment of fibrosis in chronic hepatitis C. Gastro-enterology 2005; 128: 343-50.
58. Kettaneh A, Marcellin P, Douvin C, Poupon R, Ziol M, Beaugrand M, de Ledinghen V. Features associated with success rate and performance of FibroScan measurements for the diagnosis of cirrhosis in HCV patients: a prospective study of 935 patients. J Hepatol 2007; 46: 628-34.
59. Foucher J, Castera L, Bernard PH, Adhoute X, Laharie D, Bertet J, Couzigou P, de Ledinghen V. Prevalence and factors associated with failure of liver stiffness measurement using FibroScan in a prospective study of 2,114 examinations. Eur J Gastroenterol Hepatol 2006; 18: 411-2.
60. Arena U, Vizzutti F, Corti G, Ambu S, Stasi C, Bresci S, Moscarella S, Boddi V, Petrarca A, Laffi G, Marra F, Pinzani M. Acute viral hepatitis increases liver stiffness values measured by transient elastography. Hepatology 2008; 47: 380-4.
61. Arena U, Vizzutti F, Abraldes JG, Corti G, Stasi C, Moscarella S, Milani S, Lorefice E, Petrarca A, Romanelli RG, Laffi G, Bosch J, Marra F, Pinzani M. Reliability of transient elastography for the diagnosis of advanced fibrosis in chronic hepatitis C. Gut 2008; 57: 1288-93.
62. Kim KM, Choi WB, Park SH, Yu E, Lee SG, Lim YS, Lee HC, Chung YH, Lee YS, Suh DJ. Diagnosis of hepatic steatosis and fibrosis by transient elastography in asymptomatic healthy indi-viduals: a prospective study of living related potential liver do-nors. J Gastroenterol 2007; 42: 382-8.
63. Lupsor M, Badea R, Stefanescu H, Grigorescu M, Sparchez Z, Serban A, Branda H, Iancu S, Maniu A. Analysis of histopatho-logical changes that influence liver stiffness in chronic hepatitis C. Results from a cohort of 324 patients. J Gastrointestin Liver Dis 2008; 17: 155-63.
64. Muthupillai R, Lomas DJ, Rossman PJ, Greenleaf JF, Manduca A, Ehman RL. Magnetic resonance elastography by direct visual-ization of propagating acoustic strain waves. Science 1995; 269: 1854-7.
65. Talwalkar JA, Yin M, Fidler JL, Sanderson SO, Kamath PS, Ehman RL. Magnetic resonance imaging of hepatic fibrosis: emerging clinical applications. Hepatology 2008; 47: 332-42.
66. Talwalkar JA, Gross JB, Venkatesh M, Yin J, Glocker N, Takahashi KD, Watt KD, Charlton M, Kamath P, Ehman R. Magnetic reso-nance elastography accurately detects moderate to severe hepatic fibrosis in obese individuals with NAFLD (Abstract). Hepatology