A Simulation Agent for Efficient Network Evaluation in 3G Cellular Mobile
Radio Planning
Joseph Isabona Department of Physics
University of Uyo, PMB. 1017, Uyo, 520001, Uyo, Nigeria ([email protected])
Moses E. Ekpenyong
Department of Mathematics, Statistics and Computer Science University of Uyo, PMB. 1017, Uyo, 520001, Uyo, Nigeria
([email protected]) and
Ojeabu Akhirevbulu Department of Physics
Ambrose Alli University, Ekpoma, Nigeria ([email protected])
ABSTRACT
An accurate procedure for evaluating the strong correlation and conflicting goals of coverage, capacity and Quality of Service (QoS) is required for efficient planning of 3G radio networks. In this paper, we explore and implement an agent-based simulation methodology which allows for the fine-tuning of the input model parameters to study and evaluate the performance of Code Division Multiple Access (CDMA) systems. The results obtained are represented graphically to show scenarios for both uplink and downlink limited CDMA. The analysis is extended to demonstrate how Tower Mounted Amplifiers (TMA) can be used to benefit the uplink performance of a
0
1×EV−D data system.
Keywords: CDMA, QoS, Multipath propagation, Pathloss, Handoff.
1. INTRODUCTION
The success of second generation (2G) mobile networks and the rapid growth of mobile and Internet users piloted the development of the third generation (3G) of mobile telecommunication systems. The 3G technology is standardized by the 3G Partnership Project (3GPP) [1] in
Europe, and is named Universal Mobile
Telecommunication System (UMTS). Initially in the first release of 3GPP UMTS R99 [2], the UMTS transport network technology was ATM-based, but in the later specification of 3GPP UMTS R5 [3] the aim is to have an “All IP” architecture, i.e. the transport technology in all the parts of the UMTS network is IP-based.
The goal of the all-IP network is to minimize network operation costs by enabling broadband access operators to move from being mere connectivity providers to full-service providers, providing Internet connectivity, voice services and next generation broadband services to end users, all from a single network.
To enable the co-existence of multiple users and the simultaneous sharing of the same air interface, several radio communication techniques exist. These techniques are broadly used in UMTS and Enhanced-UMTS networks and include the Wideband Code Division Multiple Access
(W-CDMA), CDMA2000 and Time Division
Synchronous CDMA(TD-SCDMA) techniques.
3G coverage and capacity planning is a planning methodology with two main objectives: (1) to provide coverage and capacity, so as to meet with the demand for acceptable QoS and (2) to maximize throughput.
This paper presents a novel approach for coverage and capacity planning for 3G CDMA based mobile radio
networks. The evaluation is performed using an enhanced-single agent system level simulator, supported by a monolithic architecture where data, processing and user interface all reside in the same system.
2. PROBLEM QUESTIONS
In this section, we start by posing the following questions 1) is CDMA uplink and downlink limited?
2) is CDMA capacity or coverage limited? 3) is CDMA noise or interference limited?
4) are tower mounted low-noise amplifiers of any benefit in CDMA voice or data applications?
Literature surveys and conversations with “experts” will reveal contradictory answers to each of these questions. Often, the answers are based on assumptions which are not always stated or even understood. Sometimes the answers are based on equipment limitations, rather than on any inherent limitations of CDMA [4]. In other cases, the answers are buried so deeply within mathematics that is unintelligible to the reader.
Planning of a CDMA network should consider both coverage and capacity to determine the values of each that provides the best support coverage and capacity of the objective traffic mix. Most 3G planning tools are based on some form of Monte Carlo planning simulation, although analytical approaches also exist. Theoretical calculations on coverage and capacity as in [5] may provide some hard bands on the usage values, but usually suffer from assumptions on ideal conditions such as the availability of spreading codes, no same cell interference or other cell interference, or perfect power control. The simulation-based approaches are more realistic.
In reality, the answer to each of these questions or problems is “it depends…”. The goal of this paper is to consider existing mathematical analysis of CDMA performance and present the results in a manner that allows system designers and network planners to understand how various system parameters affect the answers to the questions. The motivation for single agent simulation is to enable us present a generic structure that is adaptable for other scenarios. This approach minimizes the usually conflicting goals of coverage, capacity and QoS.
3. 3G NETWORK PLANNING
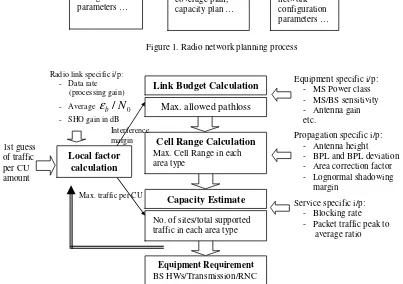
system dimension, as shown in Figure 1, is the main phase for detailed planning. A site survey is done about the designated coverage area, and possible sites for the setting up of the base stations are investigated. All data related to the geographical properties and the estimated traffic volumes at different points of the area are incorporated into a digital map, which consist of different pixels, each of which records all the information about this point. Based on the propagation model, the link budget is calculated, which helps to define the cell range and coverage threshold. The goal is to achieve as much coverage with the optimal, while also reducing the cost as
much as possible. Coverage and capacity planning are very essential in the entire radio network planning. Coverage planning determines the service range, while capacity planning determines the number of required base stations and their respective capacities. In the third phase, constant adjustments are made to improve the network planning. Here results are examined and refined until the best compromise between all the facts is achieved. The final radio plan is now ready for deployment in the designated coverage areas. This whole process is
[image:2.595.94.497.298.582.2]summarized in Figure 2.
Figure 1. Radio network planning process
Figure 2. Radio network dimensioning
4. MODEL PARAMETERS
The performance of any digital modulation technique can be described in terms of a normalized ratio of energy per
bit (
ε
b) to noise density (N0) required to achieve the minimum desired bit error ratio (BER) [6]. The relationship between this normalized value and the signal-to-noise ratio over the entire occupied bandwidth (S/N) is given by:W
N
R
N
S
b×
×
=
0
ε
Solving for
ε
b/N0, we have:×
=
R
W
N
S
N
b
0
ε
CDMA is a spread spectrum technique, which means that the occupied bandwidth (W) is much greater than the information bit rate (R). The ratio W/R then becomes a
factor by which the
0 N b
ε is improved over the full
bandwidth, S/N. The ratio W/R is known as the “processing gain”. For a given modulation technique,
Begin
Pre-Planning: Define network services, basic network configuration parameters …
Main Planning: Site survey, digital map, link budget, coverage plan, capacity plan …
Adjustment: Define network services, basic network configuration parameters …
End
Link Budget Calculation
Max. allowed pathloss
Cell Range Calculation
Max. Cell Range in each area type
Capacity Estimate
No. of sites/total supported traffic in each area type
Equipment Requirement
BS HWs/Transmission/RNC
Equipment specific i/p: - MS Power class - MS/BS sensitivity - Antenna gain etc.
Propagation specific i/p: - Antenna height
- BPL and BPL deviation
- Area correction factor
- Lognormal shadowing
margin
Service specific i/p: - Blocking rate - Packet traffic peak to
average ratio
Local factor calculation Radio link specific i/p:
- Data rate (processing gain)
- Average
ε
b/
N
0 - SHO gain in dBInterference margin
Max. traffic per CU
there is a minimum or threshold value of
0 N b
ε
(definedas
γ
t) required to achieve acceptable performance. Given a set of system design parameters, and knowing therequired
0 N b
ε
, the allowable pathloss can be calculated.In order to perform this analysis, the following parameters require definition:
t
γ
Required0
N
b
ε . This is defined by the
modulation technique and the detection method. A value of 9dB is typical for EIA/TIA-95 [7], or 7dB for EIA/TIA-95 with receive dual-diversity [8].
R User (traffic channel) data rate. For EIA/TIA-95
voice, this can be either 9600 or 14400 bps.
W Occupied bandwidth after spreading. For
EIA/TIA-95, this is 1.2288 MHz.
Pbts Composite base station transmit power per Radio Frequency (RF) channel. This is the combined total of all traffic, paging and synchronous channels at the antenna input, including the effects of cable loss on the tower.
χ
Percentage of base station power allocated totraffic channels; typically about 0.8 (80%).
Pmob Maximum mobile unit transmit power. This is the mobile transmit power when the power control parameter is set to maximum power.
NEbts Base station noise figure, including effects of cable loss.
NFmob Mobile unit noise figure, including the effects of receiver noise figure and environmental noise.
υ
Voice activity factor. CDMA systems canreduce self-interference by muting transmission during pauses in speech. This factor is the percentage of time the voice is active. Qualcomm uses 0.375 [8]; other more conservative treatments use 0.4 [9] to 0.67 [10]. The effective value is slightly higher on the downlink due to the need to send occasional power control bits, even during pauses in speech.
η
Loading factor. This is the ratio of “other cell” interference to “own cell” interference. It is 0 in the case of no mutual interference (isolated cells), and increases as cells overlap, and as mutual interference increases.η
= 0.65 is used as a typical value [8].Fr Frequency reuse factor. This is calculated from the loading factor as follows:
1/(1+
η
), orη
= (1/Fr) - 1. The value is 1 for no interference (isolated cells), and decreases as interference increases. Fr = 0.6 is used as a typical value [7 ].θ
Orthogonality factor. Downlink channels aretransmitted with codes that are orthogonal to one another, i.e., they are encoded for minimal mutual interference. Multipath propagation causes the downlink signal to be “smeared” in time, destroying some of this orthogonality. The orthogonality factor is the percentage of downlink orthogonality remaining at the mobile receiver. The value will be 1 for a perfect signal (no multipath) and near zero for a pure Rayleigh
fading environment. Typical values used ranges from 0.4 to 0.9 [11]
Gsho Soft-handoff gain. This is the downlink
improvement achieved by maximal ratio combination in the mobile unit of signals from multiple base stations. Typical values lie between 0.4 to 1.5 dB [12].
Csho Soft handoff capacity overhead. This is the percentage increase in the number of base station channels required to support subscribers in either two-way or three-way soft handoff. Typical designs allow for approximately 30% of the calls to be in soft handoff [4]; that is, 30% of the calls in process require channels from two, or in some cases three, base stations. Csho will be 0 if there is no soft handoff (isolated cells), and approximately 0.18 if 30% of calls are in soft handoff.
With knowledge of these parameters, one can compute, for a given number of users, the maximum allowed pathloss between the base station and mobile in both the uplink and downlink paths. Then, for a given set of antenna gains, propagation models and desired fading margins, the pathloss can be equated to a radius of coverage. In real world scenarios, however, particularly in urban areas, the desired results may be more evident in the elimination of coverage holes and reduction in unit power, followed by an increase in the coverage radius. For this reason, the results are generalized to the relationship between capacity and allowed pathloss, rather than coverage radius. Details of the calculations are presented in sections 5 and 6.
5. UPLINK CAPACITY/COVERAGE CALCULATION
In the uplink, the full bandwidth
N
S ratio is the received
power of the desired signal (
P
r), divided by the sum of thenoise over the full bandwidth (
N
0W
) and uplink interference from other users (I
ul) and is given by)
(
I
N
0W
P
N
S
ul r
+
=
(1)In CDMA cell with M users per channel, all occupying the same spectrum, the “same cell” interference is equal to the total power of the other (M-1) users. Uplink power control is used to keep all received signals balanced [12]; all
signals are received at the same level,
P
r. Therefore, the “same cell” interference power is:r
uls
M
P
I
=
(
−
1
)
×
(2)“Adjacent cell” interference is proportional to the “same cell” interference, accompanied by the loading factor (
η
):uls r
uls
ula
l
F
l
l
=
η
=
1
−
1
(3)where the loading factor has been expressed as a function
−
+
=
uls r lus ull
F
l
l
υ
(
1
1
)
(4)=
r r
F
P
M
1
)
(
−
υ
N
S
can then be expressed as+
−
=
W
N
F
P
M
P
N
S
r r r 0)
1
(
υ
(5)Converting this to
0
N
b
ε
(multiplying by the processing
gain) results in
R
W
W
N
F
P
M
P
N
o r r r o b×
+
−
=
)
1
(
υ
ε
(6)which must be >
r
tSolving for
P
r gives−
−
>
r t o t rF
M
R
W
W
N
P
1
υ
γ
γ
(7)On a dB scale, receive power is transmit power-pathloss
dB dBm
mob dBm
r
P
PL
P
( )=
( )−
(8)So, the maximum pathloss for a given number of users is:
−
−
=
−)
(
log
10
1 0 ) ( ) max( r M t R W t dBm mob dB ULF
W
N
r
P
PL
υ
γ
(9)The maximum theoretical capacity or “pole capacity”, is drowned by the point at which the denominator of the logarithm argument approaches zero. This is the maximum capacity possible as receive power approaches infinity and/or cell coverage shrinks to zero. This is given by
1
)
/
(
,=
+
υ
γ
t r pole ULR
W
F
M
(10)6. DOWNLINK CAPACITY/COVERAGE CALCULATION
The downlink calculation is similar to that of the uplink, with some exceptions. First of all, the interference term in Eq. (9) is scaled by a factor of (1-O) in the downlink path, where O is the “orthogonality factor”. Signals leave the base station with an orthogonality factor close to 1 in order to minimize channel to channel interference. The orthogonality factor used in the downlink coverage calculation reflects the proportion of orthogonality remaining by the time the signal completes its multipath propagation to the mobile unit.
A second difference between the two paths is that in the downlink, the per channel power is dependent on the number of users. All traffic channels share a total available power, which is divided evenly among the active users. If
χ
is the proportion of total power at the base stationantenna connector which is allocated to voice channels [13], then the transmit power per channel is
M
P
P
bts t×
=
χ
χ (11)
Thirdly, the capacity value (M) is scaled by the soft handoff overhead factor (Csho), which accounts for the extra base station channels needed to support mobiles in either two or three-way soft handoff. The effect is to replace M with M(1+Csho).
Finally, the soft handoff gain (Gsho) becomes a simple additive factor in the dB pathloss calculation.
Starting with Eq. (9), and incorporating these downlink specific changes, results in the following expression for maximum downlink pathloss.
sho r sho t R W t sho bts dB DL G F C M W N M C P PL + − − + − − + × = ) 1 ( 1 ) 1 ( log 10 ) 1 ( log 10 0 ) max( , θ υ γ γ χ (12)
Downlink pole capacity is determined by the point at which the denominator of the logarithm argument approaches zero:
1
)
1
)(
1
(
)
/
(
,+
+
−
=
sho t r pole DLC
R
W
F
M
θ
υ
γ
(13)7. PERFORMANCE ENHANCEMENT PARAMETERS
Not included in these calculations are the effects of sectorization, imperfect power control, or such techniques as smart antenna or multi-user detection. A spreadsheet tool with graphical output makes a useful tool for assessing system performance based on a customized set of system parameter and/or technology specific equations.
0
1
×
×
×
×
EV
−
−
−
−
D
SystemsWe will now re-direct our attention to CDMA-based high speed data systems, specifically to CDMA 2000
0
1×EV−D . Up to this point we have assumed voice-only systems, in which capacity requirements are defined by the number of users, which will be inherently the same for uplink capacity requirements, but are not necessarily the same and, in fact, may be highly asymmetric. Plotting uplink and downlink performance on the same graph is therefore of limited value. Not only is the uplink to downlink capacity ratio an unknown, but the nature of data services allows a soft degradation of service by limiting the data rate available to each other. For this reason, it is sufficient to treat uplink and downlink performance independently. In this discussion, we will focus on the uplink path only.
A sector of the total data throughput for a CDMA 2000 is given by [4] as:
− + − = − ) ( 1 1 1 0 1 sec ovhd avg t cp avg t b c
tor EG
N K f T R E N R
C ε ε
(14)
where
Csector total sector uplink throughput Rc chip rate (1.2288Mcps)
t cp
N
ε
pilot energy (per chip) to noise density ratio
seen at BTS
t b
N
ε
data energy (per chip) to noise density ratio
seen at BTS
E() expected value
f other-cell interference factor (typical value 0.68 [15])
Govhd 1+GDRC+GRRI+GDSC (Data Rate Control, Reverse Rate Indicator and Data Source Control) channel gains relative to pilot and
RoT is “Rise over Thermal”, which is the ratio of total power (uplink signals, interferers and noise) to thermal noise as seen at the base station front end [14]:
0 0 ) ( ) 1 (
N N E K f
RoT= + avg + (15)
0
1
×
EV
−
D
power control algorithms work to keept cp
N
ε
and
t b
N
ε
at the minimum necessary for
successful demodulation, resulting in a fixed RoT for a targeted coverage area and sector throughput.
8. SIMULATION AGENT IMPLEMENTATION AND RESULTS
[image:5.595.69.288.70.528.2]In this section, we present the simulation of a single agent: a monolithic architecture where data, processing and user interface all reside in the same system. This architecture is shown in figure 3.
Figure 3. A typical single agent
We encapsulate the processing data in the interface object using Visual Basic (VB) - an Object Oriented Programming Language (OOPL), suitable for both scientific and database applications. The agent allows for the fine-tuning of the input parameters. This attribute will enable network designers/planners to obtain an accurate design that is most efficient and reliable.
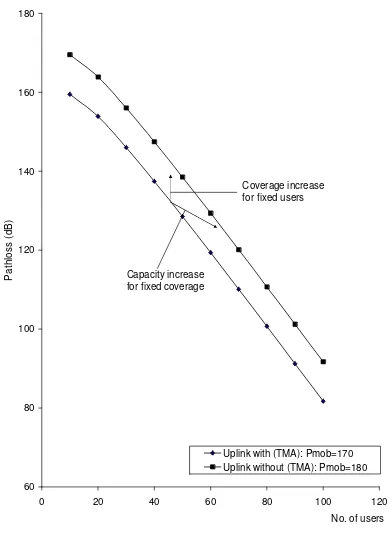
Shown in figure 4 is a graph of coverage vs. capacity for the uplink pathloss case. In this case, an 8dB station noise figure (5dB receiver noise figure, plus 3dB cable loss) results in a system in which both capacity and coverage are strictly limited.
Reducing the effective base station noise figure to 3dB through the use of tower top amplifier improves the uplink performance to the level described by the top curve. This arrow shows the amount of improvement achieved. This improvement can be viewed either as an increase in capacity for a fixed coverage area, or as a reduction in mobile transmit power for a given capacity/coverage communication.
60 80 100 120 140 160 180
0 20 40 60 80 100 120
No. of users
P
a
th
lo
s
s
(
d
B
)
Uplink with (TMA): Pmob=170 Uplink without (TMA): Pmob=180
Coverage increase for fixed users
[image:5.595.317.512.73.341.2]Capacity increase for fixed coverage
Figure 4. Uplink limited case
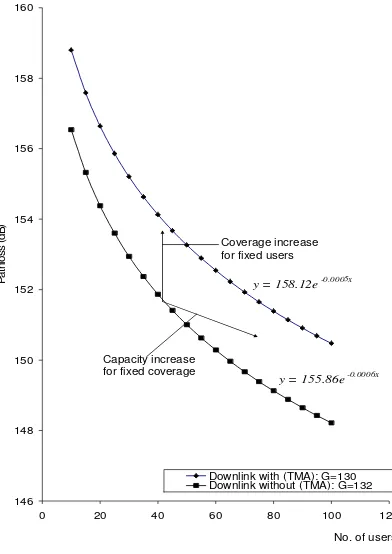
Figure 5 shows a graph of coverage and capacity combination for the downlink pathloss scenario. Unlike the uplink case, the figure shows a system in which the coverage is uplink limited, but the capacity is downlink limited. The coverage is limited by the uplink because of the maximum available transmitting power of the mobile; the downlink sets limitations on the capacity due to increasing interference (R) and (O).
Although the downlink limits the maximum capacity of the system, the graph shows that at a typical operating point, a TMA will still provide a significant coverage improvement for a given number of users. In addition to increasing the coverage possible at maximum mobile transmit power, this improvement also means that mobiles not at the edge of the cell will be able to maintain communication with less transmit power. This translates not only into longer battery for all users, but a potential increase in uplink coverage and capacity for adjacent cells, because of the reduction of inter-cell interference that occurs when mobile power is reduced.
Similarly, for a fixed coverage area, the addition of a TMA can provide an increase in capacity. The increase is likely to be somewhat less than was predicted in the uplink limited scenario. However, the increase can still be significant, again depending on the design parameters of the system. To enable the reader predict new empirical results, we fit exponential trend lines in the two plots. We observe here that both plots approximately decay at the same rate.
A graph of Rise over Terminal (RoT) vs. number of active users per sector is shown in Figure 6. As can be observed from this plot, RoT increases exponentially as the active users per sector increases. This implies that improved system capacity can be achieved in a network without any sacrifice of coverage or any increase in uplink transmit power. Hence, in order to increase sector throughput capacity, operation at higher of RoT is required. Although this can lead to instabilities in uplink power control loops;
Interface Processing Module Module
Input Output
however,
1
×
E
V
−
D
0
Revision A (RA) includes improvements to stabilize these algorithms, making operation at higher RoT more practical. An exponential trend line is also fitted in the plot to enable the reader predict new empirical results.146 148 150 152 154 156 158 160
0 20 40 60 80 100 120
No. of users
P
a
th
lo
s
s
(
d
B
)
Downlink with (TMA): G=130 Downlink without (TMA): G=132
y = 158.12e-0.0005x
y = 155.86e-0.0006x
Coverage increase for fixed users
[image:6.595.79.275.154.431.2]Capacity increase for fixed coverage
Figure 5. Downlink limited case
0 1 2 3 4 5 6 7 8
0 5 10 15 20 25 30 35
No. of active users per sector
R
o
T
(d
B
)
[image:6.595.318.516.231.490.2]y = 0.7046e0.0685x
Figure 6. A graph of RoT vs. number of users per sector
The graph depicted in figure 7 shows a sector throughput as a function of RoT, for a variable set of assumptions
regarding
0
N
b
ε
requirements as inter-cell interference
levels. If the RoT is allowed to rise proportionally to the reduction of noise figure, the graph shows the resulting increase uplink throughput that can be expected. Similarly,
a lower value of
N
0 means that the targeted0
N
ε
values can be achieved with a proportionally lower value of received energy. Therefore, in the original coverage area, all access terminals can operate with a proportionally lower uplink transmit power, thus reducing the inter-cell interference levels.
0 500 1000 1500 2000 2500
0 5 10 15 20 25 30
RoT(dB)
T
h
ro
u
g
h
p
u
t
(k
b
p
s
)
3dB
4dB
5dB
6dB
Figure 7. A graph of sector throughput vs. RoT
9. CONCLUSION
Efficient network planning is a vital aspect of 3G networks. Key differences arise between 2G and 3G networks due to the different levels of service offered. By identifying and analyzing the relationships between capacity, coverage and quality of service from our study and through a single agent based simulation with a graphical presentation of results, we observe that in CDMA systems, coverage and capacity are tightly coupled and can not be planned separately, such as they could in 2G systems. Furthermore, a test case result is shown to demonstrate the effect of a tower mounted low noise amplifier (TMA) in either increased CDMA 2000
0
1×EV−D uplink throughput, or in reduced transmit power and increase coverage. The results and analysis in this work can be used in cellular system planning to set strict limits on the maximum number of users that can be admitted into the cell. For example, the pre-specified coverage requirements are met. It is also useful in planning a cellular network to design cell coverage and capacities to match specified data services.
[image:6.595.77.272.462.710.2]While CDMA technology can itself provide enough codes for the mobile terminals to assure the ideal situation (enough for every user, therefore there is no blocked call) these are not used in practice. In application, the network operators take into account the cost of equipment (which is related to the number of codes used) and the network load. They use Erlang B to assure certain grade of service. To overcome the shortcomings of the modeling presented herein, in future work we would need to consider the outage probability and the loading control in the planning process. An analysis considering outage probability and cell loading will give a more accurate relationship between the coverage and capacity.
10. REFERENCES
[1] 3GPP: http://www.3gpp.org
[2] 3GPP: Technical Specification Group Services and Systems Aspects: Network Architecture V 3.5.0 (Release 1999). 3GPP TS-TS 23.002, 2002.
[3] Third Generation Partnership Project: Technical Specification Group Radio Access Networks; RF System Scenarios (Release 5).
[4] N. Bhushan, L. Chriss, B. Peter, A. Rashid, J. Yu-Cheun, F. Mingxi, G. Donna and A. Jean, “CDMA2000 1xEV-DO Revision A: A Physical
Layer and MAC Layer Overview”, IEEE
Communications Magazine, 44, 2006.
[5] L. Suo, J. Zhang, J. Maple, and M. Carsten, “Coverage and Capacity Calculations for 3G
Mobile Network Planning,” In proc.
PGNET2003, June 16-17, Liverpool, UK, 2003. [6] A. Miceli, and B. Spann, “Maximizing CDMA Capacity with Antenna and Infrastructure
Improvements”, Antenna Systems &
Technology, May/June, 2002.
[7] M. Salkola, “CDMA Capacity – Can You
Super-size That?” IEEE Wireless
Communications and Networking Conference, 2002.
http://www.suptech.com/pdf/WCNC_paper.pdf
[8] F. Ramon and P. Díaz, “On hard/soft handoff and macrodiversity in a CDMA mobile system”, 1999.
http://www.gcr.tsc.upc.es/publications/proceedin gs/1999/On_hard_soft_handoff_macrodiversity_ CDMA.pdf
[9] S. Park and D. K. Sung, “Orthogonal Code Hopping Multiplexing for Downlink in Spread Spectrum Communications” Conference on Multi-Dimensional Mobile Communications, Pori, Finland, 2001.
http://cnr.kaist.ac.kr/~spark/MDMC2001_OCH M.pdf
[10] V. Garg, S. Kenneth and J. Wilkes, Applications
of CDMA in Wireless/Personal
Communications, Prentice-Hall, 1997.
[11] H. Holma, Z-C. Honkasalo, S. Hämäläinen, J. Laiho-Steffens, K. Sipilä and A. Wacker, “Radio
Network Planning”, WCDMA for UMTS
(Chapter 8), ed. H. Holma and A. Toskala, John
Wiley and Sons, 2000.
http://lib.hut.fi/Diss/2002/isbn9512259028/articl e4.pdf
[12] J. Isabona, A. Bede and M. Ekpenyong,
“Transmit Power Management Technique For Wireless Communication Networks”, Georgian Electronic Scientific Journal: Computer Science and Telecommunication, 2 (16), 2008, pp. 93-98.
[13] K. S. Gilhousen, I. M. Jacobs, R. Padovani, A. J. Viterbi, L. A. Weaver and C. E. Wheatley. “On the Capacity of a Cellular CDMA System”, IEEE Transactions on Vehicular Technology, 40 (2), 1991.
[14] Y. Tokgoz, M. Fan and J. E. Smee “On the Reverse Link Performance of the CDMA2000 1xEVDO Revision: A System with Antenna Array Receivers”, IEEE Globecom, 2005. [15] M. Fan, G. Donna, B. Naga, A. Rashid, L. Chris
and A. Jean. “On the Reverse Link Performance of CDMA2000 1x EV-DO Revision A System”,
IEEE International Conference on
Communications, 2005.