The geography of high value biodiversity areas for terrestrial vertebrates in Western Europe and their coverage by protected area networks
9
0
0
Texto completo
(2) 66. M. J. T. Assunção-Albuquerque et al.: Geography of high-value biodiversity areas for terrestrial vertebrates. economic and cultural aspects rather than by biological factors (Margules and Sarkar, 2007). Global biological diversity studies indicate that at least 12 % of vertebrate species are not included in any protected area network, and half of the important sites for biodiversity conservation remain unprotected. Therefore, established protected areas have to be complemented with new reserves incorporating the objectives of representativeness and persistence (Rodrigues et al., 2004; Butchart et al., 2012), along with the key concepts of complementarity, irreplaceability and vulnerability, in order to prevent the loss of unique biodiversity (Rodrigues et al., 2004; Sarkar et al., 2006). To accomplish this, it is fundamental to identify how well biodiversity is represented by current protected area networks (Margules and Pressey, 2000; Maxted et al., 2008), the socalled gap analysis. The concept of gap analysis was first described by Burley (1988) as “gaps of conservation” by identifying and classifying various elements of biological diversity (e.g. major ecosystems or species) and determining which elements are poorly represented in the current network of protected areas. There are several gap analysis studies supporting that different taxa are underrepresented in protected area networks at the global (Rodrigues et al., 2004; Jenkins and Joppa, 2009) and continental or country scales (Rey Benayas and de la Montaña, 2003; Rey Benayas et al., 2006; Araújo et al., 2007; Maiorano et al., 2007; Wiersma and Nudds, 2009). Here we explore how well vertebrate taxa (amphibians, reptiles, birds, and mammals) are represented in the protected areas of Western Europe. Our goals are two-fold: firstly, to investigate the distribution of high-value biodiversity areas (HVBAs) for the four vertebrate taxa in Europe; and secondly, to analyse to what extent the current protected area network represents the HVBAs of this region. 2 2.1. Methods Data. Distribution maps for reptile, amphibian, breeding bird, and mammal species were obtained from Gasc et al. (1997), Hagemeijer and Blair (1997) and Mitchell-Jones et al. (1999). The presence of 52 amphibian, 106 reptile, 471 bird, and 142 mammal species was recorded in each cell of an UTM grid comprising 2195 cells of 50 × 50 km, and the species richness of each vertebrate group was obtained for each cell. Marine species as well as all cells with less than 50 % inland cover and all islands except Great Britain were excluded from the analysis. We used maps resulting from the World Database on Protected Areas (WDPA) and the NATURA 2000 network to represent the percentage of protected area within each UTM cell. The WDPA database (version 2010) is the most comprehensive global spatial dataset on marine and terrestrial protected areas available and includes all nationally desigWeb Ecol., 12, 65–73, 2012. nated (e.g. national parks) and internationally recognized protected areas (WDPA, IUCN and UNEP-WCMC, 2010) except, unfortunately, those of Great Britain, which is part of our study region. The NATURA 2000 is an ecological network of protected areas that aims to protect biodiversity in Europe and is composed of sites designated under the Birds Directive (Special Protection Areas, SPA) and the Habitats Directive (Sites of Community Importance, SCIs, and Special Areas of Conservation, SACs) of the European Union. The European database on NATURA 2000 sites was obtained from the European Environmental Agency (EEA, 2009) (available at http://www.eea.europa.eu/data-and-maps/data/ natura-2000). We used Kernel density plots to investigate the percentage of UTM cells included in the WDPA, NATURA 2000, and the combined protected area networks. The Kernel density plot is considered a smoother version of a histogram and estimates the probability density rather than breaking the counts into discrete categories (Scott, 1992; Faraway, 2006). 2.2. Criteria for identifying high-value biodiversity areas. Areas of high-value biodiversity (HVBAs) for each taxon ( j) were identified by using the combined biodiversity index (CBI) proposed by Rey Benayas and de la Montaña (2003). This index integrates species richness, rarity and vulnerability, and corresponds to the following formula: CBI=. sj X (1/ni )vi . i=1. In this index, species richness is implicit in. Sj P. , where sj. i=1. defines the number of species in taxa j; rarity for a particular species is calculated as the inverse of the number of cells where the species is present (1/ni), and vulnerability (vi) is computed on the basis of standard vulnerability categories of species present in the cell. Specifically, for this we used the International Union for Conservation of Nature Red List of Threatened species Version 2010.4 (IUCN, 2010), which defines the following vulnerability categories: least concerned (595 species; vi = 1), data deficient (two species; vi = 2), near threatened (53 species; vi = 3), vulnerable (110 species; vi = 4), endangered (nine species; vi = 5), critically endangered (two species; vi = 5). Assunção-Albuquerque et al. (2012) provides maps showing the geographical pattern of species richness, rarity, vulnerability, and combined biodiversity index for the four taxonomic groups in the study area based on the grid cells used in this study. We also computed the standardized biodiversity index (SBI, Rey Benayas and de la Montaña, 2003) by dividing the combined index of biodiversity of each vertebrate group in every cell by its mean across all cells (m j ). The SBI formula is. www.web-ecol.net/12/65/2012/.
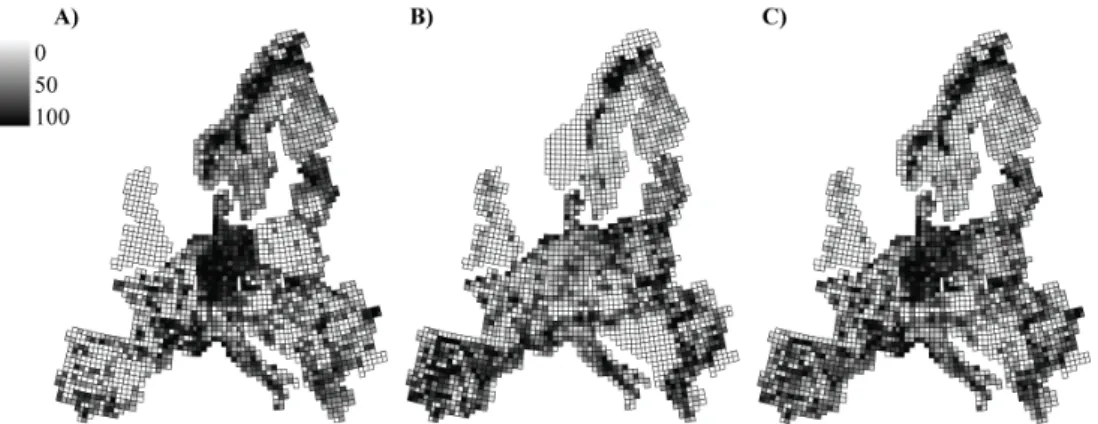
(3) M. J. T. Assunção-Albuquerque et al.: Geography of high-value biodiversity areas for terrestrial vertebrates. 67. Figure 1. Proportions of protected areas included in the World Database on Protected Areas (A), the NATURA 2000 network (B) and both Figure 1. networks combined (C) in 50 × 50 km UTM grid cells covering continental Western Europe and Great Britain. The grey scale indicates the percentage of protected area in each cell.. SBI=. 4 X. CBI j / m j .. j=1. Once every cell was assigned a CBI value for each taxon, we used ArcGIS 9.3 to compute the G∗ spatial statistics (Getis and Ord, 1992) and thus identify CBI-based HVBAs for each taxon. This technique allows the identification of cells with higher CBI value than randomly expected by comparing the value for a given observation with locations in the neighbourhood, thus providing an explicit consideration of space (Getis and Ord, 1992; Nelson and Boots, 2008). We also applied this technique to SBI values and thus calculate HVBAs for all taxa together. 2.3. Gap analysis. To investigate how well current protected areas represent high-value diversity areas for the four vertebrate groups across Europe, the maps of HVBAs and the maps of protected area networks (WDPA, NATURA 2000 and the combined networks) were overlapped. Then, the percentage of protected area networks in each grid cell was calculated. Those cells containing HVBAs but not protected areas were considered full gaps. 3 3.1. Results. (r = 0.37, p < 0.0001), and the networks showed contrasted distributions of cells with high cover of protected areas. In the case of the WDPA, these cells were found mainly in Central Europe (Germany), west Fennoscandia24 and in the Alps (Fig. 1a), whereas for the NATURA 2000 network they occurred more frequently in Sweden, northern Poland and especially across the Mediterranean basin (Fig. 1b). These results indicate that both networks complement each other to some extent, so that regions with low coverage of protected areas in one network are sometimes well represented in the other (e.g. while the Iberian Peninsula is poorly covered by the WDPA, it shows a dense representation of NATURA 2000 areas), as indicated in the combined map shown in Fig. 1c. Considering all cells, Kernel density plots of the percentage protected area within cells covered by the WDPA and NATURA 2000 networks indicated that most cells included a small proportion of protected areas. For instance, 1800 (81.9 %) and 1805 (82.2 %) cells had less than 20 % of their area included in such networks, respectively (Fig. 2a, b), including 407 and 307 cells with no coverage at all of such networks, respectively. The percentage of cells with less than 20 % of their area included in the combined network was 64 % or 1484 cells (Fig. 2c). Similarly, most of HVBA cells included a small proportion of protected areas: 442 (82.3 %) and 357 (68.1 %) of them included less than 20 % of WDPA and NATURA 2000 cover, respectively (Fig. 2d, e), whereas 305 (58.2 %) has less than 20 % of combined network cover (Fig. 2f). The summing of protected land percentages across all the HVBA cells was 28.8 %.. Spatial distribution of protected areas. WDPA and NATURA 2000 protected areas occurred in 1758 and 1889 cells, respectively, which represent 80.1 % and 86.1 % of the cells included in the study region (Fig. 1). A total of 1541 cells contained both networks, whereas only 89 cells did not include any protected area. The correlation between the percentage cover of protected areas according to WDPA and NATURA 2000 was highly significant but weak www.web-ecol.net/12/65/2012/. 3.2. Geographical distribution of high-value biodiversity areas and gap analysis. A total of 729 cells were identified as HVBAs according to the combined index of biodiversity. These cells included between 74.5 % of reptiles – the least favoured species – and 91.5 % of mammals – the most favoured group. Of Web Ecol., 12, 65–73, 2012.
(4) 68. M. J. T. Assunção-Albuquerque et al.: Geography of high-value biodiversity areas for terrestrial vertebrates. Figure 2. Kernel density plots showing the relative frequency of 50 × 50 km UTM grid cells that include a particular percentage of protected Figure 2. area for all cells in the study area (A, B, C) and those cells identified as high-value biodiversity areas only (D, E, F) according to the World Database on Protected Areas network (A, D), the NATURA 2000 network (B, E), and the combined map comprising both networks (C, F).. all not included species, one (Pelodytes caucasicus), four (Phyllodactylus europaeus, Lacerta bonnali, Lacerta derjugini, Vipera kaznakovi), four (Polysticta stelleri, Tetrao mlokosiewiczi, Colinus virginianus, Sitta krueperi), and one (Bison bonasus) were near-threatened or threatened amphibian, reptile, bird, and mammal species, respectively. The distribution of these HVBA cells (Fig. 3a–d) indicated that most of them were located in the Mediterranean region, especially in Iberia and the Balkans. Secondary clusters of HVBA cells were also observed in the Alps for mammals, and at various more or less isolated spots for the rest of the groups. NATURA 2000 network included a higher number of HVBA cells for the four taxonomic groups (660 cells, 90.5 %) than the WDPA network (584 cells, 80.1 %). The 660 NATURA 2000 cells included 93.1 % of amphibian, 86.7 % of reptile, 92.8 % of bird, and 89.1 % of mammal species, whereas the 584 WDPA cells included 79.3 % of amphibian, 86.7 % of reptile, 78.8 % of bird, and 78.4 % of mammal species. Across all four vertebrate groups, 145 gap cells (19.9 %) according to the WDPA network, 69 gap cells (9.5 %) according to the NATURA 2000 network, and 7 gap cells (3 %) according to the combined network were identified. These full gaps mainly occurred in areas of the Mediterranean basin (particularly in Iberia and the Balkans regions), although for birds they were also present in localized areas of southern England and Scotland (Fig. 3a–d). The lowest numWeb Ecol., 12, 65–73, 2012. ber of gap cells was observed for reptiles in the WDPA net- 25 work (16 cells, 13.3 %), amphibians in the NATURA 2000 network (12 cells, 6.9 %), and amphibians in the combined network (one cell, 0.6 %); on the other side, the highest number of gap cells was observed for mammals in the WDPA network (55 cells, 21.6 %), reptiles in the NATURA 2000 network (16 cells, 13.3 %), and mammals in the combined network (16 cells, 6.3 %) (Table 1). The standardized biodiversity index that integrated all taxa simultaneously produced a total of 226 HVBA cells (Table 1), which included 83 % of amphibian, 75 % of reptile, 88 % of bird, and 91 % of mammal species. Of the not included species, 9 (17 %), 26 (24 %), 54 (11 %) and 12 (8 %) were threatened amphibian, reptile, bird, and mammal species, respectively. Most of these HVBA cells were located in the Mediterranean region (Fig. 3e). From these, a total of 7 cells (3 %) did not include any protected area and were thus considered full gaps (Table 1).. 4. Discussion. This study identified the geographic location of high-value biodiversity areas for amphibians, reptiles, birds and mammals across Western Europe using different biodiversity criteria (richness, rarity, vulnerability), and pursued to assess www.web-ecol.net/12/65/2012/.
(5) M. J. T. Assunção-Albuquerque et al.: Geography of high-value biodiversity areas for terrestrial vertebrates. 69. Figure 3 Figure 3. Distribution of cells representing high-value biodiversity areas for amphibians (A), reptiles (B), birds (C), mammals (D), and all. taxa together (E) across continental Western Europe and Great Britain. Colors differentiate between high-value biodiversity area cells that contain protected areas included in both the World Database on Protected Areas and the NATURA 2000 network (black) from those cells that represent full gaps with respect to either the World Database on Protected Areas (blue), the NATURA 2000 network (green), or both networks combined (red). Table 1. Summary of results on the amounts of (1) cells comprising HVBAs for the species of four vertebrate groups (based on combined. biodiversity index values obtained for each group; see Methods) and for all species (based on standardized biodiversity index values); (2) species occurring in HVBA cells; and (3) HVBA cells not included in the WDPA, NATURA 2000 and combined protected area networks (i.e. gap cells). Species group (and biodiversity index). HVBA cells. Species in HVBA cells. HVBA cells excluded from protected area networks WDPA. Amphibians (CBI) Reptiles (CBI) Birds (CBI) Mammals (CBI) All species (SBI). 174 120 180 255 226. 47 (90.4 %) 79 (74.5 %) 417 (88.5 %) 130 (91.5 %) 603 (78.2 %). how well these HVBAs are covered by two major networks of protected areas, namely WDPA and NATURA 2000. We found that HVBA cells for the four vertebrate groups were mostly distributed across the Mediterranean basin, which agrees with previous results that support the Mediterranean area as being one of the most biodiverse European regions (Araújo et al., 2007) and a relevant biodiver-. www.web-ecol.net/12/65/2012/. 36 (20.7 %) 16 (13.3 %) 38 (21.1 %) 55 (21.6 %) 39 (17.3 %). NATURA 2000. Combined. 12 (6.9 %) 16 (13.3 %) 13 (7.2 %) 28 (10.9 %) 16 (7.1 %). 1 (0.6 %) 2 (1.7 %) 3 (1.7 %) 16 (6.3 %) 7 (3.0 %). sity hotspot at global scale (Myers et al., 2000; Shi et al., 2005; Blondel et al., 2010; Eklund et al., 2011). In agreement with our findings, Araújo and Pearson (2005) identified several relevant priority areas for amphibian and reptile species in the Mediterranean basin, and Rey Benayas and de la Montaña (2003) and Nogués-Bravo and Martı́nez Rica (2004) did the same for amphibian and mammal species. Web Ecol., 12, 65–73, 2012. 26.
(6) 70. M. J. T. Assunção-Albuquerque et al.: Geography of high-value biodiversity areas for terrestrial vertebrates. in Spain. In contrast with this key importance of the Mediterranean basin for biodiversity conservation, this region has been reported as being highly disturbed and with ongoing strong biodiversity losses (Myers et al., 2000; Maiorano et al., 2006). Moreover, previous evaluations of the effectiveness of the protected area networks in the Mediterranean basin have been limited to only some taxonomic groups and areas such as the Iberian (Martı́n-Piera, 2001; Carrascal and Lobo, 2003; Lobo and Araújo, 2003; Rey Benayas and de la Montaña, 2003; Araújo, 2004; Martı́nez et al., 2006; Araújo et al., 2007) and the Italian (Maiorano et al., 2006) peninsulas. Thus, the present study is a valuable effort to evaluate how well the terrestrial vertebrate diversity of this region, as well as Western Europe as a whole, is covered by protected area networks. Previously, Araújo et al. (2011) performed an assessment at the European scale under climate change conditions. There is some overlap in the coverage of both WDPA and NATURA 2000 networks (Fig. 1); however, we found that WDPA is more densely represented in Central and Northern Europe and NATURA 2000 in the Mediterranean basin. So, both networks are complementary to some extent in protecting Western European biodiversity, which makes conservation efforts easier. Although WDPA intends to be the most comprehensive global spatial dataset on marine and terrestrial protected areas available, it does not cover Great Britain, and, additionally, our results showed gaps of ≥ 13.3 % of the HVBA cells for the various taxonomic groups (see Table 1). These figures are consistent with the results of Rodrigues et al. (2004), who concluded that WDPA is far from accomplishing its conservation goals. Also, Chape et al. (2003), Catullo et al. (2008) and Gallo et al. (2009) support that WDPA is not adequate for biological conservation purposes. NATURA 2000 includes a higher number of HVBA cells for all taxa than WDPA because it spreads over more cells, and therefore this result is expected by chance (Table 1). This agrees with previous studies that found that this network best represented vertebrate species across various European areas (Rey Benayas et al., 2006; Martı́nez et al., 2006; Araújo et al., 2007; Gaston et al., 2008). However, coverage by natural protected areas does not completely guaranty the enhancement of the conservation status of particular species at particular sites (Rey Benayas and de la Montaña, 2003). Further, although NATURA 2000 has a greater coverage than WDPA, the degree of protection of NATURA 2000 may be actually lower than other types of protected areas as a wide range of human activities are allowed in the former. Our results also highlighted that the highest number of absolute cell gaps of HVBAs was observed for mammal species (16 of cells in the combined network of protected areas). Many mammal species are facing population declines and are, or will be soon, under the risk of extinction (Cardillo et al., 2004; Rondinini et al., 2011; Visconti et al., 2011). Moreover, one fourth of mammal species are globally threatened or extinct (Vié et al., 2009), and the representation of Web Ecol., 12, 65–73, 2012. mammals in protected areas is far from being complete, as reported by Rodrigues et al. (2004) for the Globe, Catullo et al. (2008) for Southeast Asia, and Albuquerque et al. (2011) for the Brazilian Atlantic Forest Biosphere Reserve. Thus, extra efforts are required to ensure mammal species conservation, especially for those not included in protected areas. More than a debate on how to tackle conservation strategies, there is agreement that more land should be protected quickly, and that this protection should be expanded off reserve (Mawdsley et al., 2009; Heller and Zavaleta, 2009). On one hand, other strategies outside protected areas such as land stewardship or voluntary programs targeting native species and habitats on private, working landscapes or private land conservation could act as a framework for safeguarding biodiversity (Cox and Underwood, 2011). On the other hand, to assess future conservation strategies, it should be considered that biodiversity values are not static in time and that climate change represents a crucial potential threat for the future protected areas’ effectiveness (Hannah et al., 2007). Since climate change may cause shifts in species distribution range, rigorously defined networks of protected areas may play a key role in mitigating the negative impacts of climate change on biodiversity (Hole et al., 2009). We conclude that existing networks of protected areas in Western Europe include most but not all areas that were identified as highly valuable for vertebrate diversity, and that more efforts are necessary to complete the current natural protected networks, particularly for the Mediterranean basin and mammal species. Identifying gaps in the inclusion of high-value biodiversity areas and species representation in protected areas is a critical issue to assess so that future conservation strategies assure species preservation.. Acknowledgements. This research was supported by the. Spanish Ministry of Science and Innovation (grants CGL201018312 to JMRB, and CGL2010-22119 to MAR), and the Madrid Government REMEDINAL project (S2009AMB-1783). M. J. T. Assunção-Albuquerque was supported by the Brazilian Ministry of Education, through CAPES (Coordenação de Aperfeiçoamento de Pessoal de Nı́vel Superior) Doctorate scholarship and FSA was supported by BIOTREE-net-project funded by BBVA Foundation. We are indebted to two anonymous reviewers that greatly improved a former version of this manuscript. Edited by: D. Nogués-Bravo Reviewed by: D. Alagador and one anonymous referee. References Albuquerque, F., Assunção-Albuquerque, M. J. T., Cayuela, L., Gálvez-Bravo, L., Rueda, M., and Rey Benayas, J. M.: Identification of Critical Areas for Mammal Conservation in the Brazilian Atlantic Forest Biosphere Reserve, Nat. Conservacao, 9, 1–6, 2011.. www.web-ecol.net/12/65/2012/.
(7) M. J. T. Assunção-Albuquerque et al.: Geography of high-value biodiversity areas for terrestrial vertebrates Araújo, M. B.: Matching species with reserves – uncertainties from using data at different resolutions, Biol. Conserv., 118, 533–538, 2004. Araújo, M. B. and Pearson, R. G.: Equilibrium of species distributions with climate, Ecography, 28, 693–695, 2005. Araújo, M. B, Lobo, J. M, and Moreno, J. C.: The Effectiveness of Iberian Protected Areas in Conserving Terrestrial Biodiversity, Conserv. Biol., 21, 1423–1432, 2007. Araújo, M. B., Alagador, D., Cabeza, M., Nogués-Bravo, D., and Thuiller, W.: Climate change threatens European conservation areas, Ecol. Lett., 14, 484–492, 2011. Assunção-Albuquerque, M. J. T., Rey Benayas, J. M., Rodrı́guez, M. Á., and Albuquerque, F. S.: Geographic patterns of vertebrate diversity and identification of relevant areas for conservation in Europe, Animal Biodiversity and Conservation, 35.1, 1– 11, 2012. Blondel, J., Aronson, J., Boudiou, J. Y., and Boeuf, G.: The Mediterranean Basin – biological diversity in space and time, Oxford, UK, Oxford University Press, 2010. Branquart, E., Verheyen, K., and Latham, J.: Selection criteria of protected forest areas in Europe: the theory and the real world, Biol. Conserv., 141, 2795–2806, 2008. Burley, F. W.: Monitoring biological diversity for setting priorities in conservation, in: Biodiversity, edited by: Wilson, E. O., National Academy Press, Washington, DC, 227–230, 1988. Butchart, S. H. M., Walpole, M., Collen, B., van Strien, A., Scharlemann, J. P. W., Almond, R. E. A., Baillie, J. E. M., Bomhard, B., Brown, C., Bruno, J., Carpenter, K. E., Carr, G. M., Chanson, J., Chenery, A. M., Csirke, J., Davidson, N. C., Dentener, F., Foster, M., Galli, A., Galloway, J. N., Genovesi, P., Gregory, R. D., Hockings, M., Kapos, V., Lamarque, J.-F., Leverington, F., Loh, J., McGeoch, M. A., McRae, L., Minasyan, A., Hernández Morcillo, M., Oldfield, T. E. E., Pauly, D., Quader, S., Revenga, C., Sauer, J. R., Skolnik, B., Spear, D., Stanwell-Smith, D., Stuart, S. N., Symes, A., Tierney, M., Tyrrell, T.D., Vié, J-C., and Watson, R.: Global biodiversity: Indicators of recent declines, Science, 328, 1164–1168, 2010. Butchart, S. H. M., Scharlemann, J. P. W., Evans, M. I., Quader, S., Aricò, S., Arinaitwe, J., Balman, M., Bennun, L. A., Bertzky, B., Besançon, C., Boucher, T. M., Brooks, T. M., Burfield, I. A., Burgess, N. D., Chan, S., Clay, R. P., Crosby, M. J., Davidson, N. C., De Silva, N., Devenish, C., Dutson, G. C. L., Fernández, D. F. D., Fishpool, L. D. C., Fitzgerald, C., Foster, M., Heath, M. F., Hockings, M., Hoffmann, M., Knox, D., Larsen, F. W., Lamoreux, J. F., Loucks, C., May, I., Millett, J., Molloy, D., Morling, P., Parr, M., Ricketts, T. H., Seddon, N., Skolnik, B., Stuart, S. M., Upgren, A., and Woodley, S.: Protecting Important Sites for Biodiversity Contributes to Meeting Global Conservation Targets, PLoS ONE, 7, e32529, doi:10.1371/journal.pone.0032529, 2012. Cardillo, M., Purvis, A., Sechrest, W., Gittleman, J. L., Bielby, J., and Mace, G. M.: Human population density and extinction risk in the world’s carnivores, PLoS Biol., 2, 909–914, 2004. Carrascal, L. M. and Lobo, J. L.: Respuestas a viejas preguntas con nuevos datos: estudio de los patrones de distribución de la avifauna española y consecuencias para su conservación, 645– 662 y 718–721, in: Atlas de las Aves Reproductoras de España, edited by: en Martı́, R. and Del Moral, J. C., Dirección General de la Conservación de la Naturaleza-Sociedad Española de Orni-. www.web-ecol.net/12/65/2012/. 71. tologı́a, Madrid, 2003. Catullo, G., Masi, M., Falcucci, A., Maiorano, L., Rondinini, C., and Boitani, L.: A gap analysis of Southeast Asian mammals based on habitat suitability models, Biol. Conserv., 141, 2730– 2744, 2008. Cayuela, L., Rey Benayas, J. M., Justel, A., and Salas-Rey, J.: Modelling tree diversity in a highly fragmented tropical montane landscape, Global Ecol. Biogeogr., 15, 602–613, 2006. Chape, S., Fish, L., Fox, P., and Spalding, M.: United Nations list of protected areas, IUCN/UNEP, Gland Switzerland/Cambridge, UK, 2003. Cox, R. L. and Underwood, E. C.: The importance of conserving biodiversity outside of protected areas in Mediterranean ecosystems, PLoS ONE, 6, e14508, doi:10.1371/journal.pone.0014508, 2011. Dı́az-Páez, H. and Ortiz, J. C.: Evaluación del estado de conservación de los anfibios en Chile, Revista chilena de historia natural, 76, 509–525, 2003. EEA: Agencia Europea de Medio Ambiente, http://www.eea. europa.eu/es/themes/landuse/contentbytype?contenttype= Document, last access: 18 August 2009. Eklund, J., Arponen, A, Visconti, P., and Cabeza, M.: Governance factors in the identification of global conservation priorities for mammals, Phil. Trans. R. Soc. B, 366, 2661–2669, 2011. Faraway, J. J.: Extending the linear model with R: generalized linear, mixed effects and nonparametric regression models, Chapman & Hall/CRC Taylor & Francis Group, Boca Raton, FL, 331 pp., 2006. Gallo, J. A., Pasquini, L., Reyers, B., and Cowling, R. M.: The role of private conservation areas in biodiversity representation and target achievement within the Little Karoo region, South Africa, Biol. Conserv., 142, 446–454, 2009. Gasc, J. P., Cabela, A., Crnobrnja-Isailovic, J., Dolmen, D., Grossenbacher, K., Haffner, P., Lescure, J., Martens, H., Martı́nez Rica, J. P., Maurin, H., Oliveira, M. E., Sofianidou, T. S., Veith, M., and Zuiderwijk, A.: Atlas of amphibians and reptiles in Europe. Collection Patrimoines Naturels 29, Societas Europaea Herpetologica, Muséum National d’Histoire Naturelle & Service du Petrimone Naturel, Paris, 1997. Gaston, K. J., Chown, S. L., and Evans, K. L: Ecogeographical rules: elements of a synthesis, J. Biogeogr., 35, 483–500, 2008. Getis, A. and Ord, J. K.: The Analysis of Spatial Association by Use of Distance Statistics, Geogr. Anal., 24, 189–206, 1992. Hagemeijer, E. J. M. and Blair, M. J.: The EBCC Atlas of European Breeding Birds: Their Distribution and Abundance, T & AD Poyser, Londres, 1997. Hannah, L., Midgley, G., Andelman, S., Araujo, M., Hughes, G., Martinez-Meyer, E., Pearson, R., and Williams, P.: Protected area needs in a changing climate, Front. Ecol. Environ., 5, 131–138, 2007. Hanski, I. and Walsh, M.: How Much, How To? – Practical Tools for Forest Conservation, BirdLife European Forest Task Force, 2004. Heller, N. E. and Zavaleta, E. S.: Biodiversity management in the face of climate change: A review of 22 years of recommendations, Biol. Conserv., 142, 14–32, 2009. Hoffmann, M., Hilton-Taylor, C., Angulo, A., Böhm, M., Brooks, T. M., Butchart, S. H., Carpenter, K. E., Chanson, J., Collen, B., Cox, N. A., Darwall, W. R., Dulvy, N. K., Harrison, L. R.,. Web Ecol., 12, 65–73, 2012.
(8) 72. M. J. T. Assunção-Albuquerque et al.: Geography of high-value biodiversity areas for terrestrial vertebrates. Katariya, V., Pollock, C. M., Quader, S., Richman, N. I., Rodrigues, A. S., Tognelli, M. F., Vié, J. C., Aguiar, J. M., Allen, D. J., Allen, G. R., Amori, G., Ananjeva, N. B., Andreone, F., Andrew, P., Aquino Ortiz, A. L., Baillie, J. E., Baldi, R., Bell, B. D., Biju, S. D., Bird, J. P., Black-Decima, P., Blanc, J. J., Bolaños, F., Bolivar, G. W., Burfield, I. J., Burton, J. A., Capper, D. R., Castro, F., Catullo, G., Cavanagh, R. D., Channing, A., Chao, N. L., Chenery, A. M., Chiozza, F., Clausnitzer, V., Collar, N. J., Collett, L. C., Collette, B. B., Cortez Fernandez, C. F., Craig, M. T., Crosby, M. J., Cumberlidge, N., Cuttelod, A., Derocher, A. E., Diesmos, A. C., Donaldson, J. S., Duckworth, J. W., Dutson, G., Dutta, S. K., Emslie, R. H., Farjon, A., Fowler, S., Freyhof, J., Garshelis, D. L., Gerlach, J., Gower, D. J., Grant, T. D., Hammerson, G. A., Harris, R. B., Heaney, L. R., Hedges, S. B., Hero, J. M., Hughes, B., Hussain, S. A., Icochea, M. J., Inger, R. F., Ishii, N., Iskandar, D. T., Jenkins, R. K., Kaneko, Y., Kottelat, M., Kovacs, K. M., Kuzmin, S. L., La Marca, E., Lamoreux, J. F., Lau, M. W., Lavilla, E. O., Leus, K., Lewison, R. L., Lichtenstein, G., Livingstone, S. R., Lukoschek, V., Mallon, D. P., McGowan, P. J., McIvor, A., Moehlman, P. D., Molur, S., Muñoz Alonso, A., Musick, J. A., Nowell, K., Nussbaum, R. A., Olech, W., Orlov, N. L., Papenfuss, T. J., Parra-Olea, G., Perrin, W. F., Polidoro, B. A., Pourkazemi, M., Racey, P. A., Ragle, J. S., Ram, M., Rathbun, G., Reynolds, R. P., Rhodin, A. G., Richards, S. J., Rodrı́guez, L. O., Ron, S. R., Rondinini, C., Rylands, A. B., Sadovy de Mitcheson, Y., Sanciangco, J. C., Sanders, K. L., Santos-Barrera, G., Schipper, J., Self-Sullivan, C., Shi, Y., Shoemaker, A., Short, F. T., Sillero-Zubiri, C., Silvano, D. L., Smith, K. G., Smith, A. T., Snoeks, J., Stattersfield, A. J., Symes, A. J., Taber, A. B., Talukdar, B. K., Temple, H. J., Timmins, R., Tobias, J. A., Tsytsulina, K., Tweddle, D., Ubeda, C., Valenti, S. V., van Dijk, P. P., Veiga, L. M., Veloso, A., Wege, D. C., Wilkinson, M., Williamson, E. A., Xie, F., Young, B. E., Akçakaya, H. R., Bennun, L., Blackburn, T. M., Boitani, L., Dublin, H. T., da Fonseca, G. A., Gascon, C., Lacher Jr., T. E., Mace, G. M., Mainka, S. A., McNeely, J. A., Mittermeier, R. A., Reid, G. M., Rodriguez, J. P., Rosenberg, A. A., Samways, M. J., Smart, J., Stein, B. A., and Stuart, S. N.: The Impact of Conservation on the Status of the World’s Vertebrates, Science, 330, 1503–1509, 2010. Hole, D. G., Willis, S. G., Pain, D. J., Fishpool, L. D., Butchart, S. H. M., Collingham, Y. C., Rahbek, C., and Huntley, B.: Projected impacts of climate change on a continent wide protected area network, Ecol. Lett., 12, 420–443, 2009. IUCN: Red List of Threatened Species, Version 2010.3, Cambridge, IUCN, 2010. Jenkins, C. N. and Joppa, L.: Expansion of the global terrestrial protected area system, Biol. Conserv., 142, 2166–2174, 2009. Jennings, M. D.: Gap analysis: concepts, methods, and recent results, Landscape Ecol., 15, 5–20, 2000. Lobo, J. M. and Araújo, M. B.: La aplicación de datos faunı́sticos para el diseño de redes de reservas: el caso de los anfibios y reptiles de la Penı́nsula Ibérica, Graellsia, 59, 399–408, 2003. Maiorano, L., Falcucci, A., and Boitani, L.: Gap analysis of terrestrial vertebrates in Italy: priorities for conservation planning in a human dominated landscape, Biol. Conserv., 133, 455–473, 2006. Maiorano, L., Falcucci, A., Garton, E. O., and Boitani, L.: Contribution of the Natura 2000 network to biodiversity conservation in Italy, Conserv. Biol., 21, 1433–1444, 2007.. Web Ecol., 12, 65–73, 2012. Margules, C. R. and Pressey, R. L.: Systematic conservation planning, Nature, 405, 243–253, 2000. Margules, C. R. and Sarkar, S.: Systematic Conservation Planning, Cambridge, Cambridge University Press, 2007. Martı́nez, I., Carreno, F., Escudero, A., and Rubio, A.: Are threatened lichen species well-protected in Spain? Effectiveness of a protected areas network, Biol. Conserv., 133, 500–511, 2006. Martı́n-Piera, F.: Area networks for conserving Iberian insects: a case study of dung beetles (col., Scarabaeoidea), J. Insect Conserv., 5, 233–252, 2001. Mawdsley, J. R., O’Malley, R., and Ojima, D. S.: A Review of Climate-Change Adaptation Strategies for Wildlife Management and Biodiversity Conservation, Conserv. Biol., 23, 1080–1089, 2009. Maxted, N., Dulloo, E., Ford-Lloyd, B. V., Iriondo, J. M., and Jarvis, A.: Gap analysis: a tool for complementary genetic conservation assessment, Divers. Distrib., 14, 1018–1030, 2008. Mitchell-Jones, A. J., Amori, G., Bodgdanowicz, W., Krystufek, B., Reijnders, P. J. H., Spitzenberger, F., Stubbe, M., Thissen, J. B. M., Vohralı́k, V., and Zima, J.: The Atlas of European mammals, Academic Press, London, 1999. Morrone, J. J.: La importancia de los Atlas Biogeográficos para la conservación de la Biodiversidad, PrIBES 2000, vol. 1, http://www.sea-entomologia.org/PDF/M3M PRIBES 2000/M3M1-05-069.pdf (last access: 25 April 2007), 2000a. Myers, N., Mittermeier, R. A., Mittermeier, C. G., da Fonseca, G. A. B., and Kents, J.: Biodiversity Hotspots for Conservation Priorities, Nature, 403, 853–858, 2000. NATURA 2000: Red Europea de Áreas Protegidas, http://ec.europa. eu/environment/nature/natura2000/db gis/index en.htm (last access: 3 October 2008), 2000. Nelson, T. A. and Boots, B.: Detecting spatially explicit hot spots in landscape-scale ecology, Ecography, 31, 556–566, 2008. Nogués-Bravo, D. and Martı́nez-Rica, J. P.: Factors controlling the spatial species richness pattern of four groups of terrestrial vertebrates in an area between two different biogeographic regions in northern Spain, J. Biogeogr., 31, 629–641, 2004. Pressey, R. L., Cabeza, M., Watts, M. E., Cowling, R. M., and Wilson, K. A.: Conservation planning in a changing world, Trend. Ecol. Evol., 22, 583–592, 2007. Rey Benayas, J. M. and de la Montaña, E.: Identifying areas of highvalue vertebrate diversity for strengthening conservation, Biol. Conserv., 114, 357–370, 2003. Rey Benayas, J. M., de la Montaña, E., Belliure, J., and Eekhout, X. R.: Identifying areas of high herpetofauna diversity that are threatened by planned infrastructure projects in Spain, J. Environ. Manage., 79, 279–289, 2006. Rodrigues, A. S. L., Akçakaya, H. R., Andelman, S. J., Bakarr, M. I., Boitani, L., Brooks, T. M., Chanson, J. S., Fishpool, L. D. C., da Fonseca, G. A. B., Gaston, K. J., Hoffmann, M., Marquet, P. A., Pilgrim, J. D., Pressey, R. L., Schipper, J., Sechrest, W., Stuart, S. N., Underhill, L. G., Waller, R. W., Watts, M. E. J., and Yan, X.: Global gap analysis: priority regions for expanding the global protected-area network, BioScience, 54, 1092–1100, 2004. Rondinini, C., Rodrigues, A. S. L., and Boitani, L.: The key elements of a comprehensive global mammal conservation strategy, Trans. R. Soc. B, 366, 2591–2597, 2011.. www.web-ecol.net/12/65/2012/.
(9) M. J. T. Assunção-Albuquerque et al.: Geography of high-value biodiversity areas for terrestrial vertebrates Sarkar, S., Pressey, S. L., Faith, D. P., Margules, C. R., Fuller, T., Stoms, D. M., Moffer, A., Wilson, K. A., Williams, K. J., Williams, P. H., and Andelman, S.: Biodiversity Conservation Planning Tools: Present Status and Challenges for the Future, Annu. Rev. Env. Resour., 31, 123–159, 2006. Scott, D. W.: Multivariate Density Estimation. Theory, Practice and Visualization, John Wiley & Sons, Inc., New York, 317 pp., 1992. Shi, H., Singh, A., Kant, S., Zhu, Z., and Waller, E.: Integrating habitat status, human population pressure, and protection status into biodiversity conservation priority setting, Conserv. Biol., 19, 1273–1285, 2005. Vié, J.-C., Hilton-Taylor, C., and Stuart, S. N.: Wildlife in a Changing World – An Analysis of the 2008 IUCN Red List of Threatened Species, Gland, Switzerland, IUCN, 180 pp., 2009. Visconti, P., Pressey, R. L., Giorgini, D., Maiorano, L., Bakkenes, M., Boitani, L., Alkemade, R., Falcucci, A., Chiozza, F., and Rondininii, C.: Future hotspots of terrestrial mammal loss, Phil. Trans. R. Soc. B, 366, 2693–2702, 2011.. www.web-ecol.net/12/65/2012/. 73. World Database on Protected Areas (WDPA) Consortium 2009: World database on protected areas. IUCN, WDPA and UNEP (United Nations Environment Programme), WCMC (World Conservation Monitoring Centre), Washington DC, http://www. wdpa.org/Default.aspx, last access: 3 August 2009. WDPA, IUCN and UNEP-WCMC: The World Database on Protected Areas (WDPA): Annual Release [On-line], Cambridge, UK, UNEP-WCMC, http://www.wdpa.org, last access: 8 December 2010. Wiersma, Y. F. and Nudds, T. D.: Efficiency and effectiveness in representative reserve design in Canada: The contribution of existing protected areas, Biol. Conserv., 142, 1639–1646, 2009.. Web Ecol., 12, 65–73, 2012.
(10)
Figure

Documento similar
In the preparation of this report, the Venice Commission has relied on the comments of its rapporteurs; its recently adopted Report on Respect for Democracy, Human Rights and the Rule
For Pavlik (2005), technology has modified journalism studies in four major areas: the way of teaching and researching; the content of what is taught, the structure of the
Location of Barranca del Río Santiago (Santiago River Canyon) study area and adjoining protected natural areas by jurisdiction ………. Variables distribution in BRS-SA and
We applied the criteria summarized in Table 2 for categorizing cortical types in human prefrontal areas and visual areas in the occipital lobe described above to the micrographs of
Figure 4.12, shows the area values calculated by each subject within the selected window, and in Figure 4.13, the differences in the mean of the Granger causality areas calculated
For that, in this work, the three periurban areas of the greatest traditional agricultural production of Europe are analyzed and compared through the assessment of GIS indicators:
Effect of the Scheme on Protected Traces: We then study the effect of the defense on protected traces. The results are shown.. Performance of the attack on traces protected with
No obstante, como esta enfermedad afecta a cada persona de manera diferente, no todas las opciones de cuidado y tratamiento pueden ser apropiadas para cada individuo.. La forma
