Performance Improvements of an Atmospheric Radiative Transfer Model
on GPU-based platform using CUDA
Jacobo Salvador1,3, Osiris Sofia1, Facundo Orte3, Eder Dos Santos1, Hirofumi Oyama4, Tomoo Nagahama4,Akira Mizuno4, Roberto Uribe-Paredes2.
Contact email: [email protected]
1. Unidad Académica Río Gallegos – Universidad Nacional de la Patagonia Austral
Lisandro La Torre 1070 – 0054-2966-442313 – Río Gallegos – Santa Cruz – Argentina 2. Departamento de Ingeniería en Computación, Universidad de Magallanes, Chile.
3. Centro de Investigaciones en Láseres y Aplicaciones, CEILAP UMI-IFAECI-CNRS-3351,UMI3351, Villa
Martelli, Argentina
4.Solar-Terrestrial Environment Laboratory (STEL), Nagoya University, Nagoya, Japan.
Abstract: Classical applications of Atmospheric Radiative Transfer Model (ARTM) for modelization of
absorption coefficient line-by-line on the atmosphere consume large computational time since seconds up to a few minutes depending on the atmospheric characterization chosen. ARTM is used together with Ground-Based or Satellite measurements to retrieve atmospheric parameters such as ozone, water vapour and temperature profiles. Nowadays in the Atmospheric Observatory of Southern Patagonia (OAPA) at the Patagonian City of Río Gallegos have been deployed a Spectral Millimeter Wave Radiometer belonging Nagoya Univ. (Japan) with the aim of retrieve stratospheric ozone profiles between 20-80 Km. Around 2 GBytes of data are recorder by the instrument per day and the ozone profiles are retrieving using one hour integration spectral data, resulting at 24 profiles per day. Actually the data reduction is performed by Laser and Application Research Center (CEILAP) group using the Matlab package ARTS/QPACK2. Using the classical data reduction procedure, the computational time estimated per profile is between 4-5 minutes determined mainly by the computational time of the ARTM and matrix operations. We propose in this work first add a novel scheme to accelerate the processing speed of the ARTM using the powerful multi-threading setup of GPGPU based at Compute Unified Device Architecture (CUDA) and compare it with the existing schemes. Performance of the ARTM has been calculated using various settings applied on a NVIDIA graphic Card GeForce GTX 560 Compute Capability 2.1. Comparison of the execution time between sequential mode, Open-MP and CUDA has been tested in this paper.
Keywords:Radiative transfer model, GPU, OpenMP, Parallel Computing, CUDA.
1. Introduction
Computational speed of Graphical Processing Units (GPU) devices has exploded in recent years. Research studies in this field have indicated that the GPU is two order of magnitudes faster than typical Central Processing Unit (CPU) for many applications. However, such performance figures have also been shown as unfairly biased [Chhugani et al., 2010]. It is important to compare similar CPU and GPU setups, as well as utilizing all possible optimizations on both the GPU and the CPU [Gregg and Kim Hazelwood, 2011].
The current version of the atmospheric model called am is an Atmospheric Radiative
1.1 Atmospheric Radiative Transfer Model
The propagation of radiation through the atmosphere is described by the radiative transfer theory [Chandrasekhar, 1960]. This theory describes how the variation of the radiation intensity along a line of slight ds following the propagation direction is found considering
the sum of source and absorption within a unit volume element along this line. The expression can be written as a differential equation [Janssen, 1993]:
dI I S ds υ υα
= − + (1)
Where α is the absorption coefficient, S the Source term, which respectively describe the loss and gain of energy into a given direction and Iv , is the instantaneous radiant power
that flows at each point in the medium, per unit area, per unit-frequency interval at a specific frequency, and in a given direction per unit solid angle.
Scattering can be generally neglected in the microwave range, due to the fact the corresponding wavelengths are several orders of magnitude larger than the cloud droplet radius and therefore the absorption cross sections are much larger than the scattering cross-sections. In addition microwave wavelengths are insensitive to scattering by stratospheric aerosols, having a cross-sections up to 1000 times smaller than the wavelength considered. Under rainy-weather conditions the droplets can be reach a size comparable with the wavelength observed. In this case the scattering cannot be neglected.
In most cases for ground-based remote sensing of stratospheric and mesospheric quantities, the scattering effects due to the rain droplet can be neglected if we assume that optical-path length due to the scattering is small along beam axis and the scattering medium (rain droplets) distribution in a plane perpendicular to the beam axis is isotropic.
Hence without scattering the source S represents only the locally generated contribution to the radiation , and α the loss radiation energy into the propagation medium [Janssen, 1993].
In particular if we assume that each point along a path has local thermodynamic equilibrium so each point can be characterize by a temperature T. The balance between the energy absorbed and emitted by a particular volume element can be characterized by Kirchoff's law for the source term as follow:
S =αB Tυ( ) (2)
where Bv(T) is the Planck function:
3 2 2 1 ( ) 1 h T h B T c e υ υ κ υ = − (3)
Here h is the Planck's constant, k is the Boltzmann's constant, c is the speed of light, and v
is the frequency. Therefore, combining equation (1) and (3) and assuming that the scattering is negligible, the differential equation can be solved as follow:
0 0 ( ) ( ) 0 0
(0) ( ) ( )
s
s s
I I s e τ B T e τ ds
υ υ υ α
− −
= +
∫
(4)' ' 0
( ) ( )
s
s s ds
τ =
∫
α (5)The radiative atmospheric model selected to this work is the “am” (atmospheric model)
which could be downloaded from Harvard Smithsonian Center for Astrophysics CFA at https://www.cfa.harvard.edu/~spaine/am/.
The am model works from microwave through submillimeter wavelengths. The primary
application area for am is in radio astronomy, involving terrestrial propagation paths
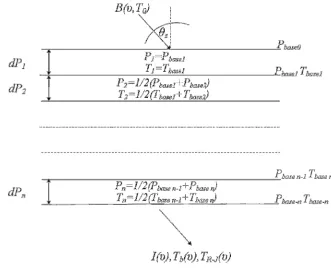
between ground and sky but also can be expanded to ground-based instrumentation. The propagation paths can be modeled following a sequence of planar layers where each layer might be composed with different gas tracer named as columns. A representation of the atmospheric state is given in Figure 1.
Figure 1: am layer model. Layer pressures and temperatures have been defined at the layer midpoints as Pn=1/2(Pbasen-1+Pbasen). Adapted from am model manual [Paine., 2014].
Pn and Tn represents the mid-point pressure and temperature of the layer n respectively. B(υ,T0) is the Plank function corresponding to background at top. Brightness temperature at
surface is the sum of the contribution of each layer.
1.1.1 Application on Instrument
[image:3.612.132.463.235.505.2]information on variations of the vertical distributions of gases(ozone in our case) in the middle atmosphere with various timescales. The vertical profile of ozone mixing ratio can be calculated exactly from Eq. 4 from the radiative transfer at the millimeter wavelength. A spectral millimeter wave radiometer (MWR) is basically composed of an antenna, a heterodyne receiver front end to process the spectral line signal emitted by the ozone at ~110.836 GHz, and a spectrometer backend. Figure 2 shows a block diagram of the MWR installed in the Observatorio Atmosférico de la Patagonia Austral (OAPA).
The flat rotating mirror installed before the parabolic mirror switches the input signal among the sky and the two calibration loads. The intensity scale is calibrated by using two temperatures blackbodies, hot and cold loads, as intensity references. The hot load (~300 K) is a radio-wave absorber at room temperature and the cold load (77 K) is achieved through an absorber by soaking in liquid nitrogen in a styrene foam vessel.
Figure 2. Block diagram of millimetric wave radiometer installed in the Observatorio Atmosferico de la Patagonia Austral used to measure ozone.
1.2 Accelerating based in OpenMP and Threshold Value
The OpenMP Application Program Interface (API) is a multi-platform shared-memory parallel programming model for the C, C++ and Fortran programming languages. Further information can be found at http://www.openmp.org/. When the model runs with high spectral resolution and with many layers and columns, it can take long computational time. The atmospheric model am used in the work was implemented using the OpenMP version
applied on multi-core machines due the line-by-line absorption coefficient computations are easily parallelized. A second improvement to speed-up line-by-line computation consists in to stop the calculations when the relative error of the absorption coefficient is lower than a threshold value. This is set in the input file through a parameter called Tolerance and called as Tol in the next sections and graphics.
[image:4.612.151.459.246.439.2]2. Graphics Processing Units
The era of single-threaded processor performance increases has come to an end. Programs will only increase in performance if they utilize parallelism. However, there are different kinds of parallelism. For instance, multicore CPUs provide task-level parallelism. On the other hand, Graphics Processing Units (GPUs) provide data-level parallelism.
Current GPUs consist of a high number (up to 512 in current devices) of computing cores and high memory bandwidth. Thus, GPUs offer a new opportunity to obtain short execution times. They can offer 10x higher main memory bandwidth and use data parallelism to achieve up to 10x more floating point throughput than the CPUs [Wu-Feng and D.Manocha, 2007].
GPUs are traditionally used for interactive applications, and are designed to achieve high rasterization performance. However, their characteristics have led to the opportunity to other more general applications to be accelerated in GPU-based platforms. This trend is called General Purpose Computing on GPU (GPGPU). These general applications must have parallel characteristics and an intense computational load to obtain a good performance. To assist in the programming tasks of these devices, the GPU manufacturers, like NVIDIA or AMD/ATI, have proposed new languages or even extensions for the most common used high level programming languages. As example, NVIDIA proposes CUDA [NVIDIA CUDA], which is a software platform for massively parallel highperformance computing on the company powerful GPUs.
In CUDA, the calculations are distributed in a mesh or grid of thread blocks, each with the same size (number of threads). These threads run the GPU code, known as kernel. The dimensions of the mesh and thread blocks should be carefully chosen for maximum performance based on the specific problem being treated.
Current GPUs are being used for solving different problems like data mining, robotics, visual inspection, video conferencing, video-on-demand, image databases, data visualization, medical imaging, among other and it is increasingly the number of applications that are being parallelized for GPUs.
2.1 CUDA Programming Model
The NVIDIA’s CUDA Programming Model [NVIDIA CUDA Compute Unified Device Architecture-Programming, 2009]considers the GPU as a computational device capable to execute a high number of parallel threads. CUDA includes C/C++ software development tools, function libraries, and a hardware abstraction mechanism that hides the GPU hardware to the developers by means of an Application Programming Interface (API). Among the main tasks to be done in CUDA are the following: allocate data on the GPU, transfer data between the GPU and the CPU and launch kernels.
3. Atmospheric Radiative Tranfer Model on GPU
There are currently very low cost devices that allow the massive GPU based parallelization. Due to the large amount of data processing one intends efficient GPU parallelization in this section will be implemented to speed-up the execution time of the program. We will describe an implementation on GPU of line-by-line calculation over the am model [Paine.,
2014]. The line-by-line calculations are implemented on the linesum function as part of am
model. Previous tests over the program have shown that around 80% of the total execution time of the model is focusing in the linesum routine. The aim of the routine consists in produce the addition of the absorption coefficient in each layer in the whole spectral range set. It is important to remark that it is not our intention of this section to give a full description of physics aspects involved in general atmospheric models.
The line-by-line column types set at the input file are important parameter which are listed in Table B.4 [manual am]. These column types are for molecular species having line
spectra associated with a molecular absorption coefficient, k [cm2]. The absorption
coefficient is computed using data from the HITRAN 2012 database (Rothman et al. 2013). For each column type, a default line shape is given. In our case we have implemented on GPU only the Gross and VVH_750 line shape function because they are defined majority by default in the am model. Default line shapes may be altered by layer and column type by
using the lineshape keyword in the input dataset.
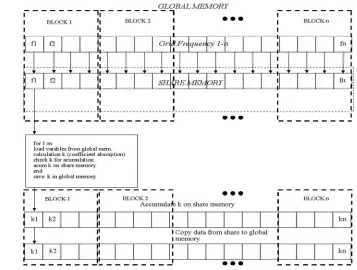
As described earlier, the GPU holds different types of memory. To best utilize the GPU the developer must understand these differences of memory types. Depending on their usage the memory can affect the performance of the whole application. The implementation using CUDA involves a basic kernel scheme using shared memory, single floating point and math built-in device function. Figure 3 shows as the linesum routine was modified to run on CUDA. Different variables used by the model need firstly to be transferred from the host to device memory using built-in functions provided by CUDA. After that we define and create local variables only visible by the thread. Our implementation uses shared memory due to its faster access than global memory.
The longitude of the blocks and thread per blocks depends strongly on the grid frequency. It is the main variable that regulates how many threads and blocks will be used for the kernel function. This variable is not fixed and depends on the input parameters that the user set at the input file. In our experiments described in the next section we have chosen the case of the thermal emission of the ozone molecule at 110.836 GHz with a bandwidth around the central frequency of 1GHz.
Frequency resolution value called in this paper as Δf will define the length of the grid
Figure 3: Scheme of the CUDA implementation in the GPU for the linesum routine at AM model. Each thread is the responsible of compute the absorption coefficient at a determined frequency. The frequency grid are organized by a grid composed by blocks and each block for a constant number of threads.
4. Results and discussion
The experiments were carried out in a PC Intel Core i7-4770 at 3.40GHz with 8Gb RAM with a graphical board GeForce GTX 560 with a total amount of global memory of 1Gb, 48 CUDA cores by Multiprocessors (eight in total) using CUDA driver 6.0, capability 2.1. Three types of program versions are evaluated in this section as well as their performances in respect to the total time of execution classified as sequential, CUDA version and original model. In the sequential mode or commonly called force brute the original version of the program was modified to compile without OpenMP directives in all routines. For more details of CUDA version refers section above where the CUDA implementation inside the linesum function of the program was modified.
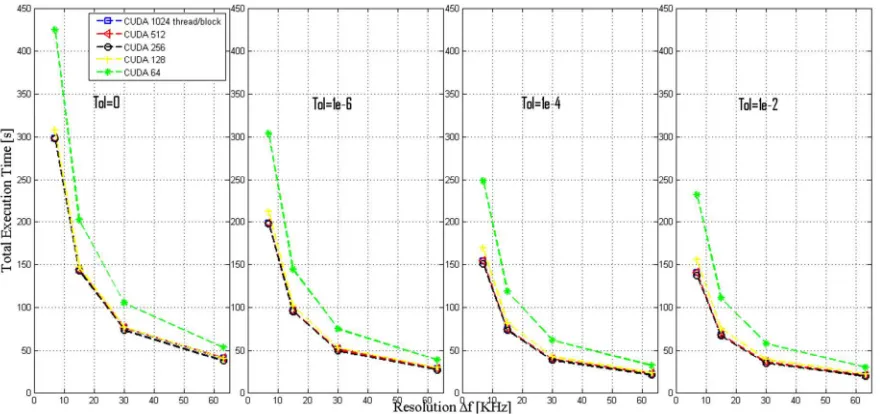
[image:7.612.115.472.74.344.2]Figure 4: Evaluation of the performance of the CUDA implementation routine respect the total number of thread by block for 1024, 512, 256, 128,64 for 4 tolerance values.
We have used 256 threads per block in our graphical board, because this represents the optimal value that reduces the execution time of our code. Also, it is possible to see how the performance of the experiments is getting worse when the order of the threads is lower than 128 threads per block. NVCC compiler is used to compile the package. Respect the original version, it is used without any modification in its code and it has been installed following the manual instruction.
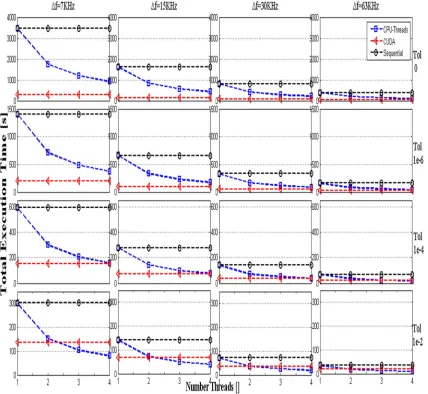
The models called sequential, CUDA and original versions were configured to run using a basic atmosphere with the number of 60 layers. The model is set with a central grid frequency at 110.836 GHz with 500MHz both sides. It means that the total bandwith is 1 GHz. Here we will focus in the performance and improvements of the codes. Figure 5 present the outputs of the three execution versions described above. The graphics are organized in rows and columns. Each row represents different outputs of a model for a specific resolution and tolerance, while columns represent the execution of the same input file but using different tolerance parameters (0, 1x10-6,1x10-4,1x10⁻²). As was described in details in the previous section, tolerance value is implemented in the model to speed-up the calculation. In the x-axis the number of threads of the Intel Core is set from 1 to 4 as maximum while y-axis represents the total time execution given by the program.
[image:8.612.91.532.72.279.2]Figure 5: Evolution of the performance in total execution time vs threads numbers (CPU) to four resolutions and tolerance values for sequential (circle), CUDA implementation (triangle) and original program (square).
5. Conclusion and future work
This work presents a different point of view with respect to the optimization of an atmospheric radiative transfer model ARTM for ground-based application. We have presented an introduction to Graphics Processing Unit and an evaluation of the total execution time of the radiative transfer model denominated as am downloaded from the
web belonging to Harvard-Smithsonian Center for Astrophysics was performed with different settings and compilation. Three comparisons have been presented and tested based in CUDA routines, sequential implementation and also they were compared with the original version working with OpenMP. For CUDA implementation the same concept given by the original model to avoid redundant calculation has been included to accelerate the execution. Another important point to reduce the execution time in CUDA is the tolerance parameter optimization that is described in the manual of am. The experiment
faster than original version with four CPU threads. This performance for the other resolution frequencies decreases a little for Δf=15, 30 and 63KHz reaching a performance
of 2.55x for the last resolution at 63 KHz. For tolerance parameter of 1x10⁻⁶ has also been obtained an improvement in CUDA with respect to all threads using the CPU. For tol=1x10⁻⁴ the speed-up improvement are acceptable when the threads number of the CPU are lower than four.
Finally we can conclude that CUDA implementation might be a useful tool to incorporate area of science to improve the computational time of models or math operations. In the future researching in code optimization based for GPU will continue, and we thought this kind of work might open a new way for general optimization codes.
6. References
• Jatin Chhugani, Michael Deisher, Daehyun Kim, Victor W Lee, Changkyu Kim, and Anthony D. Nguyen. Debunking the 100X GPU vs. CPU myth: an evaluation of throughput computing on CPU and GPU. In: Proceedings of the 37th anual international symposium on Computer architecture. ISCA ’10.
Saint-Malo, France: ACM, pp. 451–460. ISBN: 978-1-4503-0053-7. URL: http://doi.acm. org/10.1145/1815961.1816021. 2010.
• GPGPU. general-purpose computation using graphics hardware, http://www.gpgpu.org.
• Chris Gregg and Kim Hazelwood. Where is the Data? Why you cannot debate CPU vs. GPU Performance without the answer. Tech. rep. University of Virginia, 2011. URL:
http://www.cs.virginia.edu/kim/docs/ispass11.pdf.
• Huang B., Mielikainen J., Oh H. and Huang H.-L, Development of a GPU-based highperformance radiative transfer model for the Infrared Atmospheric Sounding Interferometer (IASI), Journal of
computational Physics, DOI:10.1016/j.jcp.2010.09.011.
• Jenssen, M. A., Atmospherc Remote Sensing by Microwave Radiometry, A volume in the Wiley Series in Remote Sensing Jin Au Kong, Series Editor, 1993.
• Mielikainen Jarno, Bormin Huang, and Hung-Lung Allen Huang, GPU-Accelerated Multi-Profile Radiative Transfer Model for the Infrared Atmospheric Sounding Interferometer, IEEE Journal ofr
Selected Topics in Applied Earth Observation and Remote Sensing, Vol. 4, Nº 3, September 2011. • NVIDIA CUDA Compute Unified Device Architecture-Programming Guide, Version 2.3. NVIDIA.
http://developer.nvidia.com/object/gpucomputing.html. 2009.
• Paine, S. “The am atmospheric model” Submillimeter Array Technical Memo #152, v. 8.0
(2014) URL: http://www.cfa.harvard.edu/sma/memos/152.pdf
• Rothman, L.S, I.E. Gordon, A. Barbe, D.Chris Benner, P.F. Bernath, M. Birk, V. Boudon, L.R. Brown, A. Campargue, J.-P. Champion, K. Chance, L.H. Coudert, V. Dana, V.M. Devi, S. Fally, J.-M. Flaud, R.R. Gamache, A. Goldman, D. Jacquemart, I. Kleiner, N. Lacome, W.J. Lafferty, J.- Y. Mandin, S.T. Massie, S.N. Mikhailenko, C.E. Miller, N. Moazzen-Ahmadi, O.V. Naumenko, A.V. Nikitin, J. Orphal, V.I. Perevalov, A. Perrin, A. Predoi-Cross, C.P. Rinsland, M. Rotger, M. Šimečkova, M.A.H. Smith, K. Sung, S.A. Tashkun, J. Tennyson, R.A. Toth, A.C. Vandaele and J. Vander Auwera 2009, The HITRAN 2008 molecular spectroscopic database, J. Quant. Spectrosc. Radiat. Transfer 110:533.
• Subrahmanyan Chandrasekhar. Radiative Transfer. Dover Publications Inc. p. 393. ISBN 0-486-60590-6, 1960.
• Wu-Feng, Manocha, D.: High-performance computing using accelerators. Parallel Computing 33, 645– 647 2007.
Acknowlegment