Master Erasmus Mundus in Mediterranean Forestry and
Natural Resources (MEDFOR)
HOW DOES PRECIPITATION PATTERN AFFECT ANNUAL
TREE GROWTH? A MULTI-YEAR DATA ANALYSIS CASE
STUDY OF SEMI-ARID YATIR FOREST, ISRAEL
By Shebeshe Assefa Haile
Main supervisors: Yakir Preisler (Ph.D. Candidate)
Co-supervisors: Prof. Dan Yakir
Prof. Felipe Bravo
July 2019
Table of contents
List of figures ... 4
List of tables ... 6
Abstract... 7
1. Introduction ... 9
1.1 Impact of climate change-driven drought on forest ... 9
1.2 Drought and ecohydrology of semiarid forest ... 9
1.3 Climatic impacts and drought control of tree radial growth in semi-arid regions .... 10
2. Objective ... 12
2.1 General objective ... 12
2.2 Specific objectives ... 12
3. Methods ... 12
3.1 Study area ... 12
3.2 Data structural framework ... 13
3.3 Data analysis approach and method ... 14
3.3.1 Precipitation pattern analysis ... 14
3.3.1.1 Precipitation temporal pattern analysis ... 14
3.3.1.2 Dry, average and wet years precipitation distribution pattern ... 15
3.4 Soil moisture (SWC) analysis ... 15
3.5 Tree ring radial growth analysis ... 16
4. Result ... 16
4.1 Precipitation amount and temporal pattern analysis ... 16
4.2 Precipitation distribution pattern for dry, average and wet years ... 21
4.3 Soil water content ... 26
4.4 Tree ring radial growth analysis ... 31
5 Discussion ... 33
5.1 Precipitation pattern ... 33
5.2 Soil water content (SWC) dynamic as a response to the observed P pattern ... 34
5.3 Tree radial growth ... 35
6 Conclusion and recommendations ... 35
Acknowledgment ... 36
References ... 37
List of figures
Figure 1: Location map of the study site Yatir Forest, Israel ... 12 Figure 2: Observed data structural framework in Yatir station, Israel shows the observation period and the overlay of the dataset used in this research. ... 13 Figure 3: Trend of long term (1971/72 – 2018/19) total annual precipitation trend and number of days with precipitation ≥ 1m/day ... 16 Figure 4: Mean monthly precipitation distribution pattern ... 17 Figure 5: Trend of rainfall storm size of Continuous precipitation with breaks no longer than 24 hs ... 17 Figure 6: Trend of rainfall storm size of Continuous precipitation with breaks no longer than 48 h. ... 18 Figure 7: Rainfall storm size proportional (%) distribution pattern of continuous precipitation with breaks no longer than 24 h: Grey bar represents the frequency of storm and the blue bar represents the precipitation amount. ... 18 Figure 8: Rainfall storm size distribution pattern of Continuous precipitation with breaks no longer than 48h. Grey bar represents the frequency of storm and the blue bar represents the precipitation amount. ... 19 Figure 9: Rainy season onset and secession windows in Yatir station, Israel ... 19 Figure 10: Length of rainy and dry seasons (LRS and LDS) in Yatir station, Israel ... 20 Figure 11: Length of rainy season and NS > 10 mm against bins of Annual P classes (binned with 50 mm interval) ... 20 Figure 12: Observed years categorized as dry (red), average(grey) and wet (blue) years with the respective annual precipitation and the total NS ... 21 Figure 13: Distribution of the NS (frequency) with no break > 24h and 48h with <30 and ≥30 mm storm category ... 22 Figure 14: Distribution of the NS (frequency) with no break > 24h and 48h with <30 and ≥30 mm category ... 22 Figure 15: NS with break not > 24 h proportional (%) distribution pattern for dry, intermediate (average) and wet years are shown by red, grey and blue bars, respectively ... 23 Figure 16: NS with breaks not > 48h proportional (%) distribution pattern for dry, intermediate (average) and wet years are shown by red, grey and blue bars, respectively ... 23 Figure 17: Precipitation amount proportional distribution pattern (%) of storms with break not > 24h ... 23 Figure 18: Precipitation amount proportional distribution pattern (%) of storms with breaks no> 48h ... 24 Figure 19: Comparison of the NS (NS), LRS and LDS among dry, intermediate and wet years.
... 25 Figure 20: Observed hydrologic years mean monthly SWC for the averaged depth of 10-60mm and 10-19 mm depths with respective monthly precipitation (mm) ... 27 Figure 21: Observed and simulated daily SWC for the averaged depth of 10-60mm with respective daily precipitation (mm)... 27 Figure 22: Integrated graphs of Observed and Simulated SWC for the upper 10-60 cm depth from 2001 to 2018 ... 28 Figure 23: Cluster of good wet years (longer growing season) and bad dry years (shorter growing season). (a) shows good wet years with extended growing season and SWC raises above 0.3 m3/m3 during peak seasons (b) shows clusters of bad years with
very short growing and SWC doesn’t raise above 0.25m3/m3 during peak time. ... 28
List of tables
Table 1: Bins of precipitation class of the observed years with LRS, annual precipitation and number of storms (NS). ... 20 Table 2: Length of rainy season (LRS) distribution pattern among wet, dry and intermediate
years ... 21 Table 3: Summary table of descriptive statistics as an ID of dry, average and wet year... 24 Table 4: Summary table of soil moisture onset and crossing date during the SWC
Abstract
Climate change associated recurring phenomenon of drought causes a threat to the global forest resource. Particularly in arid and semi-arid regions, the climate change forecast predicted a decrease in annual precipitation (P) and an increase in the intensity of rainstorms. The impact of such P pattern changes on the growth of arid and semiarid forests, where water availability is the primary growth controlling factor is not fully understood. In this study, we investigated the effect of the P pattern on soil water content (SWC) dynamics in relation to the respective tree radial growth. The study was conducted in Yatir Pinus halepensis plantation forest in the semi-arid region of Israel. Long-term meteorological, measured SWC and dendrochronological data sets and field observations have been used for subsequent analysis of P pattern, soil moisture dynamics and tree radial growth response. Inter-annual and intra-annual P pattern characterized by intra-annual P, seasonal (monthly) P, storm characteristics (number of storms, P amount), Length of the rainy season (LRS) and length of the dry season (LDS). Higher temporal variability in annual P (CV=36%) and seasonal P (monthly P). Annual P of the last 5 decades did not show a statistically significant trend of change. However, the number of storms (NS) show decreasing trend attributed to the smaller and frequent storms with < 5 mm which have < 10% contribution to the annual P. Dry, intermediate and wet years showed a significant difference (p=0.01) in NS while there was no significant difference in LRS and LDS. This difference in storm pattern distribution clearly reflected on the soil water dynamics variation among wet, intermediate and dry years. Wet, intermediate and dry years have about four, two and one months of growing length seasons, respectively. To conclude, annual P, NS, LRS, LDS and length of the growing season were a significant predictor of tree radial growth. But P was the best predictor of the most parsimonious model for tree radial growth (BAI). Monthly distribution of these bigger and infrequent storms determines the SWC seasonal dynamics and respective GSL of the HY.
Resumen
Las sequías recurrentes son una amenaza para los recursos forestales a nivel mundial. Particularmente en las regiones áridas y semiáridas, el pronóstico del cambio climático predice una disminución en la precipitación anual (P) y un aumento en la intensidad de las tormentas. El impacto de dichos cambios en el patrón de precipitaciones sobre el crecimiento de los bosques áridos y semiáridos, donde la disponibilidad de agua es el principal factor de control del crecimiento, no se conoce de forma completa. En este estudio, investigamos el efecto del patrón de precipitaciones sobre la dinámica del contenido de agua del suelo (SWC) y su relación con el crecimiento radial de los árboles. El estudio se realizó en una zona repoblada con Pinus halepensis en la región semiárida de Yatir en Israel. Los datos meteorológicos, los de contenido de agua en el suelo (SWC) y los dendrocronológicos junto con observaciones de campo se han utilizado para el análisis a posteriori del patrón de precipitaciones, la dinámica de la humedad del suelo y la respuesta de crecimiento radial del árbol. El patrón interanual e intraanual de las precipitaciones se ha caracterizado mediante la precipitación anual, estacional (mensual), el número de tormentas y la cantidad de lluvia que representan, la duración de la temporada de lluvias (LRS) y la duración de la temporada seca (LDS). Se encontró una mayor variabilidad temporal en precipitación anual (CV = 36%) y precipitación estacional (mensual). La precipitación anual de las últimas 5 décadas no mostró una tendencia de cambio estadísticamente significativa. Sin embargo, el número de tormentas (NS) muestra una tendencia decreciente atribuida a las tormentas más pequeñas y frecuentes con <5 mm que tienen una contribución de <10% a la anual. Los años secos, intermedios y húmedos mostraron una diferencia significativa (p = 0.01) en cuanto a NS mientras que no hubo diferencia significativa en LRS y LDS. Esta diferencia en la distribución del patrón de tormentas se refleja claramente en la variación de la dinámica del agua del suelo entre los años húmedos, intermedios y secos. Los años húmedos, intermedios y secos tienen aproximadamente cuatro, dos y uno meses de temporadas de crecimiento, respectivamente. Para concluir, la precipitación anual, NS, LRS, LDS y la duración de la temporada de crecimiento fueron un predictor significativo del crecimiento radial del árbol. Pero la precipitación fue el mejor predictor del modelo más simple para el crecimiento radial de los árboles (en crecimiento de área basimétrica individual). La distribución mensual de las tormentas más grandes e infrecuentes determina la dinámica estacional del SWC y la de la estación de crecimiento durante el año hidrológico. GSL del HY.
1. Introduction
1.1 Impact of climate change-driven drought on forest
Natural and anthropogenic activity affects the earth at varying scale from local or regional (erosion, flooding landslide, etc) perspective to planetary functioning perspective (climate change, ocean acidification, etc.) (Malhi, 2017; Steffen, Broadgate, Deutsch, Gaffney, & Ludwig, 2015; Tarolli, 2017). Anthropogenic alteration on earth system growing fast in the last century (Steffen et al., 2015; Tarolli, 2017). Climate change and deforestation are major global challenges of the century. Much has been reported, in broadly speaking about forest ecosystem services. Forests play several ecosystem services of production, regulatory and social services. One of the more recent and vastly recognized services of the forest is it’s vital role in the Earth’s climate system through its contribution to the atmospheric gases cycle (Felipe Bravo, Robert Jandl, Valerie LeMay, 2017). However, accelerated deforestation and climate change associated threats on forest resource become a growing worldwide concern (Raz-Yaseef et al., 2010; Pasho, Camarero, & Vicente-Serrano, 2012; Preisler et al., 2019). Climate change associated drought become a recurring phenomenon that impacts the ecosystem functioning and human welfare (Malhi, 2017; Tarolli, 2017.).
Drought can be defined in different ways in reflection to various perspectives and interests. There is no precise and universally accepted definition of drought (Wilhite, 2000). Hence, the definition of drought can be region and application-specific (Sun, Solomon, Dai, & Portmann, 2007). Commonly, drought is classified into three types; meteorological drought, hydrological drought and agricultural drought (Thao-Sam et al., 2018; AMS, 2005). Meteorological drought refers to the conditions when precipitation is below a specified long-term average for a specified period that can be for a day, month, season, or year. It also can be caused by above-normal temperatures and causes other types of droughts (AMS 2005; Wilhite, 2000). Hydrological drought occurs when river stream flow and water storages in aquifers, lakes, or reservoirs fall below long-term mean levels (Wilhite, 2000). The commonly perceived attitude is that lack of precipitation coupled with more intense but less frequent precipitation often causes agricultural and hydrological droughts (Sun et al., 2007). However, in dryland areas where ET accounts the higher proportion of precipitation losses intense rainfall can enhance soil water recharge ( Raz-Yaseef et al., 2010).
1.2 Drought and ecohydrology of semiarid forest
Drought occurs at any parts of the world including humid and semi-humid areas while arid areas are more prone to drought. In arid and semi-arid environments moisture availability is the prior tree growth limiting factor. The total rainfall amount in these arid and semi-arid regions critically depend on a few rainfall events (Fu, Fu, Sun, & Kong, 2014). Evapotranspiration is the primary means of water loss in semiarid forest ecohydrology because of a lower ratio of precipitation to potential evapotranspiration (PET). This has been considered the primary driving cause for drought incidence in arid and semi-arid ecosystems (Raz-Yaseef et al., 2010; Fu et al., 2014). Driving forces of actual ET have spatial and temporal variability (Minderlein & Menzel, 2015). Though it is not easy, further partitioning of ET has critical importance to understand the underlying eco-hydrological process which determines seasonal soil water availability for tree growth. For instance, a case study of Yatir Forest in semi-arid Israel by Raz-Yaseef et al., (2010) reported highest proportion (>94%) of the precipitation goes to ET hydrologic flux components. Further detailed studies revealed that drought stresses effect on vegetation and particularly on forest trees is complex function of precipitation characteristics, atmospheric evaporative potential, soil property and vegetation characteristics (Raz-Yaseef et al., 2010; Dorman et al., 2015; Preisler et al., 2019).
crucial to gain insight into the present and future water availability and corresponding effect on dryland forests (Cleverly et al., 2016; Minderlein & Menzel, 2015; Sun et al., 2007). Though several studies have been done on temporal and spatial variabilities of drought influence on trees and forests, most of them rely on total precipitation and landscape physiographic gradients. But, particularly in dryland regions availability of tree transpiration water critically affected by the precipitation pattern through its direct effect on the dryland forest ecohydrology water budget. Hence, the precipitation pattern in terms of annual total precipitation, storm characteristics (intensity and NS) and length of rainy season controls tree radial growth.
1.3 Climatic impacts and drought control of tree radial growth in
semi-arid regions
Tree-ring records as natural archive become among the widely used important source of long-term climatic data with wider temporal and spatial scales (Felipe Bravo, Robert Jandl, Valerie LeMay, 2017; Olivar, Bogino, Spiecker, & Bravo, 2012). However, short and long-term growth responses of trees for drought and climatic influences still remain poorly understood (Pasho et al., 2012). Impact of intra-seasonal climatic variability of temperature, precipitation, VPD and respectively prevailing drought influence on tree growth response varies depending on the regional location and ecosystem type (Attolini et al., 1990; Dorman, Perevolotsky, Sarris, & Svoray, 2015a, 2015b; Olivera-Guerra et al., 2014; Pasho et al., 2012). For instance, studies in semiarid Spain showed winter temperature regime determine intra-annual density fluctuations (IADFs) in early and latewood formation (Olivar et al., 2012; de Luis et al., 2011; Pasho, Camarero and Vicente-Serrano, 2012), while in semiarid Israeli forest precipitation regime was found to be important climatic variable that determines seasonal or annual tree growth response (Raz-Yaseef et al., 2010). Long- and short-term response of tree growth to drought and the changing climate has not been yet fully understood (Pasho et al., 2012). Application of dendrochronology become a widely used and reliable tool to inquire long-term historical climate-growth relationship in a year to year correlative approach (Pasho, Camarero and Vicente-Serrano, 2012; Bravo et al., 2017).
Impact of the predicted climate change on the semi-arid forest, where moisture availability is the prior limiting factor expected to be a negative impact (Pasho, Camarero and Vicente-Serrano, 2012. Despite this negative impact expectation, some recent research reports suggest that the impact of the predicted decrease in precipitation can be balanced by the increase in storm intensity. The increase in storm intensity could have advantages to enhance moisture availability for semi-arid forests (Raz-Yaseef et al., 2010; Dorman et al., 2015; Preisler et al., 2019). Impact of the predicting climate change on forests at a varying scale ranging from a single tree to ecosystem level become an important research area (Preisler et al., 2019). Particularly the response of semi-arid forest for predicted climate change seems not fully understood (Pasho, Camarero and Vicente-Serrano, 2012;).
The water storage capacity of the study site, Yatir forest vary across the depth. In order to saturate the layers of 0–20, 0–40 and 0–135 cm 63 depth, 112 and 243 mm of water are needed, respectively. This means that precipitation with frequent and small amount of storm size does not contribute to the deepest soil moisture content (Raz-Yaseef et al., 2010). Higher intensity of rainstorm events, which exceeds the topsoil layer water storage capacity is needed to affect the soil water content of the deepest soil layers. Another study by Preisler et al., (2019) investigated how SWC dynamics affected by soil property (stoniness and rock cover) across soil depth of the tree root zone. These two specific case studies of Yatir Forest the soil water recharge of the deepest soil (Raz-Yaseef et al., 2010) and respective effect of available soil water on tree radial growth (Preisler et al., 2019) wasn’t consistent with precipitation amount. Which mean some years with intermediate annual precipitation attains higher tree radial growth than some other years with higher annual precipitation but give lower tree radial growth. This is because of that prevalence of drought in this semi-arid forest could be a coupled function of precipitation storm pattern and the soil profile characteristics.
The study by Preisler et al., (2019) reported that available soil water for semi-arid Aleppo pine trees, significantly differ based on the soil stoniness and bedrock coverage percent. They found that significant drought stress levels variation at a plot level were explained by soil profile stoniness and bedrock characteristics while there were no physiographic differences, with uniform management practice at the whole study forest level. In their corresponding result, they showed trees of the same plots with a uniform site and management condition showed higher radial growth response for nearly similar annual precipitation in different years. This could be because of seasonal and annual soil water availability for tree growth across different soil depth level might be depending on the combined effect of precipitation pattern and seasonal or annual total precipitation.
The previous studies showed the combined effect of higher ET and slow soil hydraulic conductivity resulted in nonsignificant importance of frequent and small size precipitation showers. Whereas the infrequent and higher intensity precipitation storms which exceed the topsoil layer water storage the deeper soil layer which is less likely affected by evaporation losses. On the other hand, climate change forecasts in parts of the dryland regions forecasted that annual precipitation will decrease while storm events intensity will increase. This intensification can lead to floods and rigorous soil erosion and other environmental damages. The forecasted change of precipitation in the Mediterranean region and other extensive arid and semiarid regions across the globe might have some other benefits from that intense rain event.
2. Objective
2.1 General objective
To examine how precipitation pattern and soil water recharge process affect tree radial growth in the semiarid forest in the face of the predicted climate change
2.2 Specific objectives
To characterize the precipitation pattern of the study site
To examine the soil moisture recharge response /Ecohydrological flux
To evaluate tree radial growth as a response to the observed precipitation pattern
3. Methods
3.1 Study area
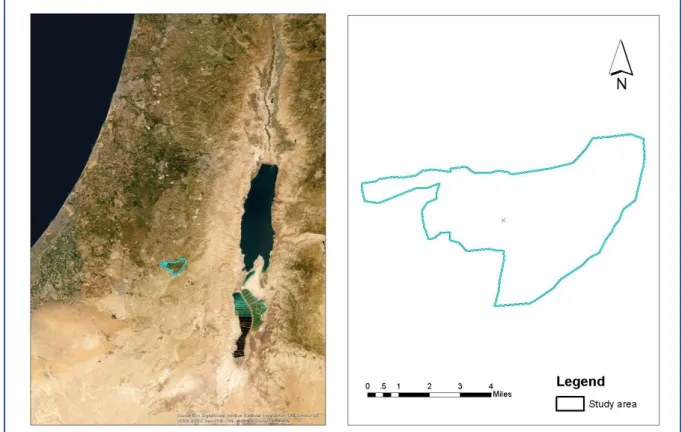
The study was conducted at Yatir forest Research site, which was set up in 2000 at the center of the Yatir Plantation Forest. Most of the plantation forest was planted during 1965-1969 and mainly consists of Pinus halepensis trees (>90%) which covers about 30 km2 area
(https://www.weizmann.ac.il/). This research site established by Ecophysiology Team of Department of Earth and Planetary Science, Weizmann Institute of Science. The research site located at 31°20′N 35°03′E, 550–700 meter above sea level (Grünzweig, Gelfand, Fried, & Yakir, 2007). Yatir Forest is in the transition zone between the sub-humid Mediterranean southern limit and the arid climates along the Judah desert with a mean altitude of 650 m (Raz- Yaseef et al., 2010). After consecutive thinning cycles the forest density today is ~ 300 trees/ha with little understory vegetation (Raz-Yaseef et al., 2010). Average height and DBH for healthy trees of the forest is 11.1 (±1.6)m and 22.1 (±1.5) cm (Preisler et al., 2019)
Figure 1: Location map of the study site Yatir Forest, Israel
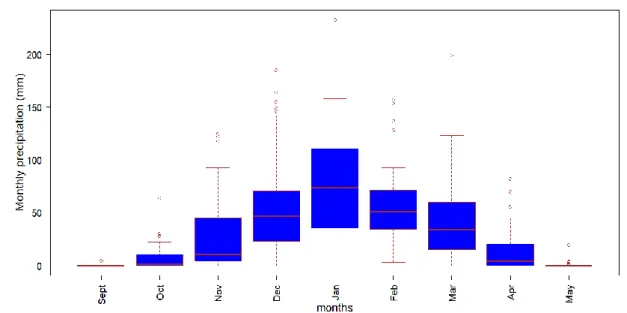
Mediterranean-derived frontal cyclones occur mainly during mid-winter and are typical of low intensity and long duration. Red Sea–derived convective storms are most common during early and late winter and may have high intensity and short duration (Sharon, 1972). Based on the observed years of last five decades the rainy season onset starts during November and ends in March with rare onset on September and secession in May. The peak rainy months are during January and February. Precipitation pattern of the site shows higher seasonal and annual variability with 280 (±80) mm mean annual Precipitation (P) while the estimated potential evapotranspiration (PET) is 1,600 (mm/year), and P/PET is 0.17 (Preisler et al., 2019). Temporal precipitation of the site resulted in two distinct seasons of wet winter lasts about 5 months (November – March) and dry seasons which lasts greater than 6 months.
The geology of the site characterized by shallow light Rendzina (Haploxeroll) soil overlay on porous chalk and limestone bedrock with a deep groundwater table >300 m depth (Grünzweig et al., 2007). Soils of the site is an aeolian-origin loess shallow (20–40 cm) clay-loam texture (31% sand, 41% silt and 28% clay; density 1.65 g cm-3) overlaying a chalk and limestone
bedrock (Yaseef et al., 2010). An ecohydrological water balance study of the site by Raz-Yaseef et al., (2010) shown a nearly balanced 0.94 annual ratio of evapotranspiration (ET) to precipitation while it could be as low as 0.84 during dry years.
3.2 Data structural framework
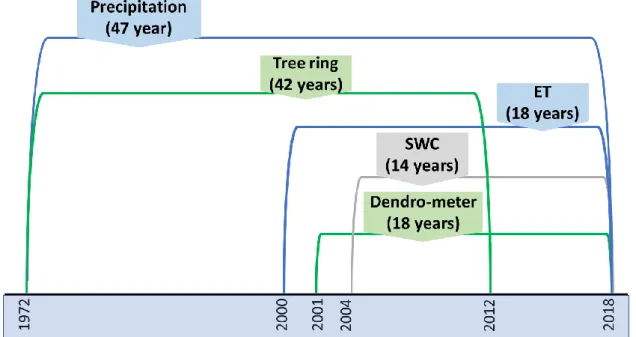
Empirical data were obtained from Yatir Forest research site which was established since 2000. In this research site, intensive data of >300 (Personal communication with Efrat Schwartz Lab Technician, Department of Earth and Planetary Science, Weizmann Institute of Science). variables are under observation with different time scale resolution (most of them observed hourly resolution) to examine the underlying interacting functional relationship between the atmosphere, vegetation and under the soil surface. For this specific study, we used precipitation (P), Soil water content (SWC), Evapotranspiration (ET), tree ring and dendro-meter diameter at breast height (DBH) data sets which were observed for different years as indicated in the data structural framework diagram (fig 2). Correspondingly, meteorological data of temperature (T), relative humidity (RH) and vapor pressure deficit (VPD) has been used to simulate ET and SWC for years before 2000 and 2004, respectively. Long term data of precipitation, humidity and temperature since 1971-2000 were obtained from KKL-JNF Yatir station.
Precipitation data of 47 years (1971-2018) obtained from Yatir station for inter and intra-annual precipitation pattern analysis. There were no missing record values of precipitation during the observation period. Soil water content (SWC) has been measured in the research site since 2004/05 HY up to date. There were missed values of the SWC measurements records for varying length of dates, weeks and months during the observed years (see fig. 3). Hydrologic years of 2011/12 and 2016/17 were considered as a total missing year of measurements. Thus 13 years of volumetric SWC (m3 water per m3 soil) data measured since
2004-2018 were used to characterize the SWC of the research site as a response of the observed precipitation pattern. The volumetric SWC has been measured on a half hour time resolution scale using time domain reflectometry (TDR) sensors (TRIME, IMKO Inc., Ettlingen, Germany). Sensors were installed horizontally in three different pits dug in three locations since 2004-2012 and five locations since 2012-2018. Pits were located arbitrarily to represent the most common soil profile in the research site (Raz-Yaseef et al., 2010; Klein et al., 2014).
Tree ring data were obtained from 10 trees in Yatir forest as described in Preisler et al. (2019). In this study, we used only the live and healthy trees from this study, in order to understand how tree rings data can shed light on the response to different rainfall patterns along the observation HYs (1978/79-2011/12). Using this detailed dataset, of meteorological parameters, SWC and tree response of basal area increment (BAI) (tree core sampling data) allows us to perform a holistic and long-term analysis.
3.3 Data analysis approach and method
3.3.1 Precipitation pattern analysis
3.3.1.1 Precipitation temporal pattern analysis
Soil moisture availability for tree transpiration is the primary decisive tree growth factor in semi-arid forests where photosynthetically available radiation (PAR) is abundantly available and not a limiting factor for tree radial growth. Precipitation regime (pattern) analysis was done to characterize the precipitation pattern of the study site. Precipitation pattern analysis helps to understand how the precipitation pattern affects annual tree growth. Precipitation pattern characterized by annual total amount, temporal pattern analysis (intra-annual and inter-annual) and storm intensity and frequency (NS).
A rainy season defined as it starts in October and ends in May Hence, the hydrologic year considered from October to September. The onset and cessation of the rainy season determined based on analysis of eddy covariance long term measurements. The beginning of the rainy season is defined as the date by which >7 mm of precipitation storm with break no > 24 hours and its end as the date by which the last >5mm storm with no > 24 hours break. The 7 mm threshold was determined since at Yatir forest, during the spring and autumn, this amount is immediately lost through evaporation (Personal communication with Dr. Eyal Rotenberg, Senior Staff Scientist in Department of Earth and Planetary Science, Weizmann Institute of Science). The advantage of this approach is it excludes storms with an insignificant contribution to the soil moisture that lost in terms of interception and evaporation from the surface canopy (Raz-Yaseef et al., 2010).
wet years was done based on mean annual total precipitation as described under section 3.3.2.
Interannual precipitation pattern analysis has been done based on monthly seasonal precipitation and precipitation storm pattern of a HY. Storm classes of <5, ≥5-10, ≥ 10-20, ≥20-30, ≥30-40, ≥40-50 and ≥ 50 mm were used for detailed characterization of storm pattern (amount and frequency) in a HY, frequency and temporal distribution pattern analysis.
Statistical significance of long term linear trends in), number of rainy days (accumulated storm with < 24h and 48h break), monthly and annual precipitation, length of the rainy season (LRS), length of dry season (LDS), and the timing and duration of the rainy season were derived using both the least-squares regression, with the Pearson’s correlation coefficient (Helsel and Hirsch, 2002). Statistical difference was tested for the pattern of precipitation attributes (seasonal and annual amount, NS, LRS and LDS) among dry, intermediate and wet years. Correspondingly, precipitation inter-annual variability was tested by standard deviation, coefficient of variation and interquartile range (IQR) during the observed years. In precipitation pattern analysis median, median absolute deviation (MAD) or interquartile range (IQR) are more robust measures when data deviates from normality. However, mean and SD are more prone to outliers, and they should be interpreted with respect to the underlying distribution. All the statistical tests and precipitation pattern analysis have been done in R studio version 3.5.1.
3.3.1.2 Dry, average and wet years precipitation distribution pattern
The 'wetness' of the years categorized into three classes; dry, intermediate and wet years based on total annual precipitation with >200, 250-300 and >300 mm, respectively. The dry years (<200mm) represents the drought threshold (Preisler et al., 2019) and the future predicted 30 % decrease in mean annual precipitation as parts of the Mediterranean (IPCC, 2007) which corresponds to 200 mm in Yatir (Raz-Yaseef et al., 2010). Wet years for Yatir forest have been defined as years with >300 mm annual precipitation while the average years are intermediate years with 200-300 mm annual precipitation (Raz-Yaseef et al., 2010). Intra annual precipitation pattern of dry, intermediate and wet years was characterized based on storm distribution pattern, LRS, LDS and season or timing of precipitation onset windows and Cessation time. Storm distribution pattern has been analyzed in terms sets of storm classes with the respective number, amount of precipitation and a proportional share of storm classes in both frequency and amount.
3.4 Soil moisture (SWC) analysis
Average values of SWC calculated for two depth range 10-60 cm and 10-90 cm depths during the observed time. The highest proportion of the tree root of the site is confined in the most upper layer where 66% of the root were above 40 cm and 85% above 60 cm (Klein et al., 2014; Preisler et al., 2019). Volumetric SWC has been simulated to extend back for years there weren’t SWC measurement available and to estimate missing records during the observation time. The SWC simulations were carried out using a modified simple 1D “bucket model” described in Preisler et al. (2019) work. Modified 1D “bucket model” following Preisler et al., (2019) applies Equation (1) to estimate SWC change in the targeted soil depth layer.
𝜕𝑆𝑊𝐶(𝑧, 𝑡)
𝜕𝑡 = −
𝜕𝑞(𝑧, 𝑡)
𝜕𝑧 − 𝑅(𝑧, 𝑡) − 𝑓(𝑧, 𝑡) … … … . (01) Where,
q(z,t) is vertical soil water flux, R(z,t) is root uptake,
Description of the earlier version of this model can be referred from Hlaváčiková, Novák, & Šimůnek, (2016) and Novák, Kňava, & Šimůnek, 2011) while a further detailed description of the modified version of the model for our specific study site presented in Preisler et al., (2019).
3.5 Tree ring radial growth analysis
Analysis of tree radial growth in response to the observed precipitation pattern and SWC dynamics has been done. The combined effect of precipitation pattern and the respective soil moisture dynamics on tree growth were tested. Parameters used to characterize precipitation patter were annul P, NS (Total NS, NS >10 mm, NS > 30 mm) with 24 and 48 h break, P with >10 mm storm (P10)and P with > 30 mm (P30, ratio of P10/P and P30/P (Dorman et al., 2015), LRS and LDS. The SWC as a response of the observed precipitation pattern characterized by mean SWC during growing season and length of the growing season (LGS), where LGS is the season of a hydrologic year in which actual volumetric SWC > tSWC. A Multiple Linear Model has been constructed to test the effects of the proposed precipitation and SWC parameters on BAI. The most parsimonious model has been selected according to the Akaike Information Criterion (AIC). Model fitting was done in R studio version 3.5.1 (R Core Team, 2014).
4. Result
4.1 Precipitation amount and temporal pattern analysis
Distribution pattern of annual total precipitation and number of rainy days with ≥ 1 mm precipitation during the observed 47 hydrologic years (1971/72 – 2018/19) is shown by fig. 3. Also, this figure shows the corresponding long-term trend of annual P and NS during the observed years. Long term means annual precipitation was 280 mm with no trend of changes in total annual precipitation. Irrespective of the annual precipitation, the number of rainy days showed a slightly decreasing trend with R² = 0.2 while it wasn’t statistically significant at p <0.05. Both annual total precipitation (SD = ± 87.14mm and CV = 31.16%) and number of rainy days (SD = ± 9.57 days and CV = 29.74 %) characterised by higher inter-annual variability. Intra-annual variability of the precipitation showed extremely higher variability. For instance, the monthly precipitation (fig. 4) characterized by higher variability within the defined rainy season with > 80% CV except for January and February both have about 32% CV.
Figure 3: Trend of long term (1971/72 – 2018/19) total annual precipitation trend and number of days with precipitation ≥ 1m/day
R² = 0.2086
0 10 20 30 40 50 60 0 50 100 150 200 250 300 350 400 450 500 N u m b er o f d ay s with ≥ 1mm P Hydrologic years An n u al p re cipit at ion (m m )
Figure 4: Mean monthly precipitation distribution pattern
The second and detailed precipitation pattern analysis characterizes the precipitation pattern with sets of storm classes accumulated with breaks not > 24 and 48 hours. Long-term trend of precipitation pattern in the number of continuous precipitation storms with < 5mm, regardless of breaks no longer than 24 h (fig. 5) and 48 h (fig. 6) showed significant (p < 0.05) decreasing trend (R2= 0.40). The rest all storm classes with ≥ 5 mm precipitation storm classes
(not presented) doesn’t show sign of either decreasing or increasing trend. The trend of precipitation amounts with the respective storm classes showed a complemental no change of trend with the trend in the NS, as expected. Both the NS and amount of precipitation corresponding storm class have extremely higher inter-annual variable temporal distribution pattern (see fig 5 and 6 for storm classes < 5mm and 5-10 mm storm classes).
Figure 5: Trend of rainfall storm size of Continuous precipitation with breaks no longer than 24 hs
R² = 0.3973
R² = 0.0363
0 5 10 15 20 25 30
Hydrologic years
Fre
q
u
en
cy
o
f
P
in
t
h
e d
eo
th
cla
ss
Figure 6: Trend of rainfall storm size of Continuous precipitation with breaks no longer than 48 h.
Storm distribution pattern of continuous precipitation with breaks no longer than 24 h (fig. 7) and 48 h (fig. 8) shown by proportional share (percentage distribution pattern) of storm number and precipitation amount in each storm category. In both figures, the grey and blue bars stand for storm number and precipitation amount, respectively. For storms with breaks no longer than 24 h the smaller continuous precipitation storm class (<5 mm) accounts about 43% of the total NS, while it accounts only 12 % of the total mean annual precipitation amount. Similarly, for storms with break not > 48 the <5 mm storm class represents 30% of the mean annual NS while it represents only 5% of the mean annual P amount. However, bigger storm class (>50 mm) when continuous precipitation with breaks no longer than 48 h accounts only 1.5 % of the total NS, while it accounts about 16 % of the total mean annual P amount. About 25% of the mean annual P amount contributed by only 5 % of storms in ≥ 50 mm storm size class. This storm class (>50mm) have extremely higher seasonal variability in both the NS and P amount.
Figure 7: Rainfall storm size proportional (%) distribution pattern of continuous precipitation with breaks no longer than 24 h: Grey bar represents the frequency of storm and the blue bar represents the precipitation amount.
R² = 0.2354
R² = 0.0316
0 2 4 6 8 10 12
Hydrologic years
Fre
q
u
en
cy
o
f
P
in
t
h
e d
ep
th
cla
ss
Figure 8: Rainfall storm size distribution pattern of Continuous precipitation with breaks no longer than 48h. Grey bar represents the frequency of storm and the blue bar represents the precipitation amount. Long term trend and variation among dry, average and wet years rainy season onset and secession windows with the corresponding length of the rainy season (LRS) nor length dry season (LDS) are presented by fig. 9 and 10. There weren’t any observed trend of change neither in length of LRS nor LDS within the observed years. Mean annual LRS and LDS were 139 and 226 days respectively. Both LRS and LDS showed high inter-annual variability with similar 29 days of standard deviation and 21 and 13 % of CV, respectively. The overall averaged rainy season onset window during the observed 5 decades was October to mid-November while the secession widows the were end of March (fig 9).
Figure 9: Rainy season onset and secession windows in Yatir station, Israel 1-Sep 1-Oct 31-Oct 30-Nov 30-Dec 29-Jan 28-Feb 30-Mar 29-Apr 29-May 19 71/7 2 19 73/7 4 19 75/7 6 19 77/7 8 19 79/8 0 19 81/8 2 19 83/8 4 19 85/8 6 19 87/8 8 19 89/9 0 19 91/9 2 19 93/9 4 19 95/9 6 19 97/9 8 19 99/0 0 20 01/0 2 20 03/0 4 20 05/0 6 20 07/0 8 20 09/1 0 20 11/1 2 20 13/1 4 20 15/1 6 20 17/1 8 Da te o f P on set and cecc ess io n win do ws Observed years Onset ceccession
Figure 10: Length of rainy and dry seasons (LRS and LDS) in Yatir station, Israel
Annual precipitation of the observed years binned to sets of eight precipitation class with 50 mm range (table 1) to presents the distribution pattern of storm number, dry and wet season length in relation to annual P amount. The NS linearly increase with annual P as it could be expected. But the LRS and LDS didn’t show any relationship with the annual total precipitation (fig 11).
Table 1: Bins of precipitation class of the observed years with LRS, annual precipitation and NS.
Precipitation bin class
Number of years
LRS Mean annual
P NS<30 (24h) NS>30 (24h) NS>10
100-150 3 103.0 144.0 18.3 0.3 6.0
150-200 6 129.8 183.1 23.7 0.5 7.2
200-250 13 129.3 230.6 29.5 1.2 8.5
250-300 7 127.9 275.5 31.3 1.9 10.9
300-350 7 157.4 327.9 32.4 1.9 13.0
350-400 6 145.7 360.2 29.8 3.2 11.5
400-450 3 171.0 419.2 46.7 2.7 13.7
450-500 2 147.0 486.0 42.0 4.5 19.0
Figure 11: Length of rainy season and NS > 10 mm against bins of Annual P classes (binned with 50 mm interval) 30 60 90 120 150 180 210 240 270 300 19 71/7 2 19 73/7 4 19 75/7 6 19 77/7 8 19 79/8 0 19 81/8 2 19 83/8 4 19 85/8 6 19 87/8 8 19 89/9 0 19 91/9 2 19 93/9 4 19 95/9 6 19 97/9 8 19 99/0 0 20 01/0 2 20 03/0 4 20 05/0 6 20 07/0 8 20 09/1 0 20 11/1 2 20 13/1 4 20 15/1 6 20 17/1 8 Leng th o f rai nys an d d ry seas o n (da tes) Observed years
4.2 Precipitation distribution pattern for dry, average and wet years
The observed years (1971/72-2017/18) categorized into dry years (<200mm), average years (200-300mm) and wet years (> 300 mm). Based on this range, out of the observed years 9 dry, 20 average and 18 wet years have been recognized (fig. 12).
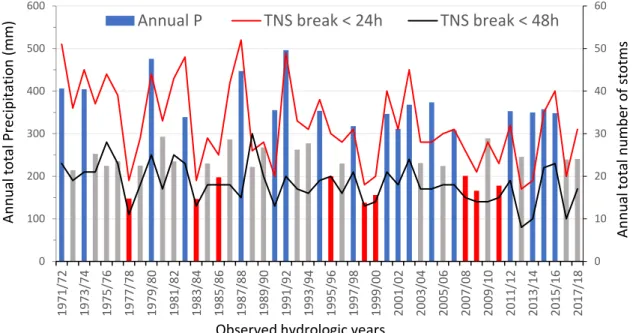
Figure 12: Observed years categorized as dry (red), average(grey) and wet (blue) years with the respective annual precipitation and the total NS
The NS (frequency) in the storm classes and precipitation amount summarized by storms with <30mm and ≥ 30 mm as shown by table 1 for storms with no break > 24h and 48h, respectively.
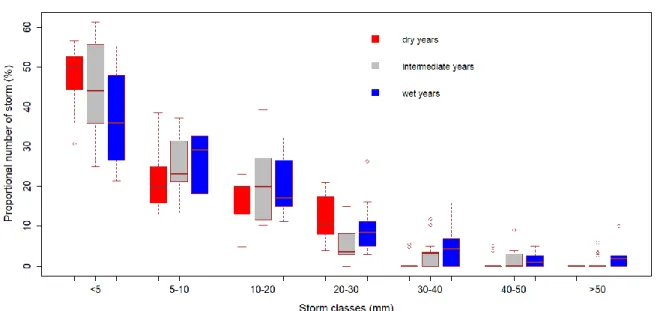
The number of storms proportional distribution pattern for storms with not <24 and 48 h shown by boxplots of fig. 15 and 16, respectively. Correspondingly, fig 17 and 18 shows the proportional distribution of precipitation amounts for both storms with no break > 24 and 48h. In all figures, red, grey and blue bars represent dry, average and wet years, respectively. A comparative clear difference in the NS and P amount have been observed for storms defined as no break >48 h than storms defined as no break >24 h (fig. 17 and 18). For storms defined by no break > 48 h, dry years characterized by higher percentage proportion of small size NS with <30 mm than wet and average years. The reverse is true for storm classes with >30 mm (fig. 18). Storm size classes >30mm accounts only ~10% of the mean annual NS during dry years, while 16 and 22 % on average and wet years, respectively. Most of the observed dry years (8 out of 9) had shorter rainy season < 5 months while most of the wet years had longer rainy seasons of > 5 months (see table 2).
Table 2: Length of rainy season (LRS) distribution pattern among wet, dry and intermediate years
LDS Wet Years Inter. Years Dry years T. #Years
< 90 days (3 months) 1 3 2 6
90-150 days (3-5 months) 5 13 6 24
150-210 days (5-7 months) 12 4 1 17
0 10 20 30 40 50 60 0 100 200 300 400 500 600
1971/72 1973/74 1975/76 1977/78 1979/80 1981/82 1983
/84
1985/86 1987/88 1989/90 1991/92 1993/94 1995/96 1997/98 1999/00 2001/02 2003/04 2005/06 2007/08 2009/10 2011
/12
2013/14 2015/16 2017/18
Ann ua l t o tal nu m ber o f st o tm s Ann ua l t o tal P reci pi tat io n (mm )
Observed hydrologic years
Figure 13: Distribution of the NS (frequency) with no break > 24h and 48h with <30 and ≥30 mm storm category
Figure 14: Distribution of the NS (frequency) with no break > 24h and 48h with <30 and ≥30 mm category
Figure 15: NS with break not > 24 h proportional (%) distribution pattern for dry, intermediate (average) and wet years are shown by red, grey and blue bars, respectively
Figure 16: NS with breaks not > 48h proportional (%) distribution pattern for dry, intermediate (average) and wet years are shown by red, grey and blue bars, respectively
Figure 18: Precipitation amount proportional distribution pattern (%) of storms with breaks no> 48h Description of Dry, Average and Wet years
Descriptive statistics summary table of dry, average and wet years precipitation pattern presented by table 3 that shows mean with ± SEM, standard deviation (SD) and coefficient of variation (CV).
Table 3: Summary table of a descriptive statistics as an ID of dry, average and wet years when the storms have been categorized into storms of < 30 mm and storms of > 30 mm
Dry years Average years Wet years
Parameters Mean SEM (±) CV Mean SEM (±) CV Mean SEM (±) CV
TP (mm) 170.1 6.9 12.29 246.3 3.4 6.1 424.5 11.7 11.7
LRS (days) 127.3 9.92 23.4 130.2 3.4 11.8 162.7 5.9 15.4
LDS (days) 237.7 9.92 12.5 234.9 3.4 6.5 202.3 5.9 12.4
NS, <30, 24h 21.9 0.9 12.6 30.2 2.3 30.7 41.9 1.9 19.4
NS, >30, 24h 0.4 0.2 120.3 1.5 0.3 83.8 3.0 0.3 47.1
TNS, 24h 22.3 0.8 11.2 31.6 1.1 15.9 44.9 1.9 18.0
P, <30, 24h (mm) 153.5 10.8 21.1 196.4 7.7 17.4 310.1 10.4 14.2
P, >30, 24h (mm) 16.6 6.9 113.9 47.3 7.4 69.7 140.5 12.5 37.7
NS, <30, 48 13.4 0.5 10.3 15.9 0.7 18.4 15.4 0.8 20.8
NS, >30, 48h 1.3 0.3 71.3 2.6 0.2 26.5 5.3 0.5 37.4
TNS, 48h 14.8 0.7 14.6 18.5 0.5 12.8 20.7 0.9 17.8
P, <30, 48h (mm) 113.3 6.0 15.9 133.4 3.4 11.3 135.0 6.2 19.4
P, >30, 48h (mm) 56.8 11.2 59.6 124.0 4.4 16.0 256.4 23.7 39.2 NB: PT = Total annual precipitation, P = Precipitation, NS = Number of storms (in the storm class), TNS = total number of storms per hydrologic year
Figure 19: Comparison of the NS (NS), LRS and LDS among dry, intermediate and wet years.
Wet years: Among the observed 47 years, 18 years were wet years (> 300 mm annual
precipitation) with 424 (11.7±) mm mean annual precipitation and 49 (11.7±) average NS per a wet hydrologic year. The year's wetness most importantly determined by the infrequent larger storms (>30mm). For instance, the storms with no > 48h break average NS with >30mm were 1.3 (±0.4), 2.9 (±0.3) and 5.3 (±0.5) with the respective precipitation of 52.2 (±12.8), 139.2 (±7.5) and 256.4 (±23.7) mm for dry, average and dry years, orderly. The highest proportion of the precipitation during wet years obtained from bigger and infrequent storms with extreme inter-annual variability (CV=37.4%). This value tells that wetness of the year and the respective drought stress prevalence in the semi-arid Yatir forest largely depends on the presence or absence of these infrequent and intense storms. When storms defined as no break > 48 h about 66 % of the mean annual P amount during wet years obtained from storms of >30mm which represents <25% of the mean annual NS. Though there is slight variation in terms of length of the dry season and rainy season among dry and wet years it isn’t statistically significant. Wet years have slightly longer rainy season and shorter length of the dry season when compared to both average and dry years.
Intermediate /Average/ years: These are years with intermediate annual P ranging between
200-300mm. Out of the observed 47 years, 20 of them gain annual P of the intermediate years range with 246.3 (±3.4) mm mean P and 31.6 (±1.1) mean NS (when no break > 24h). As a name of the class ‘intermediate’ indicates it is class characterized by an intermediate value of P, NS, LRS and LDS (Table 2). Intermediate years doesn’t show any statistically significant difference in terms of NS, LRS and LDS (fig 19).
Dry years: Out of the observed 47 years there were 9 critically dry years with < 200 mm annual
and wet years while there was no significant difference with intermediate years. A higher proportion of small size storm observed during dry years as compared to wet years.
4.3
Soil water content
Averaged depth of 10-60 cm and 10-90 cm SWC determined from the observed SWC (fig. 20 and 21) and simulated SWC (fig 21 and 22). Observed years SWC was used to determine the length of growing season precisely where the growing length was considered as seasons during which SWC > threshold SWC (tSWC). The tSWC is a limit below which no availability soil water for tree transpiration. Determined date of onset for SWC (actual SWC > tSWC) and crossing date (SWC < tSWC) for the observed hydrologic years are summarised by table 4. Complementary, simulated SWC (fig 20) were used to estimate missing hydrologic years within the observation period (2011/12 and 2016/17) and non-observed years of 2001-2004 which were a cluster of good wet years.
Table 4: Summary table of soil moisture onset and crossing date during the SWC observation HYs (Yellow shaded HY are simulated years)
Observed hy-drologic years
SWC date of onset (SWC > tSWC)
SWC crossing date (SWC < tSWC)
Length of tree transpiration SWC availability (SWC > tSWC)
2000/01 13-Dec 25-May 163
2001/02 01-Dec 27-May 177
2002/03 11-Dec 18-Jun 189
2003/04 19-Dec 10-Apr 112
2004/05 22-Nov 01-May 160
2005/06 16-Feb 25-Mar 37
2006/07 01-Jan 15-Apr 104
2007/08 31-Jan 29-Mar 57
2008/09 01-Mar 18-Apr 48
2009/10 19-Jan 01-Mar 41
2010/11 01-Feb 24-Mar 51
2011/12 19-Jan 09-May 110
2012/13 08-Jan 26-Apr 108
2013/14 12-Dec 18-Apr 127
2014/15 11-Jan 03-Apr 82
2015/16 01-Jan 20-Apr 109
2016/17 14-Dec 25-Apr 132
2017/18 05-Jan 30-Mar 84
Figure 20: Observed hydrologic years mean monthly SWC for the averaged depth of 60mm and 10-19 mm depths with respective monthly precipitation (mm)
Figure 22: Integrated graphs of Observed and Simulated SWC for the upper 10-60 cm depth from 2001 to 2018
The pattern of the length of the growing season during the observed hydrologic years showed a clustered pattern of dry and wet years (fig. 21 and 22). For instance, the years 2000/01-2004/05 were clusters of good wet years while year 2005/06 to 2010/11 was clusters of non-good years where were three critical dry years contained in this cluster years (fig. 23 (a)). Raising of the SWC for the depth below 10 cm mainly relies on the intense storms (fig 23 (b)). Particularly during the start of the rainy season, smaller intensity storms (< 10 mm) doesn’t have a substantial role to raise the SWC above the tSWC unless it happens for consecutive days (e.g. see fig. 24 (b) 2006/07, 2008/09 HY and (c) 2015/16 HY). Monthly distribution pattern of bigger storms has critical controlling importance to determine the growing season length.
Figure 23: Cluster of good wet years (longer growing season) and bad dry years (shorter growing
season). (a) shows good wet years with extended growing season and SWC raises above 0.3 m3/m3
during peak seasons (b) shows clusters of bad years with very short growing and SWC doesn’t raise
above 0.25m3/m3 during peak time.
0.1688 0 10 20 30 40 50 60 70 80 0 0.1 0.2 0.3 0.4
14-Oct-00 14-Oct-01 14-Oct-02 14-Oct-03 14-Oct-04 14-Oct-05 14-Oct-06
Daily P (mm ) SW C (m 3/m 3)
mSWC 10-60cm (m3/m3) Rain sSWC 10-60cm (m3/m3) tSWC
0.1688 0 10 20 30 40 50 60 70 80 0 0.1 0.2 0.3
14-Oct-04 14-Oct-05 14-Oct-06 14-Oct-07 14-Oct-08 14-Oct-09 14-Oct-10
Daily P (mm ) SW C (m 3/m 3)
(b)
0 10 20 30 40 50 60 70 80 0 0.1 0.2 0.3 0.414-Oct-10 14-Oct-11 14-Oct-12 14-Oct-13 14-Oct-14 14-Oct-15 14-Oct-16 14-Oct-17 14-Oct-18
Daily P (mm ) SW C (m 3/m 3)
Observed hydrologic years
(a)
The number of bigger size storms (at least >10 mm) and their monthly distribution within the hydrologic years directly determine the length of growing season though governing the date of SWC onset and crossing date.
Volumetric SWC variation among years explained by the precipitation pattern characteristics. The total annual P is an obvious attribute of the precipitation pattern which governs soil water dynamics. But, in our semi-arid study site (Yatir Forest) the number of bigger storms and their monthly distribution within the hydrologic years are an important precipitation pattern attribute to control the SWC dynamics (fig. 24). Some years have high annual P with a higher NS with a low contribution to SWC change (fig. 24, a), while other some years have high annual P only from few bigger storms which have a higher influence on SWC change (fig 24, b). Comparison of 2013/14 and 2014/15 hydrologic year (HY) are used to show the effect of the bigger but infrequent NS on SWC dynamics of a given HY. These two HYs (2013/14 and 2014/15) have nearly similar annual P of 350 and 357 mm, respectively. Also, there is not much difference in terms of LRS with 49 and 167 days for 2013/14 and 2014/15 HY, respectively. The comparison of measured SWC (mSWC) at the averaged depth of 10-60 and 10-90 cm (fig 24 a and b) clearly exemplify the effect of the number of infrequent big storms and their monthly distribution on SWC dynamics. The 2013/14 hydrologic years had longer growing season while it has a significantly small NS and slightly lower annual P and LRS.
Figure 24: Measured SWC (mSWC) of the averaged depth 10-60 and 10-19 mm for hydrologic years (HY) of 2013/14 and 2014/15. (a) mSWC of 2013/14 HY with 350 mm annual P from only 19 storms ; (b) mSWC of 2014/15 HY with 357 mm annual P from 35 storms most of which < 10 mm.
An averaged SWC at the depths of observation presented by fig. 25 to show the seasonal SWC dynamics of the observed hydrologic years. The averaged values at each depth during the observation time clearly show SWC of depths below 40 cm respond very delayed to the start of the rainy season. Tree transpiration water budget depends on the upper soil layer above 40 cm depth. Even though the SWC at 70 cm depth does not decrease below the tSWC, 85 % of the tree root contained on the depth > 60 cm. Which mean the depth below 60 cm can play minimal importance to support tree transpiration and active growth. Depth of 15 cm and 30 cm which represents 10-20 cm and 20-40 cm depth layers, respectively maintain the availability of tree transpiration water for the spring season. The averaged SWC seasonal pattern in the critical tree root zone 10-40 cm depth implies that February and March are the most active tree growing months of the year in the study site.
Figure 25: Average SWC at each depth of measurements (5cm, 15 cm, 30cm, 50cm, and 70 cm) during the observed hydrologic years
The averaged mean SWC dynamics characterize the dry, intermediate and wet years. Out of the observed 14 HY there were 5 wet, 5 intermediate and 3 dry years. There was no SWC measurement for 2011/12 HY which is totally missed. The weighted mean of mSWC for depth 10-60 cm for wet, intermediate and dry years is shown by fig. 26 a, b, and c, respectively. The dynamics of weighted mean SWC in the main tree root zone (10-60 mm) depicts on average for how long tree transpiration water available during wet, intermediate and dry years (fig. 26). On average, wet years maintain the SWC > tSWC for more than 4 months while intermediate years for ~2 months and dry years for ~1 month. Also, the average available volumetric SWC during peak rainy season rises > 0.25 m3/m3 only during wet years.
16.1
0 5 10 15 20 25
1-Oct 1-Nov 1-Dec 1-Jan 1-Feb 1-Mar 1-Apr 1-May 1-Jun 1-Jul 1-Aug 1-Sep
SWC
(%
)
Date (2013/14)
M.SWC05 M.SWC15 M.SWC30
M.SWC50 M.SWC70 tSWC threshold
0 0.05 0.1 0.15 0.2 0.25 0.3
01-Oct 01-Nov 01-Dec 01-Jan 01-Feb 01-Mar 01-Apr 01-May 01-Jun 01-Jul 01-Aug 01-Sep
SW
C
(m
3
/m
3)
Days of a hydrologic year
Wet years average
mSWC 10-60cm (m3/m3) mSWC 10-90cm (m3/m3) tSWC
Figure 26: Average volumetric SWC of wet (a), intermediate (b) and dry (c) years for the weighted mean depth of 10-60 cm, which is the main tree root zone.
4.4 Tree ring radial growth analysis
Relationship between tree radial growth (cm2) and precipitation shown by fig. 27. Most of the observed precipitation attributes used to characterize the study site precipitation pattern were significant to tree radial growth (table 5). The observed response of tree radial growth showed a significant relationship (P=0.001). However, the availability of tree transpiration water is the most important predictor of the tree radial growth (significant at 0.001). As explained in section 4.2, SWC dynamics and the respective LGS in the study area depends on the precipitation pattern as importantly as annual P. For instance, during the observed years the highest tree radial growth was recorded during the clustered years of 2000/01-2001/05. These years characterized by longer LGR (fig. 28) as a response of higher proportion of big storms (>10 mm) which were distributed for >4 consecutive months in the rainy season of each hydrologic years. In response to the P pattern, the good years and bad years for tree radial growth showed sorts of a clustered pattern.
0.1688
0 0.05 0.1 0.15 0.2 0.25 0.3
01-Oct 01-Nov 01-Dec 01-Jan 01-Feb 01-Mar 01-Apr 01-May 01-Jun 01-Jul 01-Aug 01-Sep
SW
C
(m
3
/m
3)
Intermediate years average
mSWC 10-60cm (m3/m3)mSWC 10-90cm (m3/m3) tSWC
0.161
0 0.05 0.1 0.15 0.2 0.25 0.3
01-Oct 01-Nov 01-Dec 01-Jan 01-Feb 01-Mar 01-Apr 01-May 01-Jun 01-Jul 01-Aug 01-Sep
SW
C
(m
3
/m
3)
Days of a hydrologic year
Dry years average
mSWC 10-60cm (m3/m3) mSWC 10-90cm (m3/m3) tSWC
(b)
Figure 27: Tree radial growth plotted against the annual P of observation HYs.
Figure 28: Pattern of tree radial growth (BAI) with reference to annual P (red=dry years, blue grey=intermediate years and blue=wet years), NS > 10 cm and LGS as it represents length of seasonal duration between SWC onset and crossing data within a HY.
The overlay of precipitation parameter (e.g. P and NS) and soil moisture data show a general positively correlated trend. However, there were two outlier years (1987/88 and 1991/92) with higher P resulted in a smaller tree BAI response. This might be attributed to the low temperature of the growing season of these specific years. All precipitation parameters, LRS, LDS and LGS (the SWC parameter) were statistically significant. But in multiple linear regression except for LDS, all the rest parameters which were used as initial candidate predictors were correlated (Appendix 3). Appendix 3 presents the multicollinearity test plots. Selection of the most parsimonious model for tree growth based on the AIC value ranked in table 5. Based on this the annual P remains the best predictor of the tree radial growth of the study site. 0 100 200 300 400 500 600
1979 1980 1981 1982 1983 1984 1985 1986 1987 1988 1989 1990 1991 1992 1993 1994 1995 1996 1997 1998 1999 2000 2001 2002 2003 2004 2005 2006 2007 2008 2009 2010 2011 2012
0 2 4 6 8 10 12 14 16 An n u al Prec ip ita tio n (c m ) Observation years BAI (cm 2)
Precip. L-H plot mean
0 5 10 15 20 25 30 0 100 200 300 400 500 600 N S> 10 , B AI d at es o ve r tSWC, an n u al P
Observed hydrologic years
Table 5: Rank of tree growth model based on AIC criterion
No. Model AIC Intercept Coefficient SE Pr(>|t|) R2 1 (log (BAI.H) ~ P) -14.33 1.71 0.001679 0.000386 0.00014 *** 0.3582 2 (log (BAI.H) ~ P10.24) -12.62 1.83 0.001724 0.000426 0.000324*** 0.3242 3 (log (BAI.H) ~ log (LGS)) -8.23 0.11 0.46972 0.07208 6.75e-05*** 0.7904 4 (log (BAI.H) ~ log (LDS)) -4.62 5.63 -0.637 0.2567 0.0187 * 0.1388 5 (log (BAI.H) ~ LDS) -3.99 2.79 -0.00268 0.001147 0.0262 * 0.1221 6 (BAI.H ~ LGS) 40.9 4.62 0.048111 0.005991 1.14e-05*** 0.8523 7 (log (BAI.H) ~ LGS) 44.01 1.69 0.005122 0.000718 3.19e-05*** 0.8087 8 (BAI.H ~ log (LGS)) 44.011 -10.01 4.379 0.6354 4.24e-05*** 0.8087 9 (BAI.H ~ P) 133.47 4.77 0.015493 0.00363 0.00017*** 0.3499 10 (BAI.H ~ log(P)) 134.66 -13.24 3.999 0.985 0.000309*** 0.3261 12 (BAI.H ~ log (LDS)) 142.6 41.61 -6.007 2.389 0.0173* 0.1426 13 (BAI.H ~ LDS) 143.3 14.79 -0.02 0.01069 0.0251 * 0.1243
5
Discussion
5.1
Precipitation pattern
During the observed five decades (47 years) there was no statistically significant change in the annual P. The observed none statistically significant and very slightly negative trend in our study site is consistent with Ziv et al., (2014). However, this result is not consistent with the climate forecast that predicted a decrease in it and an increase in storm intensity (IPCC, 2007, Lionello and Giorgi 2007; Guzman, Chu, Steiner, & Starks, 2018). In agreement to our result, another study by Dorman et al., (2015a) in Lahav and Dvira orests in semi-arid regions of southern Israel reported there was no change in annual P. This is not consistent with the Intergovernmental Panel on Climate Change (IPCC, 2007) reported a worldwide increase in the frequency of extreme rainstorms in arid and semi-arid regions as a result of global warming, which was not a case in our study site. A very comprehensive P pattern and historical trend (1975-2010) analysis for the entire Israel region has been done by Ziv et al., (2014) employing P data from 919 meteorological stations. In their analysis, they observed a negative trend in the majority of the stations while only in the super-arid region a statistically significant precipitation decreasing trend was observed. A similar study of annual P trend analysis in arid and semi-arid regions of Iran based on 36 years data from 79 stations doesn’t find significant decreasing trend (Raziei, Arasteh, & Saghfian, 2005). The higher inter-annual variability of the annual P in such arid and semi-arid regions might make it difficult to detect the time series trend of change(Dorman et al., 2015a; Hottenstein, Ponce-Campos, Moguel-Yanes, & Moran, 2014; Ziv et al., 2014).
Giardina, & Bruland, 2015). These small storms represent a higher proportional (percentage) of the annual P storm frequency (38 % in dry years and 52% during wet years). This storm class (< 5 mm) contribute < 10% of the annual P and it can be as low as 5% during wet years. Thus, the significant decrease in the number of < 5 mm storms wasn’t reflected in the annual P trend. Correspondingly, P is much lower than the potential evapotranspiration (PET) of the study site (Yaseef et al., 2010). In this area P from lower storms attributed to evaporation from interception and soil evaporation.
Time of rainy season onset, secession period, corresponding LRS and LDS are other good variables of inter-annual P variability and trend of change in annual P (Dorman et al., 2015a; Ziv et al., 2014) with important environmental implications for agriculture and ecosystems ( Ziv et al., 2014). In our study site, we observed a very slight and none statistically significant delaying trend of the rainy season onset window. But there was not any sign of the trend of change in the secession period of the rainy season (fig. 9). Correspondingly, there was no significant trend of change in LRS and LDS. Over there was no significant change of trend in all P attributes except the number of smaller storm class (storms < 5mm). These smaller and frequent storms might not have a significant role in changing the SMC dynamics during the beginning of the rainy season (autumn) and secession period (spring). But, frequent and small storms would be useful in maintaining the topsoil moisture during the main rainy season (winter period) where comparatively the seasonal ET is lower (Wang, Fu, Gao, Yao, & Zhou, 2012).
5.2
Soil water content (SWC) dynamic as a response to the observed P pattern
The observed variation in the proportional composition of bigger and infrequent storm size among dry and wet years coupled with annual P variability influences the tree transpiration water availability. The observed higher temporal variability of P pattern during the last five-decade years could be the main cause for drought than the predicted negative trend of change in annual P. Water is the main tree growth controlling factor (Dorman et al., 2015b; Klein et al., 2014; Olivar et al., 2012; Preisler et al., 2019). Annual and seasonal P variability of arid and semi-arid areas causes the recurrent drought in which vegetation suffer moisture stress. A number of studies from different regions of the globe reported that annual and seasonal P temporal distribution pattern is the main driver of drought in arid and semi-arid ecosystems (Assefa, Biazin, Muluneh, Yimer, & Haileslassie, 2016; Raziei et al., 2005; Swaffer, Holland, Doody, & Hutson, 2014; Wang et al., 2012). In our specific study site, we observed a cluster pattern of wet years and dry years. This might be a severe threat to tree growth decline and tree mortality. In the same study site, the study by Preisler et al., (2019) found extensive mortality of trees in a patch of plots.
Significant tree mortality was recorded during 2009/10 preceded by 2 extreme dry hydrologic years of 2007/08 and 2008/09. In the same stud, they showed that prior lethal drought stress triggers the process about 25 years earlier and exposed to other successive lethal drought incidence years. Which mean recurring of a successive cluster of dry years make a very harsh soil water shortage and expose the trees to severe water stress for a prolonged period. The ecohydrological water balance of the study site studied by Raz-Yaseef et al., (2010) while it depended on only 4-year data. They reported that HY with < 300 mm annual P have a negative hydrologic water balance (P-ET). The successive dry years can deplete the soil water beyond the normal average and that leads the trees to suffer consecutive severe water stress years. On the other hand, wet years (> 300 mm annual P) resulted in soil water storage (which could be reserved to the next HY) and release of water to subsurface flow (Raz-Yaseef et al., 2010).
> 10 mm are important characteristics of P that determine the SWC dynamics of a given HY (fig. 24). Soil moisture of semi-arid areas reflects the balance of precipitation and ET and exhibited various types of pulse events(Hottenstein et al., 2014; Li, Liu, Zhang, & Zheng, 2011; 2010; Wang et al., 2012). Which mean evaporation (Raz-Yaseef et al., 2010; Wang et al., 2012) and soil water conductivity and soil water storage property (Klein et al., 2014; Preisler et al., 2019) are key factors determining the soil moisture content at fine scales Small rainfall events affect only the uppermost 1 cm of the soil, and the soil moisture was therefore mainly contributed by the bigger storm events while the smaller storms affect only the uppermost soil surface during peak rainy season .
5.3
Tree radial growth
The pattern of P is an important controlling factor of soil water dynamics in arid and semi-arid ecosystems (Dorman et al., 2015b; Su et al., 2012; Ziv et al., 2014). We found that most of the P variables including annual P, NS, LRS and P of storms > 30 mm (when break not > 24h) were positively and significantly correlated with the trees annual BAI. However in another study by Dorman et al., (2015a) LRS and LDS reported none significant relationship with annual BAI of trees. This might be due to that their study was in a relatively wetter region. Influence of intra-seasonal P pattern and variability on tree growth response varies depending on the regional location and ecosystem type (Attolini et al., 1990; Olivera-Guerra et al., 2014; Pasho et al., 2012). Though annual P was the best growth predictor P variable, the observed BAI (fig. 28) doesn’t show a uniform trend with the annual precipitation.
This shows that tree growth response in the arid and semi-arid forest is a complex underlying functional relationship between P pattern, PET of the site and soil water conductivity and storage capacity (Dorman et al., 2015b; Hayden, Greene, & Quesada, 2010; Klein et al., 2014; Merine, Rodríguez-García, Alía, Pando, & Bravo, 2015; Preisler et al., 2019). Hence, a change in the P pattern as of the climate prediction could have an impact on tree growth. For instance, our result showed that the highest difference between dry and wet years average annual P comes from the very few bigger and infrequent storms with > 30 mm where dry years receive 16 mm from an average of 0.4 storms per dry years and wet years receive 141mm from the only average of 3 storms per wet years. Which mean an increase in only a few numbers of bigger intense storms with a strong influence on a deeper SWC will positively affect the tree radial growth. But if the increase in intense storm associated with a decrease in annual P as of the climate forecast (IPCC, 2007), the higher inter-annual variability (> 100% CV) in the number of bigger storms will cause more frequent dry years.
According to our result and also supported by other studies in the region (Raziei et al., 2005; Ziv et al., 2014) still there are no strong and statistically significant evidence for a decrease in annual P or an increase in intense storms. This needs future studies to examine the prevalence and probability of a decrease in annual P amount and the corresponding trend of change in storms intensity and frequency in the region.
Conclusion and recommendations
The temporal P pattern of the study area characterized by higher annual variability CV=36% and seasonal variability CV = 70% during January and > 150 % during months of the dry seasons. There was no significant trend of change in annual P, LRS and LDS while the number of small and frequent storms significantly (p = 0.01) decrease during the observed last ~5 decade years.