How has European Monetary Policy changed since the creation of the ECB? : estimation of a Taylor Rule for the EMU (1991 2005)
24
0
0
Texto completo
(2) How has european monetary policy changed since the creation of the ecb? Estimation of a taylor rule for the emu (1991-2005). WORKING PAPERS The Institute of Social and Economic Análisis (Servilab) edits Working Papers, where are included advances and results of some research projects done as part of the research done by the Institute’s staff and other researchers in colaboration with the Institute. Those Working papers are available in : http://www.servilab.org/iuaes_sp/publicaciones.htm. ISSN:. 1139-6148. LATEST WORKING PAPERS WP-1/05 THE INCREASING RELEVANCE OF THE STOCK MARKET IN THE WORLD: A NEW SCENARIO. Antonio Torrero Mañas WP-2/05 SECTORIAL STRUCTURE, QUALIFICATION CHARACTERISTICS AND PATTERNS OF LABOUR MOBILITY. Carlos Iglesias Fernández y Raquel LLorente Heras. WP-3/05 GROWTH AND PRODUCTIVE DYNAMISM OF BUSINESS SERVICES: EU15, SPAIN AND THE REGION OF MADRID. Antonio García Tabuenca y Fernando Coral Polanco. WP-4/05 OWNERSHIP AS A DETERMINING FACTOR IN THE EVOLUTION OF EFFICIENCY Nuria Fernández Conejero. WP-5/05 LAS DIFERENCIAS REGIONALES EN EL BIENESTAR: UN ANÁLISIS DESDE LA PERSPECTIVA DEL OCIO Patricia Gabaldón Quiñones, Elena Mañas Alcón y Rubén Garrido Yserte. WP-1/06 ¿SE ESTAN DESLOCALIZANDO LOS SERVICIOS EXTRANJEROS EN ESPAÑA? Marta Muñoz Guarasa. WP-2/06 EL IMPACTO DE LAS TIC EN LAS FAMILIAS Federico Pablo Martí, Elena Mañas Alcón y Juan Ramón Cuadrado Roura. Institute of Social and Economic Analysis Plaza de la Victoria, 1. 28802. Alcalá de Henares. Madrid - Telf. (34)918895703 Fax (34)91889 8646 E-mail: [email protected] WEB: www.servilab.org. Institute of Social and Economic Analysis Working paper 03/2006 , 24 pages, ISSN: 1139-6148. 2.
(3) How has european monetary policy changed since the creation of the ecb? Estimation of a taylor rule for the emu (1991-2005). HOW HAS EUROPEAN MONETARY POLICY CHANGED SINCE THE CREATION OF THE ECB? ESTIMATION OF A TAYLOR RULE FOR THE EMU (1991-2005) ABSTRACT: This paper aims to use a Taylor Rule to characterise the monetary policy applied by the ECB and to test whether there are significant differences compared to the monetary policy applied in the previous years by the central banks of the 12 countries currently forming part of the EMU. We see that the Taylor rule estimated to characterise the 1991-1998 period does not correctly reflect the behaviour of the ECB and a Chow test confirms the existence of a structural change from that date on. This change supposes a reduction in the neutral real interest rate and a change in the rule’s coefficients, with an increase in the output gap coefficient and an important decrease in the response to inflation deviations. Another result derived from our estimates is that interest rates are associated to a high level of inertia. However, the introduction of other variables into the rule, such as the Federal Reserve interest rate, variation in the real euro-dollar exchange rate or deviation of the M3 growth rate from the reference value established by the ECB, is of little significance when explaining interest rate variations. KEY WORDS: monetary policy, EMU, interest rate. RESUMEN: El objetivo de este artículo es utilizar la Regla de Taylor para caracterizar la política monetaria aplicada por el BCE y contrastar si se aprecian diferencias importantes respecto a la política monetaria aplicada en los años anteriores por los bancos centrales del conjunto de los 12 países que constituyen actualmente la UEM. Hemos obtenido que la regla de Taylor estimada para caracterizar el periodo 1991-1998 no recoge bien el comportamiento del BCE y un Test de Chow confirma la existencia de un cambio estructural a partir de esta fecha. Este cambio supone una reducción del tipo de interés real neutral y un cambio en los coeficientes de la regla, con un aumento del coeficiente del output gap y una importante caída en la respuesta a las desviaciones de la inflación. Otro resultado que se deriva de nuestras estimaciones es que los tipos de interés registran un elevado grado de inercia. En cambio, la introducción en la regla de otras variables como el tipo de interés de la Reserva Federal, la variación del tipo de cambio real euro-dólar o la desviación de la tasa de crecimiento de M3 respecto al valor de referencia establecido por el BCE, resultan ser poco significativas para explicar las variaciones del tipo de interés. PALABRAS CLAVE: política monetaria, UEM, tipos de interés JEL: E52, E58.. AUTHORS: MARIA JESUS ARROYO FERNANDEZ, Lecturer of Economy Policy, University San Pablo CEU ([email protected]) JORGE UXO GONZALEZ, Lecturer of Economy Policy, University San Pablo CEU ([email protected]) ROMAN MINGUEZ ([email protected]). SALIDO,. Lecturer. Institute of Social and Economic Analysis Working paper 03/2006 , 24 pages, ISSN: 1139-6148. of. Econometric,. University. San. Pablo. CEU. 3.
(4) How has european monetary policy changed since the creation of the ecb? Estimation of a taylor rule for the emu (1991-2005). Universidad San Pablo-CEU. INDICE. 1. Introduction............................................................................ 5 2. The period prior to the ecb: 1991-1998...................................... 6 3. The period following the creation of the ecb: 1999-2005 .............11 4. Introduction of other variables .................................................16 5. Conclusions: how to interpret the results...................................21 6. Bibliographic ..........................................................................24. Institute of Social and Economic Analysis Working paper 03/2006 , 24 pages, ISSN: 1139-6148. 4.
(5) How has european monetary policy changed since the creation of the ecb? Estimation of a taylor rule for the emu (1991-2005). 1. INTRODUCTION. T. he primary objective of this paper is to use a Taylor Rule1 to characterise the monetary policy applied by the ECB since it was established in 1999 and to test whether there are significant differences compared to the monetary policy applied in the previous years by the central banks of the 12 countries currently integrated in the EMU. One initial difficulty is the fact that, prior to 1999, there was not a single central bank but 12 different institutions independently applying their monetary policies while attempting to comply with the foreign exchange stability commitments established in the EMS. It is therefore common to find other papers in the literature referring to a “fictitious” central bank representing the mean of the actions taken by all the central banks pertaining to EMU countries. For instance, Gerlach and Schnabel (2000) estimate a Taylor Rule with the mean values of the EMU countries (except Greece and Luxembourg) during the 1991-1998 period, concluding that “average interest rates…, with the exception of the period of exchange market turmoil in 1992-93, moved very closely with average output gaps and inflation, as suggested by the Taylor Rule”. In the first part of this paper, we refer to the aforementioned article to analyse whether the same rule estimated by this procedure for the 1991-1998 period can adequately describe the subsequent behaviour of the ECB or, otherwise, identify the primary changes that have occurred. In the second part we will analyse whether other additional variables are required to explain the single monetary policy. A comparison between the Taylor rule obtained before and after 1999 can have important normative consequences, since the values of the coefficients representing the authorities’ reaction to the deviations of inflation from its target and of income from its long-tern equilibrium level provide us with information about the monetary policy applied by the ECB. These coefficients specifically enable us to analyse two main issues: Both the independence granted the ECB and the explicit mandate established in the EU Treaty to give priority to price stability, generated the opinion that the European monetary authorities would apply their monetary policy by responding very actively to. 1 Taylor (1993). This rule establishes that central banks attempt to stabilise inflation and income – around their potential values – by means of the nominal interest rate. They specifically increase the interest rate above its “neutral” value (in the sense that it maintains the economy at its potential production value and, therefore, with a constant inflation rate) when the inflation rate rises above its target value or when the output gap is positive. Symmetrically, they reduce the interest rate beneath the neutral value when the opposite occurs.. Institute of Social and Economic Analysis Working paper 03/2006 , 24 pages, ISSN: 1139-6148. 5.
(6) How has european monetary policy changed since the creation of the ecb? Estimation of a taylor rule for the emu (1991-2005). inflation variations, but much less so to variations in income. Indeed, the most decisive action taken by the Federal Reserve after the deceleration process that started in 2001 appeared to confirm that the ECB was less activist. A comparison between the rule’s coefficients before and after 1999 will enable us to verify this or not. For monetary policy to stabilise inflation, the nominal interest rate has to increase more than proportionally if inflation grows, so the real interest rate also rises. This is known in the literature as the “Taylor Principle” and it represents a value greater than 1 in the inflation coefficient in the monetary policy rule. Up to 1999, the empirical evidence shows that this principle was effectively the case and one of our objectives is to verify whether it continues to be applicable after that date. In addition to these two questions relating to inflation and output gap coefficients, as we mentioned earlier, in the second part of the paper we will be estimating a monetary policy rule including other variables. This part of the paper has a dual purpose; on the one hand, to rule out a possible poor specification of the model derived from failing to include relevant variables, and, on the other, to test certain hypotheses relating to the behaviour of central banks. In particular, we will be including the following additional variables: The interest rate in the previous period, to test the hypothesis that central banks respond gradually to changes in inflation and income. The M3 growth rate, to verify the significance of the monetary pillar of the ECB’s strategy in its decisions concerning the interest rate. Finally, the euro/dollar exchange rate and the Federal Reserve’s interest rate, to test for possible interdependence between the monetary policies of the EMU and the United States.. 2. THE PERIOD PRIOR TO THE ECB: 1991-1998. A. s we have already mentioned, this paper refers to the estimation of the Taylor Rule for the EMU performed by Gerlach and Schnabel (2000). Since the monetary union itself did not then exist, and there were in fact 12 monetary policies, these authors used mean2 quarterly inflation (from the national consumer price indices) and output gap (interpolating the data provided by the OECD in order to obtain quarterly. 2. Weighted by the 1990 GDP of each country.. Institute of Social and Economic Analysis Working paper 03/2006 , 24 pages, ISSN: 1139-6148. 6.
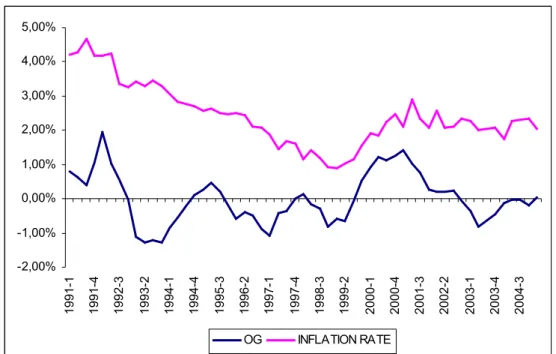
(7) How has european monetary policy changed since the creation of the ecb? Estimation of a taylor rule for the emu (1991-2005). frequency) data for the EMU countries. The interest rates taken as references of monetary policy were the mean three-month rates. The simplest expression of the Taylor Rule is provided by the following equation:. (. ). itT = r + P& OBJ + β 1 P&t − P& OBJ + β 2 OGt. (1). Where itT is the nominal interest rate to be established by the central bank according to the Taylor Rule, r is the real neutral interest rate, P& OBJ is the inflation rate established by the central bank as its target and β1 y β2 represent, respectively, the variation in the nominal interest rate for each percentage point of change in inflation ( P&t ) and the output gap ( OGt ). Simplifying, we can obtain the following equation, estimated by Gerlach and Schnabel with the above data:. it = α + β 1 P&t + β 2 OGt + u t. (2). Where:. α = r + (1 − β 1 )P& OBJ. (3). The results of their estimation are shown on Table 1, where we can see that the estimated coefficients are not substantially different from those proposed by Taylor (1993), which in this formulation of the rule would be 1.5 for inflation and 0.5 for the output gap. On the other hand, to correct the extraordinary effects of the 1992-93 EMS crisis, when interest rates where exceptionally high, these authors introduced dummy variables for quarters 1992:3 to 1993:3, all of which are significant except for the last quarter. The value of the real neutral interest rate is 3.56%, obtained from estimating the constant in (2) and expression (3). This figure is close to the value that they had previously calculated based on the hypothesis that the equilibrium rate must be close to the mean interest rates recorded during the period after discounting the upwards effects of the possible lack of credibility of some European central banks at the time. In order to increase the homogeneity in the rest of this paper, we have also estimated the same equation (2) for this period, but using the aggregate GDP and inflation data for the EMU (now measured for all the countries by means of the Harmonised Consumer Price Index) currently provided by Eurostat. We have used the Hodrick-Prescott filter to calculate the quarterly output gap. Graphs 1 and 2 show the evolution of. Institute of Social and Economic Analysis Working paper 03/2006 , 24 pages, ISSN: 1139-6148. 7.
(8) How has european monetary policy changed since the creation of the ecb? Estimation of a taylor rule for the emu (1991-2005). both these variables and the nominal 3-month interest rate from 1991 to the first quarter of 2005. Table 1 shows the result of our estimation, in which we have also included dummies for quarters 1992:3 to 1993:2. As you can see, the coefficients now have higher values than those estimated by Gerlach and Schnabel, but they both continue to be significant and the inflation coefficient is clearly greater than one and greater than that of the output gap. With regards to the real neutral interest rate, our estimation remains practically unaltered at 3.4%. Finally, Graph 3 compares the nominal interest rates and the interest rates derived from the estimated Taylor Rule, finding a close fit during the period. From here on, therefore, we take this rule as a reference to establish comparisons with the monetary policy developed by the ECB. GRAPH 1. Inflation rate and output gap in the EMU (1991-2005). 5,00% 4,00% 3,00% 2,00% 1,00% 0,00% -1,00%. OG. 2004-3. 2003-4. 2003-1. 2002-2. 2001-3. 2000-4. 2000-1. 1999-2. 1998-3. 1997-4. 1997-1. 1996-2. 1995-3. 1994-4. 1994-1. 1993-2. 1992-3. 1991-4. 1991-1. -2,00%. INFLATION RATE. Source: Eurostat and the authors.. Institute of Social and Economic Analysis Working paper 03/2006 , 24 pages, ISSN: 1139-6148. 8.
(9) How has european monetary policy changed since the creation of the ecb? Estimation of a taylor rule for the emu (1991-2005). GRAPH 2. Nominal three-month interest rate in the EMU (1991-2005). 14,00% 12,00% 10,00% 8,00% 6,00% 4,00% 2,00%. 2004-3. 2003-4. 2003-1. 2002-2. 2001-3. 2000-4. 2000-1. 1999-2. 1998-3. 1997-4. 1997-1. 1996-2. 1995-3. 1994-4. 1994-1. 1993-2. 1992-3. 1991-4. 1991-1. 0,00%. 3 MONTHS RATE. Source: Eurostat. Institute of Social and Economic Analysis Working paper 03/2006 , 24 pages, ISSN: 1139-6148. 9.
(10) How has european monetary policy changed since the creation of the ecb? Estimation of a taylor rule for the emu (1991-2005). TABLE 1. Estimation of the Taylor Rule (1991-1998). Gerlach and Schnabel (2000). Coefficients. Equation (2). α. 2.40*** (0.30). 1.53*** (0.27). β1. 1.58*** (0.09). 1.93*** (0.09). β2. 0.45*** (0.06). 0.69*** (0.14). D1992:3. 2.30*** (0.36). 3.24*** (0.47). D1992:4. 3.24*** (0.35). 3.40*** (0.46). D1993:1. 2.70*** (0.37). 3.18*** (0.50). D1993:2. 1.63*** (0.38). 1.92*** (0.50). D1993:3. 0.55 (0.39). R2. 0.98. 0.98. Source: Gerlach and Schnabel (2000) and the authors. Standard deviation in brackets. *** indicates 1% significance.. GRAPH 3. Mean interest rate in the EMU and interest rate resulting from the Taylor rule estimated with 1991 – 1998 data. 14,00% 12,00% 10,00% 8,00% 6,00% 4,00% 2,00%. 3 MONTHS RATE. 2004-3. 2003-4. 2003-1. 2002-2. 2001-3. 2000-4. 2000-1. 1999-2. 1998-3. 1997-4. 1997-1. 1996-2. 1995-3. 1994-4. 1994-1. 1993-2. 1992-3. 1991-4. 1991-1. 0,00%. TR (1991-98). Source: Eurostat and the authors.. Institute of Social and Economic Analysis Working paper 03/2006 , 24 pages, ISSN: 1139-6148. 10.
(11) How has european monetary policy changed since the creation of the ecb? Estimation of a taylor rule for the emu (1991-2005). 3. THE PERIOD FOLLOWING THE CREATION OF THE ECB: 1999-2005. A. s we have seen in the previous section, a simple Taylor Rule like the one we estimated adequately represents the mean monetary policy applied in EMU countries from 1991 to 1998. Our main question, now, is therefore whether the monetary policy of the ECB has followed the same Taylor Rule or there have been significant changes in the coefficients. One way of answering this question is to introduce the EMU inflation and output gap data for the 1999-2005 period in the rule we have previously estimated for 1991-1998, and to compare the resulting interest rate with that effectively established by the ECB. The second part of Graph 3 clearly shows that the fit worsens from 1999 on. During practically the entire period, the interest rates representing the monetary policy of the ECB were lower than those derived from the rule. This could initially be due to a reduction in the equilibrium interest rate or to a change in the coefficients measuring the response to variations in inflation and income3.. The previous graph therefore shows that there may have been a structural change in the estimated rule from 1999 on. In order to more formally test this hypothesis, we have performed a Chow Test constructed from the recursive estimation of equation (2), dividing the complete sample into the two sub-periods that we are considering (1991-1998 and 1999-2005). The statistic4 obtained from this test is F(25,29)=3.6528 (p value=0,0005), clearly rejecting the hypothesis of constant parameters from 1999 on, as also shown in Graph 4. Other authors have also found evidence of this possible structural change. For example, Ullrich (2003) estimates a Taylor rule for the EMU with monthly data from January, 1995 to June, 2002, stating that “with the introduction of the euro and the start of a single monetary policy in Europe in 1999 there could be a structural break in the conduct of the monetary authorities”. This change is described as: “before monetary union, there is a strong reaction of the average interest rate to inflation with a long-run coefficient that exceeds unity. After 1999, the coefficient falls below unity”.. 3. In a later section, we will also analyse whether there are variables other than these two which could be systematically affecting the monetary policy of the ECB. 4. F(n2,n1− k ) =. (SCR * −SCR1) / n2 SCR1 /(n1 − k ). Institute of Social and Economic Analysis Working paper 03/2006 , 24 pages, ISSN: 1139-6148. 11.
(12) How has european monetary policy changed since the creation of the ecb? Estimation of a taylor rule for the emu (1991-2005). GRAPH 4. Chow test for constant parameters. 2.25 Ndn CHOWs. 1%. 2.00 1.75 1.50 1.25 1.00 0.75 0.50. 1996. 1997. 1998. 1999. 2000. 2001. 2002. 2003. 2004. 2005. Source: the authors.. To estimate the change that has taken place in the real equilibrium interest rate and the coefficients of the rule after 1999, we have added a binary variable (CESTt) to the equation, with a value of 1 after that date and zero previously, and which also appears in the equation multiplying inflation (CESTINFt) and the output gap (CESTOGt). The change which has occurred in the Taylor Rule coefficients after the creation of the ECB is given by the coefficients estimated for each of these three variables. The new estimated equation5 is given by expression (4), whereas Table 2 explains the meaning of the estimated coefficients:. it = α + α ' CESTt + β 1 P&t + β '1 CESTINFt + β 2 OGt + β ' 2 CESTOG t + u t. 5. (4). We also have to include dummies for quarters 1992:3 to 1993:2.. Institute of Social and Economic Analysis Working paper 03/2006 , 24 pages, ISSN: 1139-6148. 12.
(13) How has european monetary policy changed since the creation of the ecb? Estimation of a taylor rule for the emu (1991-2005). TABLE 2. Economic meaning of the Taylor rule coefficients. Coefficient. Meaning. α. Constant before 1999. α+α’. Constant after 1999. β1. Reaction of the central bank to a 1% increase in inflation, before 1999. β1+β1’. Reaction of the central bank to a 1% increase in inflation, after 1999. β2. Reaction of the central bank to a 1% increase in the output gap, before 1999. β2+β’2. Reaction of the central bank to a 1% increase in the output gap, after 1999. As Table 3 shows, the variables reflecting the structural change in the constant and the inflation and output gap coefficients are clearly significant. However, the main problem derived from estimating this rule is the presence or autocorrelation, a common occurrence in empirical literature related to the Taylor Rule, usually corrected by introducing the nominal interest rate lagged by one period as an independent variable. In this respect, English, Nelson and Sack (2003) say that “although the literature has arrived at many different specifications and estimates of simple policy rules, many of them find that the lagged interest rate enters the estimated policy rule with overwhelming significance”. From an economic perspective, the presence of the lagged interest rate in the rule is usually justified with two alternative hypotheses. The first, known as interest smoothing, is the fact that, for different reasons6, the central bank makes interest rate changes smoothly, progressively approaching the effective interest rate to which the rule leads. Rudebusch (2002, 2005), however, considers that the central banks do not in fact behave in this way, and that the impact of the lagged interest rate is derived from possible correlated shocks. On the other hand, Castelnuovo (2005) also says that “when estimating Taylor-type rules, econometricians typically find that the fit of such rules remarkably improves when the lagged policy rate is included among the regressors”, and he finds empirical evidence that, in the case of the EMU, the hypothesis best explaining this presence is the smooth fit of the interest rates to that derived from the rule. We have therefore estimated the Taylor Rule by introducing this hypothesis, represented by equation (5), where ρ measures the importance of this inertia in establishing interest rates:. 6. English, Nelson and Sack (2003) mention, for example, the objective of affecting future inflation forecasts, the need to act with caution in view of the uncertainty related to the structure of the model, the value of the parameters or the quality of the data, and the possible negative effects of interest changes on financial market operations.. Institute of Social and Economic Analysis Working paper 03/2006 , 24 pages, ISSN: 1139-6148. 13.
(14) How has european monetary policy changed since the creation of the ecb? Estimation of a taylor rule for the emu (1991-2005). (. ). it = ρ i t −1 + (1 − ρ ) α + α ' CESTt + β 1 P&t + β '1 CESTINFt + β 2 OGt + β ' 2 CESTOG t + u t ….(5). Table 3 also shows the results of this estimation in which we can see that, effectively, the coefficient of the lagged interest rate is highly significant, with an estimated coefficient of 0.68. On the other hand, the presence of a structural change in the application of monetary policy in the euro area after 1999 is also clearly confirmed, in the sense that the authorities’ reaction to income variations has increased and there is less response to changes in inflation. Indeed, the results of our estimate give a negative value for the inflation coefficient of the Taylor Rule, both in equation (4) and in equation (5). This sign, however, should be interpreted with some caution, considering the small number of years since the ECB was established. With regards to the value of the real neutral interest rate, the mean values derived from our estimate are 3.2% for the period prior to 1999 and 0.8% since. Therefore, the fact that the interest rates established by the ECB have been systematically below those derived from the estimated Taylor Rule before the creation of the ECB would not only be explained by the change in the coefficients, but also by this fall in the neutral interest rate. This decrease has also been detected by other authors such as Hayo and Hofmann (2005), who estimate a 1.3% neutral rate. Finally, table 3 also shows that with the introduction of the lagged interest rate, correlation disappears (the Breusch-Godfrey test accepts the hypothesis that the first four correlations are null) and the fit continues to be good (the R2 is 0.99), as is also shown by Graph 5.. Institute of Social and Economic Analysis Working paper 03/2006 , 24 pages, ISSN: 1139-6148. 14.
(15) How has european monetary policy changed since the creation of the ecb? Estimation of a taylor rule for the emu (1991-2005). TABLE 3. Estimation of the Taylor rule (1991-2005). Coefficients. Equation (4). Equation (5). α. 1.53*** (0.27). 1.96*** (0.15). β1. 1.94*** (0.09). 1.63*** (0.12). β2. 0.69*** (0.14). 1.42*** (0.07) 0.68*** (0.05). ρ α’. 1.91*** (0.53). 1.71* (0.27). β’1. -2.19*** (0.25). -2.12*** (0.16). β’2. 0.65*** (0.21). 0.51 (0.11). α + α’. 3.44. 3.67. β1+ β’1. -0.25. -0.49. β2 + β’2. 1.34. 1.93. D1992:3. 3.24*** (0.49). 1.68*** (0.26). D1992:4. 3.40*** (0.49). 0.95*** (0.30). D1993:1. 3.18*** (0.52). 1.00*** (0.30). D1993:2. 1.92*** (0.53). -0.04 (0.29). 0.825. 1.8. 0.0002. 0.58. 0.98. 0.99. Durbin-Watson Breusch-Godfrey test (p-value) R2. Source: the authors Standard deviation in brackets. ***, ** and * indicate 1%, 5% and 10% significance, respectively.. Institute of Social and Economic Analysis Working paper 03/2006 , 24 pages, ISSN: 1139-6148. 15.
(16) How has european monetary policy changed since the creation of the ecb? Estimation of a taylor rule for the emu (1991-2005). GRAPH 5. Mean interest rate in the emu and interest rate resulting from the Taylor rule estimated with 1991-2005 data. 14,00% 12,00% 10,00% 8,00% 6,00% 4,00% 2,00%. 3 MONTHS RATE. 2004-3. 2003-4. 2003-1. 2002-2. 2001-3. 2000-4. 2000-1. 1999-2. 1998-3. 1997-4. 1997-1. 1996-2. 1995-3. 1994-4. 1994-1. 1993-2. 1992-3. 1991-4. 1991-1. 0,00%. TR (1991-2005). Source: the authors.. 4. INTRODUCTION OF OTHER VARIABLES. A. lthough the Taylor Rule estimated above reflects the behaviour of the ECB during the analysed period, as shown by the results obtained, we wished to rule out the possibility of the rule being better specified with the inclusion of additional variables which could be significant for our analysis. The variables introduced into the rule following, for example, prior work by Clarida, Galí and Gertler (1998) and Gerlach and Schnabel (2000), were, on the one hand, the Federal Reserve interest rate and real €/$ exchange rate variation, in order to analyse whether there is interdependence between the monetary policy applied by the ECB and the Federal Reserve and, on the other, the growth rate of the M3 monetary variable, discounting the reference value established by the ECB (4.5%), in order to verify whether it can be empirically shown that the ECB takes the evolution of this variable, the monetary pillar of its strategy, into account in the interest rate decisions made in application of its monetary policy. We has thus added a new variable (VA) to the previously estimated Taylor rule, as shown in equation (6):. Institute of Social and Economic Analysis Working paper 03/2006 , 24 pages, ISSN: 1139-6148. 16.
(17) How has european monetary policy changed since the creation of the ecb? Estimation of a taylor rule for the emu (1991-2005). it = ρ it −1 + (1− ρ )(α + α ' CESTt + β1 P&t + β '1 CESTINFt + β 2 OGt + β ' 2 CESTOGt + β 3VA) + ut (6). This additional variable is given alternately by the Federal Reserve’s interest rate (6a), variation in the real €/$ exchange rate (6b) and the growth rate of the M3 monetary variable less its reference value (6c). Coefficient β 3 represents the ECB’s reaction to a 1% increase in the relevant additional variable during the estimated period. The results of the estimate obtained when these variables are included in the rule are shown on Table 4 and can be summarised as follows: On the one hand, the ECB does not adapt its monetary policy decisions to the situation of the US economy, as shown by the non-significance of the parameters linking the European interest rate to the Federal Reserve rate and variations in the real exchange rate, as also shown on Graph 6. In other words, internal variables are predominant in changes in the euro area’s interest rate, as is to be expected in an economy as large as the EMU.. Institute of Social and Economic Analysis Working paper 03/2006 , 24 pages, ISSN: 1139-6148. 17.
(18) How has european monetary policy changed since the creation of the ecb? Estimation of a taylor rule for the emu (1991-2005). GRAPH 6. Mean interest rate in the EMU, federal reserve interest rate and real exchange rate variation (€/$).. 0,15. 12,00%. 0,1. 10,00%. 0,05. EMU INT. RATE. US INT. RATE. Exchange rate. 2005-1. 2004-1. 2003-1. 2002-1. 2001-1. -0,2 2000-1. 0,00% 1999-1. -0,15. 1998-1. 2,00%. 1997-1. -0,1. 1996-1. 4,00%. 1995-1. -0,05. 1994-1. 6,00%. 1993-1. 0. 1992-1. 8,00%. 1991-1. Interest rate. .. 14,00%. REAL EXCH. RATE GROWTH. Source: the authors.. On the other hand, it also appears that the ECB does not use the difference between the M3 growth rate and its reference value (4.5%) when making monetary policy decisions. In fact, the sign of the parameter corresponding to this variable in the estimated Taylor rule is opposite what would initially be expected according to the ECB’s definition of its monetary policy strategy. Indeed, as shown on graph 7, during the period of falling interest rates that started in 2001, monetary supply grew above its reference value. This evidence strengthens the positions favouring a redefinition of ECB strategy, in the sense that it should abandon the monetary pillar. Along these lines, for instance, Svensson (2002) says that “fortunately for euro-area monetary policy, the eurosystem seems to ignore the money-growth indicator in its interest rate decisions. As discussed in Begg, Canova, De Grauwe, Fatás and Lane (2002), the correlation between the money-growth indicator and and interest rate decisions in not. Institute of Social and Economic Analysis Working paper 03/2006 , 24 pages, ISSN: 1139-6148. 18.
(19) How has european monetary policy changed since the creation of the ecb? Estimation of a taylor rule for the emu (1991-2005). only zero, but of the wrong sign. That is, when money growth increases, on average the eurosystem lowers the interest rate. Ignoring the money-growth indicator is clearly better than obeying it. Even better would be for the eurosystem to be upfront about the irrelevance of the money-growth indicator, and avoid the confusion and non-transparency inherent in maintaining its prominence”. GRAPH 7. Mean interest rate in the emu, m3 growth and reference value. 14,00% 12,00% 10,00% 8,00% 6,00% 4,00% 2,00%. M3 (Grw oth). M3 REF. 2004-3. 2003-4. 2003-1. 2002-2. 2001-3. 2000-4. 2000-1. 1999-2. 1998-3. 1997-4. 1997-1. 1996-2. 1995-3. 1994-4. 1994-1. 1993-2. 1992-3. 1991-4. 1991-1. 0,00%. 3 Months rate. Source: the authors.. Institute of Social and Economic Analysis Working paper 03/2006 , 24 pages, ISSN: 1139-6148. 19.
(20) How has european monetary policy changed since the creation of the ecb? Estimation of a taylor rule for the emu (1991-2005). TABLE 4. Estimate of the Taylor rule with additional variables (1991-2005). Coefficients. Equation (6a) FED interest rate. Equation (6b) Variation in real €/$ exchange rate. Equation (6c) M3 growth – reference value. 1.20 (2.91). 1.92*** (0.15). 1.60** (0.16). β1. 1.69*** (0.12). 1.64*** (0.11). 1.78*** (0.44). β2. 1.34*** (0.07). 1.37*** (0.07). 1.76*** (0.43). ρ. 0.68*** (0.05). 0.69*** (0.05). 0.75*** (0.05). 1.52* (0.28). 2.00** (0.28). 2.67 (0.25). β’1. -1.87*** (0.18). -2.28*** (0.17). -1.82*** (0.17). β’2. 0.26 (0.14). 0.67* (0.11). 0.29** (0.02). α + α’. 2.73. 3.92. 3.27. β1+ β’1. -0.17. -0.63. -0.04. β2 + β’2. 1.60. 2.04. 2.05. 0.11 (0.03). 0.03 (0.01). -0.29*** (0.02). D1992:3. 1.75*** (0.27). 1.56*** (0.27). 1.71*** (0.24). D1992:4. 1.01*** (0.30). 1.03*** (0.30). 0.80*** (0.28). D1993:1. 1.04*** (0.30). 1.02*** (0.29). 0.98*** (0.27). D1993:2. 0.00 (0.29). -0.10 (0.29). -0.1 (0.27). 1.71. 1.84. 1.84. 0.5227. 0.6264. 0.5233. 0.99. 0.99. 0.99. α. α’. β3. Durbin-Watson Breusch-Godfrey test (p-value) R2. Source: the authors. Standard deviation in brackets. ***, ** and * indicate 1%, 5% and 10% significance, respectively.. Institute of Social and Economic Analysis Working paper 03/2006 , 24 pages, ISSN: 1139-6148. 20.
(21) How has european monetary policy changed since the creation of the ecb? Estimation of a taylor rule for the emu (1991-2005). 5. CONCLUSIONS: HOW TO INTERPRET THE RESULTS. T. he first issue we considered at the beginning of this paper was whether the single monetary policy applied by the ECB since 1999 follows the same reaction function that characterised the average of the previous central banks, or whether there has been a change in the way in which monetary policy is applied. The result obtained is that the Taylor rule estimated to characterise the 1991-1998 period does not correctly reflect the behaviour of the ECB. On the contrary, the interest rates applied since 1999 have been systematically beneath those derived from the rule, and our tests have confirmed the existence of a structural change from that date on. To be more specific, the fact that the real interest rates have been lower than those derived from the above rule, based on the results obtained in our estimation of the Taylor rule, can be explained by a reduction in the neutral real interest rate and a change in the rule’s coefficients, with an increase in the output gap coefficient and an important decrease in the response to inflation deviations.. The neutral interest rate is taken as a reference in the Taylor rule when inflation is on target and income is at its potential level, and the ECB (2004) itself confirms its reduction when it ways that “The statistical measures … point to a rate in the most recent period that is noticeably lower than the one that seems to have been prevailing over the 1980s and 1990s. This suggests that the natural real interest rate in the euro area may have declined over time. Such evidence tends to be confirmed by results generated on alternative estimation methods based on a more refined statistical filtering of time series data and on more structural approaches using macroeconomic models”. The causes of such a reduction mentioned by the ECB in the bulletin include lower productivity and population growth rates – so that potential growth is also lower – and a reduction in exchange rate, default and inflation risk premia. According to our results, the real equilibrium interest rate could be around 1% (the mean real effective expost interest rate from 1999 to 2005 was 1.2%). With regards to the value of the rule’s coefficients, we can connect their variation to the controversy on the objectives to be pursued by central banks, and particularly to whether they should intervene to stabilise the short-term income level – around the potential level – in addition to guaranteeing price stability. In this respect, the ECB Statutes clearly establish that price stability is a priority over other objectives, which are to be pursued without prejudice to the former. However, the law governing the Federal Reserve clearly establishes what is known as a dual mandate, with the two objectives on the same level. In spite of this, the monetary policy applied by the ECB since 1999 does appear to have paid attention to income fluctuations, and in our opinion this could. Institute of Social and Economic Analysis Working paper 03/2006 , 24 pages, ISSN: 1139-6148. 21.
(22) How has european monetary policy changed since the creation of the ecb? Estimation of a taylor rule for the emu (1991-2005). be explained by the persistent economic sluggishness registered since 2001. On the other hand, the reduction in the inflation coefficient compared to the previous period is a result found in other prior studies of the Taylor Rule in the EMU. Galí (2003), for example, says that “with the exception of the very early part of the sample, the interest rate set by the ECB has remained substantially below the level implied by the benchmark rule. That gap begins to emerge with the decision by the ECB to cut interest rates in April 1999, in spite of an incipient rise in inflation”. He goes on to point out asymmetrical behaviour by the ECB as inflation rises and falls: “The large gap between the interest rate predicted by the rule and the one actually observed is a consequence of the observation that, on average, cumulative interest rate adjustments have hardly matched the cumulative increases in inflation when inflation goes up, while overshooting its cumulative declines when the latter variable is going down”. Faust, Rogers and Wright (2001) also compare the first few years of the ECB with the estimated Bundesbank reaction function for the 1995-1998 period, concluding as we do that interest rates were below the level derived from the rule. After analysing different alternative explanations, they reach the conclusion that the most likely hypothesis is a change in the rule’s parameters: “Our results suggest that the reaction function of the ECB features a high weight on the output gap relative to the weight on inflation, compared to the Bundesbank”. The problem with our results is evidently that the resulting coefficient is negative in all our estimates for the period after 1999. Of course, we do not believe that this represents systematic behaviour by the ECB which could be extrapolated into the future, but rather that it is due to the small number of years and the economic context. In particular, the coefficient’s negative sign, and ultimately the asymmetrical behaviour identified by Galí, could result from combining the relative stability of inflation at around 2% with the reduction in growth experienced since 2001, especially in some countries as important as Germany, and the possibility that the ECB may be considering that these cases in which inflation exceeds 2% are temporary and involve no medium-term risk7. However, it is absolutely certain that the coefficient has decreased substantially to below 1 in this period, a condition established by the Taylor rule as required to stabilise inflation. On the other hand, it would also appear that the ECB has paid more attention to income fluctuations than, on average, the 12 EMU country central banks in the previous decade. Does this mean that there has 7. In fact, the ECB claims that one of the major successes of its monetary policy has been to “anchor” inflation forecasts at 2%. However, we have estimated the Taylor rule using a more stable price index –excluding energy and unprocessed food from the HCPI- obtaining very similar results.. Institute of Social and Economic Analysis Working paper 03/2006 , 24 pages, ISSN: 1139-6148. 22.
(23) How has european monetary policy changed since the creation of the ecb? Estimation of a taylor rule for the emu (1991-2005). been a change in preferences, giving more weight to income stability? Our results are unable to answer this question since, as Hayo and Hofman (2005) say, Taylor rule coefficients are derived both from the preferences of the authorities and from other structural parameters determining the efficacy of the mechanism transmitting monetary policy to income and inflation. These authors compare the EMU situation with Germany prior to 1999, and they do find that income is more sensitive to interest rate changes, which would explain the increase in the rule’s output gap coefficient. We, however, have not performed these estimates for before and after the EMU for the entire euro area. Another result derived from our estimates is that interest rates are associated to a high level of inertia, with a coefficient around 0.7. In other words, the ECB only gradually adjusts interest rates to changes in the inflation rate and the output gap. However, the introduction of other variables into the rule, such as the Federal Reserve interest rate, variation in the real euro-dollar exchange rate or deviation of the M3 growth rate from the reference value established by the ECB, is of little significance when explaining interest rate variations.. Institute of Social and Economic Analysis Working paper 03/2006 , 24 pages, ISSN: 1139-6148. 23.
(24) How has european monetary policy changed since the creation of the ecb? Estimation of a taylor rule for the emu (1991-2005). 6. BIBLIOGRAPHIC BEGG, D, F. CANOVA, P. DE GRAUWE, A. FATAS AND P. R. LANE (2002): “Surviving the Slowdown”, Monitoring the European Central Bank 4, CEPR, London. CASTELLNUOVO, E. (2005): Taylor Rules and Interest Smoothing in the Euro Area, Padua University. CLARIDA, R., J. GALÍ AND M. GERTLER (1998): “Monetary Policy Rules in Practice. Some International Evidence”, European Economic Review, nº 42, págs. 1033-1067. ENGLISH, W., W. NELSON AND B. SACK (2003): “Interpreting the significance of the Lagged Interest Rate in Estimated Monetary Policy Rules”, Contributions to Macroeconomics, vol. 3 (1). EUROPEAN CENTRAL BANK (2004): “The natural interest rate in the euro area”, Monthly Bulletin, may, pág. 59-71. FAUST, J., J.H. ROGERS AND J.H. WRIGHT (2001): “An Empirical Comparison of Bundesbank and ECB Monetary Policy Rules”, International Finance Discussion Papers, nº 705, Board of Governors of the Federal Reserve System. GALÍ, J. (2003): “Monetary Policy in the Early Years of EMU”, in M. Buti and A. Sapir (eds.): EMU and Economic Policy in Europe: the Challenges of the Early Years, Edward Elgar, 2003 GERLACH, S. AND G. SCHNABEL (2000): “The Taylor rule and interest rates in the EMU area”, Economic Letters, 67, pág. 165-171. HAYO, B. AND B. HOFMANN (2005): “Comparing Monetary Policy Reaction Functions: ECB versus Bundesbank”, Marburg Papers on Economics, nº 02-2005. JOHNSTON, J. AND J. DINARDO (2001): Métodos de Econometría, Vicens Vives, Barcelona. RUDEBUSCH, G.D. (2002): “Term Structure Evidence on Interest Rate Smoothing and monetary policy inrtia”, Journal of Monetary Economics, 49, pág. 1161-1187. RUDEBUSCH, G.D. (2005): Monetary Policy Inertia: Fact or Fiction?, Federal Reserve Bank of San Francisco. SVENSSON, L. (2002): “A Reform of the Eurosystem's Monetary-Policy Strategy Is Increasingly Urgent", Briefing paper for the Committee on Economic and Monetary Affairs (ECON) of the European Parliament, Mayo. TAYLOR, J. (1993): “Discretion versus Policy Rules in Practice”, CranegieRochester Conference Series on Public Policy, 39. ULLRICH, K. (2003): “A comparison between the Fed and the ECB: Taylor Rules”, ZEW Discussion Papers, 03-19.. Institute of Social and Economic Analysis Working paper 03/2006 , 24 pages, ISSN: 1139-6148. 24.
(25)
Figure
Documento similar
If the concept of the first digital divide was particularly linked to access to Internet, and the second digital divide to the operational capacity of the ICT‟s, the
MD simulations in this and previous work has allowed us to propose a relation between the nature of the interactions at the interface and the observed properties of nanofluids:
No obstante, como esta enfermedad afecta a cada persona de manera diferente, no todas las opciones de cuidado y tratamiento pueden ser apropiadas para cada individuo.. La forma
1. S., III, 52, 1-3: Examinadas estas cosas por nosotros, sería apropiado a los lugares antes citados tratar lo contado en la historia sobre las Amazonas que había antiguamente
In the previous sections we have shown how astronomical alignments and solar hierophanies – with a common interest in the solstices − were substantiated in the
While Russian nostalgia for the late-socialism of the Brezhnev era began only after the clear-cut rupture of 1991, nostalgia for the 1970s seems to have emerged in Algeria
Finally, experiments with solar [17–34], atmospheric [35–45], reactor [46–50], and long-baseline accelerator [51–59] neutrinos indicate that neutrino flavor change through
teriza por dos factores, que vienen a determinar la especial responsabilidad que incumbe al Tribunal de Justicia en esta materia: de un lado, la inexistencia, en el
