Epigene'c mechanisms in
colorectal cancer
Epigenetic mechanisms in colorectal
cancer
Memòria presentada per Joaquín Custodio Rojo
per optar al grau de Doctor en Biologia Cel·lular
Tesi realitzada sota la direcció del Dr. Miquel Àngel Peinado Morales a l’Institut de Medicina Prediciva i Personalitzada del Càncer
Tesi adscrita al Departament de Biologia Cel·lular, de Fisiologia i d’Immunologia de la Facultat de Medicina
Universitat Autònoma de Barcelona Bienni 2013 – 2014
Director Tutora Doctorand
Miquel A. Peinado Morales Rosa Miró Ametller Joaquín Custodio Rojo
“La frase más excitante que se puede oír en ciencia, la que anuncia nuevos descubrimientos, no es ¡Eureka! (¡Lo encontré!) sino 'Es extraño...'.”
“La ciencia se construye a partir de aproximaciones que gradualmente se acercan a la verdad.”
―Isaac Asimov―
Als meus avis i iaios, Als meus pares i germà i a l’Anna, Gràcies
INDEX
ABBREVIATIONS 15
INTRODUCTION 17
COLORECTAL CANCER 19
Colorectal cancer features 19
Incidence and mortality 20
Colorectal cancer risk factors 23
Non-‐modifiable risk factors 23
Environmental risk factors 25
Colorectal cancer as a stepwise progression model 28
Screening and diagnosis 30
Treatments 32
EPIGENETICS 34
DNA methylation, the fifth base 35
DNA demethylation, the sixth, seventh and eighth bases 39 of the genome
Histone modifications 40
Histone variants 43
Polycomb and Trithorax complexes 44
RNA epigenetics, brave new world 46
Chromatin conformation, entering in the third-‐dimension 47
CANCER EPIGENETICS 49
DNA methylation in cancer 50
Histones in cancer 53
ALDOSE KETO REDUCTASES IN CANCER 56
AKR1B1 in human diseases 56
AKR1B10 and AKR1B15 in cancer 58
RETINOIC ACID PATHWAY 62
OBJECTIVES 67
MATERIALS AND METHODS 71
SAMPLES 73
Patients’ samples 73
Human stool samples and associated carcinoma tissues 73
Mice samples 74
Cell lines 74
EXPRESSION VECTORS 76
cDNA Vectors 76
Vector amplification 77
CELL CULTURE 77
DNA transfections 77
Lentiviral infection 78
Dznep treatment 78
All-‐trans retinal treatment 78
5-‐aza-‐2'-‐deoxycytidine treatment 78
Luciferase enhancer assays 79
Cell Proliferation Assay XTT 81
Genome editing: CRISPR 82
DNA METHYLATION ANALYSIS 84
Genomic DNA extraction 84
Bisulfite treatment 84
Bisulfite sequencing 85
Infinium 450K methylation arrays 86
RNA EXPRESSION ANALYSIS 86
RNA extraction 86
Reverse transcriptase PCR 87
Quantitative Real-‐Time PCR 87
CHIP AND CHIP-‐SEQ EXPERIMENTS 88
PROTEIN ANALYSIS 90
Western blot 90
Immunohistochemistry 90
CHROMOSOME CONFORMATION CAPTURE (3C) 91
BIOINFORMATICS 92
The Cancer Genome Atlas project 92
TCGA: Gene expression 92
TCGA: DNA methylation 93
TCGA: Gene mutation and copy number alterations 94
Other bioinformatic tools 94
RESULTS 97
DNA METHYLATION PROFILE OF AKR1B GENES IN COLORECTAL CANCER 99
DNA methylation of AKR1B1 by bisulfite sequencing 99
DNA methylation of AKR1B10 by bisulfite sequencing 101
AKR1B1 DNA methylation using TCGA data 104
AKR1B10 DNA methylation using TCGA data 105
AKR1B15 DNA methylation using TCGA data 106
AKR1B1 DNA methylation in stools 107
AKR1B1 CpG island methylation in other cancers 110
Akr1b3 DNA methylation in mice 111
mRNA EXPRESSION OF AKR1B GENES IN COLORECTAL CANCER 114
mRNA expression of AKR1B1 in colorectal cancer samples 114
mRNA expression analysis of AKR1B10 and AKR1B15 in 115 colorectal cancer samples
mRNA expression of AKR1B family in a second set of samples 116
mRNA expression of AKR1B family in TCGA samples 118
mRNA expression of AKR1B family genes in cancer cell lines 119
Expression of genes near AKR1B locus 120
Coexpression of AKR1B genes 121
Expression of AKR1B family in mouse colon 123
PROTEIN LEVEL OF AKR1B GENE FAMILY IN COLORECTAL CANCER 125
Expression of AKR1B1 and AKR1B10 at the protein level 125
AKR1B10 in colorectal cancer tissue microarrays 125
AKR1B1 in colorectal cancer tissue microarrays 128
EPIGENETIC GENE REACTIVATION THROUGH 5-‐AZAC TREATMENT 131
AKR1B genes DNA methylation and expression after 131 5-‐AzaC treatment
Chromatin profile of the AKR1B locus 132
CHROMOSOME CONFORMATION CAPTURE (3C) 136
LUCIFERASE ASSAYS 138
Enhancer luciferase assays 138
Methylation-‐enhancer luciferase assays 140
CRISPR ASSAYS 141
CRISPRing the TFBS 141
CRISPRing NF-‐Y and C/EBP-‐β genes 142
HCT116 DZNEP TREATMENT 143
FUNCTIONAL IMPLICATIONS OF AKR1B10 AND AKR1B15 144
RE-‐EXPRESSION IN COLORECTAL CANCER
Proliferation assay 144
XTT assay 144
RETINOIC ACID PATHWAY 147
Expression profiling of the retinoic acid pathway in colorectal 147 tissue through The Cancer Genome Atlas and RefExA databases
Altered Expression of Genes involved in retinoic acid pathway 148 is directly linked to survival in colorectal cancer patients
Promoter DNA methylation profiling of the RA pathway in 150 normal and colorectal tumor tissue
Discovery of new genes related with the RA pathway by 151 analysis of DNA methylation co-‐regulation
Demethylation of the retinoic acid pathways partially restored 152 the altered gene expression
Genomic profiling of the RA pathway in colorectal cancer 153
DISCUSSION 157
EPIGENETIC REGULATION OF AKR1B1 GENE FAMILY IN 159 COLORECTAL CANCER
Epigenetic regulation of AKR1B10 and AKR1B15 161
ENHANCER ACTIVITY OF AKR1B1 CpG ISLAND 163
Chromatin conformation in the AKR1B locus 163
A distant enhancer regulates the expression of 163 AKR1B10 and AKR1B15
H3K27ac and PRC2 dynamics in the activation/silencing 164 of AKR1B10 and AKR1B15
Gene regulation by enhancer hypermethylation in cancer 167
FUNCTION OF AKR1B10 IN CANCER, LOCATION, 169
LOCATION AND LOCATION
Consequences of AKR1B10 and AKR1B15 loss of function 170 in colorectal cancer
DEREGULATION OF THE RETINOIC ACID PATHWAY IN 173 COLORECTAL CANCER
RETINOIC ACID PATHWAY GENES AS DIAGNOSTIC MARKERS 176
AKR1B1 CpG island DNA methylation as a non-‐invasive 176 biomarker in stools
AKR1B10 protein downregulation in colorectal cancer 178
RETINOIC ACID PATHWAY GENES AS PROGNOSTIC MARKERS 179
CONCLUSIONS 181
BIBLIOGRAPHY 185
ANNEX 209
ANNEX I. TRANSFECTION AND INFECTION VECTORS 211
ANNEX II. BISULFITE PRIMERS 212
ANNEX III. EXPRESSION PRIMERS 213
ANNEX IV. LUCIFERASE PRIMERS CONSTRUCTS 214
ANNEX VI. METHYLATION PROBES 216
ANNEX VII. CHIP PRIMERS 217
ANNEX VIII. 3C PRIMERS 218
ANNEX IX. EXPRESSION PROBES 219
ANNEX X. CHIP-‐SEQ DATA 220
ANNEX XI. P53 TMAS 221
ANNEX XII. ARTICLE 222
3C chromosome conformation capture 5-AzadC 5-aza-2’-deoxycytidine
5-FU 5-Fluorouracil
5caC 5-carboxylcytosine
5fC 5-formylcytosine
5hmC 5-hydroxymethylcytosine
5hmU 5-hydroxymethyluracil
5mC 5-methylcytosine
AKR aldo-Keto reductase
ATRA all-trans retinoic acid
ChIP chromatin immunoprecipitation
CNA copy number alteration
COAD colorectal adenocarcinoma
CpGi CpG island
CRC colorectal cancer
CRISPR clustered regularly interspaced short palindromic repeats
CTCF CCCTC-binding factor
DNMT DNA methyltransferase
DZNep 3-Deazaneplanocin A hydrochloride
ecCEBPA extra-coding CEBPA ncRNA
EGFR epidermal growth factor receptor
EMT epithelial to mesenchymal transition
eRNAs enhancer RNA
FAP familial adenomatous polyposis
FDA Food and Drug Administration
FOBT fecal occult blood test
GO gene ontology
HDAC histone deacetylase
HNPCC hereditary non-polyposis colorectal cancer
IBD inflammatory bowel disease
ISC intestinal stem cells
Kb Kilobase
KEGG Kyoto Encyclopedia of Genes and Genomes
LMR low-methylated region
lncRNA long non-coding RNA
miRNA micro-RNA
ncRNA non-coding RNA
bp base pair
PRC Polycomb repressive complex
PTMS post-translational modifications
RA retinoic acid
RAR retinoic acid receptors
RARE retinoic acid response elements
RXR retinoic X receptors
TCGA The Cancer Genome Atlas
TDG thymine DNA glycosylase
TET Ten-eleven translocation
TF transcription factor
TFBS transcription factor binding site
TMAs tissue microarrays
TNM tumor node metastasis
TrxG Trithorax group
TSS transcription start site
ceCi a eti c
qó
eoea n o r a nf a
i di C e d c C x %tl 1Ci a s c ac i ceCi dd I Ci R en i en i di c i C
C eau ddl x tI aC q%I c C e s I c et i C 1tI c et de C eti cl 0 ce
I ci u t c dsl tl l ni R en e i di c c C e d eau i Cl C I c et dds en l u
c C x a n Cd 1 et F
n d CW L8qL%0 n
l su 1ei u l c l tI cl i
i di C e d c C 1 c
i c en di eti c i en
eau i CW tcI en d l l t d
u ct l e eti cl di i tc
en l ei i dl W c u t W
i cl et1 eti cW C l tc
l ei i d l tp W di l l i
11 ete Wdi l l i R tI ne
c i ad dl i tc da
c al i C ( i u tetcI
x tre c W qóó: ,
rau C Wqóóó%0 ci C tci u tl en l e oci R c c en u i l e
i u u i c es1 i i di C e d c CWi u 1Ctl tcI 11Ci )tu e ds ó: D i en ei e d
0 ci C tci u l i CtI tc e Ci u en 1ten dtau i en tce l etc 0
i cz u tdt C ci C tci u l i ddi R eR i u tc 1 enR sl Wen i c( ceti c di C
en l CC e i c W 1 c tcI i c en u i d ad C de C eti cl tl 1d s x tI aC L%0
n 1Ci 1 C t I ci l i en es1 i ci C tci u tl Ca t d ei t en
i CC e i ddi R za1 c eC eu cei en 1 et ce0 CC e c i u l e c ei ( i d(
u i C C 1t ds ei C tci u l en c eni l i c l i ddi R tcI en i c( ceti c d1 enR s
x eetcI ei c L8qZ%0 u tci Ctes i i di C e d c Cl n l ci cz 1ten dt d
i CtI tc c tc da l C tci t eau i Cl Wl C i u l c dsu 1ni t eau i Cl 0
c entl en l tl WR R tdd C C ei ci cz u tdt C i di C e d ci C tci u W
tc 1 c ceds t en s C tc da tc en i c( ceti c di Cen l CC e 1 enR s0
ceCi a eti c
L8
f a 2 d f n nu c n s i ne eoea n o r ah c ae f ael nnr ner 2. pPh
r r r l ean oni
i di C e d c C tl u ri C al i u i C t tes c u i Ce dtes enCi aI ni ae en
R i Cd xR R R 0R ni 0i CI %0 i di C e d c C tl en l i c u i l e i u u i c al i
en R i Cd R t x tcpd C F i I dl e tcWqóó/% c en entC u i l e i u u i c
c C tc en R i Cd WR ten q0LE u tddti c c R l l t I ci l tc L887 c te n l
c l etu e c tc C l i en tc t c Wu otcI a1 ei e d i L0L u tddti c
l l t I ci l 1 Cs C s L8Z80
i di C e d c C el u c c R i u c du i l e 9a ddsW c en tc t c tl
ntI n C tc en tc al eCt dtp i aceCt l x i ae eR i zentC l %x i sd F i cWL88L%W
u i cI en u en ntI n l e tc t c i i di C e d c C tl tc al eC dt W R
d c W l e Cc aCi 1 c i aen Cc aCi 1 , c en di R l e tc t c tc
five features or with 10–20% necrosis are considered to be equivocal.110
The second pattern, accounting for 20% of cases, is mucinous adenocarcinoma (Figure 12D).35,109 Extra-cellular mucin constitutes at least 50% of the cross-sectional area, and by definition they are poorly differentiated. Serrations can usually be identified, at least focally, and typical serrated carcinoma cytology is retained. Cell balls and papillary rods floating in the mucin are common, and are characteristic of this pattern (Figure 12E).
The final pattern is trabecular, constituting approxi-mately 7% of cases.35,109These tumours are poorly
dif-ferentiated, with tumour cells growing in a trabecular
fashion; epithelial serrations are typically lost (Fig-ure 12F). Micropapillary struct(Fig-ures are sometimes seen, and lymphatic invasion is common. Serrated morphology carcinoma cytology remains apparent. This pattern is often a minor component of the other subtypes, usually at the advancing edge of the tumour. Serrated morphology carcinomas segregate as a distinct molecular subset, strengthening the assertion that they represent a reproducible and distinctive subtype of CRC.111KRASand BRAFmutations have
been identified in 45% and 33% of cases, respec-tively,112MSS in 50%, MSI-H in 16%, and MSI-L in 30%.110These figures suggest that serrated pathways
1b and 2, described above, are overrepresented. Figure 11.Putative pathways to colorectal cancer.
©2012 Blackwell Publishing Ltd,Histopathology,62,367–386.
ceCi a eti c
Lq
t d c l e Cc Ct c i aenz ceC d l t xnee12MMR R R 0R C 0i CI %x i sd
F cI u cWL888%0
otcI 0 0 l c ) u 1d i tc al eCt dtp i aceCsWR c i l C( en e c C
tc t c c tc 1 Cet ad C i di C e d c Ctc C l l R ten I x d q%x t I dW
L8qZ%0 c en 0 i di C e d c C tl en u i l e C 9a ce i Cu i c C u i cI
1 i 1d I U: s Cl c i d Cx i sd F i cWL88L%0
o p d r r c ae oni vb , e eoea n o r a s n r o n r n au o i Fmr r n n n e l a ael 2. . 3 ne 2. . Th c n ael ei o | er m2. . 2h
i di C e du i Ce dtes C e tl C l tcI tc en 0 c tc u i l ei en tc al eCt dtp
i aceCt l x i sd F cI u cWL888, h1 pz ce WL8q8, t I dWL8qZ%
x tI aC Z%0 tl l e e e Cdt C l e I l a ei l C ctcI 1C et l c en
( td tdtes i u i C t t ce eC eu ce C I tu cl 11 C ei n ( Ct( c entl
C a eti c tc c C en0
f a P d , a r r l ean oni a n ea o n r a i Fmr r n n n ael pT3B ne 2. . Tm c n ael om2. pP , a r r l ean oni a n ea eoea n o r a r c r v f n
ea , l er l r r s el r ( 2T i a h c n ael 1c gw r n m2. p. h
Birth to 39 40 to 59 60 to 69 70 and older
Male 0.08 (1 in 1212) 0.94 (1 in 106) 1.40 (1 in 71) 4.19 (1 in 24)
Female 0.08 (1 in 1236) 0.75 (1 in 134) 0.98 (1 in 102) 3.80 (1 in 26)
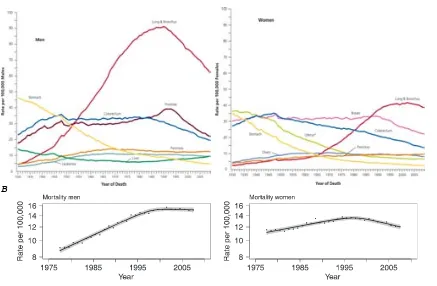
FIGURE 4.Trends in Death Rates Among Males for Selected Cancers, United States, 1930 to 2009.
Rates are age adjusted to the 2000 US standard population. Due to changes in International Classification of Diseases (ICD) coding, numerator information has changed over time. Rates for cancers of the lung and bronchus, colorectum, and liver are affected by these changes.
FIGURE 5.Trends in Death Rates Among Females for Selected Cancers, United States, 1930 to 2009.
Rates are age adjusted to the 2000 US standard population. Due to changes in International Classification of Diseases (ICD) coding, numerator information has changed over time. Rates for cancers of the uterus, ovary, lung and bronchus, and colorectum are affected by these changes.
*Uterus includes uterine cervix and uterine corpus.
18 CA: A Cancer Journal for Clinicians
Cancer Statistics, 2013
lung, and by more than 40% for prostate cancer. The decrease in lung cancer death rates—among men since 1990 and among women since 2002—is due to the reduction in tobacco use,20
while the decrease in death rates for female breast, colorectal, and prostate cancers largely reflects improvements in early detection and/or treatment.17,21,22
Over the past 10 years of data (2000-2009), the largest annual declines in death rates were for chronic myeloid leukemia (8.4%), cancers of the stomach (3.1%) and colorectum (3.0%), and non-Hodgkin lymphoma (3.0%).
Recorded Number of Deaths From Cancer in 2009
A total of 2,437,163 deaths were recorded in the United States in 2009, 567,628 of these from cancer.23
Cancer is the second leading cause of death, following heart disease, accounting for 23% of all deaths. However, within 20-year age groups, cancer is the leading cause of death among both men and women aged 40 to 79 years (Table 6).
Table 7 presents the numbers of deaths for all cancers combined and for the 5 most common sites for each 20-year age group. Among males, leukemia is the leading cause of cancer death among those aged younger than
40 years, while lung cancer ranks first among men aged 40 years and older. Among females, tumors of the brain and other nervous system are the leading cause of cancer death among children and adolescents (aged younger than 20 years), breast cancer ranks first among women aged 20 to 59 years, and lung cancer causes the most cancer deaths in those aged 60 years and older.
Regional Variations in Cancer Rates
Tables 8 and 9 depict cancer incidence and death rates for selected cancers by state. Lung cancer shows the largest geographic variation in cancer occurrence by far, reflecting the large historical and continuing differences in smoking prevalence among states.20
[image:23.595.95.532.412.698.2]For example, lung cancer incidence rates in Kentucky, which has historically had the highest smoking prevalence, are almost 4-fold higher than those in Utah, which has the lowest smoking prevalence (128 vs 34 cases per 100,000 men). In con-trast, state variations for other cancer sites are smaller in both absolute and proportionate terms. For example, the breast cancer incidence rate in Connecticut, which has the highest rate (137 per 100,000 women), is only 28% higher than that in Arizona, which has the lowest
FIGURE 6.Total Number of Cancer Deaths Averted From 1991 to 2009 in Men and From 1992 to 2009 in Women.
The blue line represents the actual number of cancer deaths recorded in each year, and the red line represents the number of cancer deaths that would have been expected if cancer death rates had remained at their peak.
Cancer Statistics, 2013
20 CA: A Cancer Journal for Clinicians
FIGURE 4.Trends in Death Rates Among Males for Selected Cancers, United States, 1930 to 2009.
Rates are age adjusted to the 2000 US standard population. Due to changes in International Classification of Diseases (ICD) coding, numerator information has changed over time. Rates for cancers of the lung and bronchus, colorectum, and liver are affected by these changes.
FIGURE 5.Trends in Death Rates Among Females for Selected Cancers, United States, 1930 to 2009.
Rates are age adjusted to the 2000 US standard population. Due to changes in International Classification of Diseases (ICD) coding, numerator information has changed over time. Rates for cancers of the uterus, ovary, lung and bronchus, and colorectum are affected by these changes.
*Uterus includes uterine cervix and uterine corpus.
18 CA: A Cancer Journal for Clinicians
Cancer Statistics, 2013
lung, and by more than 40% for prostate cancer. The decrease in lung cancer death rates—among men since 1990 and among women since 2002—is due to the reduction in tobacco use,20while the decrease in death rates
for female breast, colorectal, and prostate cancers largely reflects improvements in early detection and/or treatment.17,21,22 Over the past 10 years of data
(2000-2009), the largest annual declines in death rates were for chronic myeloid leukemia (8.4%), cancers of the stomach (3.1%) and colorectum (3.0%), and non-Hodgkin lymphoma (3.0%).
Recorded Number of Deaths From Cancer in 2009
A total of 2,437,163 deaths were recorded in the United States in 2009, 567,628 of these from cancer.23Cancer is
the second leading cause of death, following heart disease, accounting for 23% of all deaths. However, within 20-year age groups, cancer is the leading cause of death among both men and women aged 40 to 79 years (Table 6).
Table 7 presents the numbers of deaths for all cancers combined and for the 5 most common sites for each 20-year age group. Among males, leukemia is the leading cause of cancer death among those aged younger than
40 years, while lung cancer ranks first among men aged 40 years and older. Among females, tumors of the brain and other nervous system are the leading cause of cancer death among children and adolescents (aged younger than 20 years), breast cancer ranks first among women aged 20 to 59 years, and lung cancer causes the most cancer deaths in those aged 60 years and older.
Regional Variations in Cancer Rates
Tables 8 and 9 depict cancer incidence and death rates for selected cancers by state. Lung cancer shows the largest geographic variation in cancer occurrence by far, reflecting the large historical and continuing differences in smoking prevalence among states.20For example, lung
cancer incidence rates in Kentucky, which has historically had the highest smoking prevalence, are almost 4-fold higher than those in Utah, which has the lowest smoking prevalence (128 vs 34 cases per 100,000 men). In con-trast, state variations for other cancer sites are smaller in both absolute and proportionate terms. For example, the breast cancer incidence rate in Connecticut, which has the highest rate (137 per 100,000 women), is only 28% higher than that in Arizona, which has the lowest
FIGURE 6.Total Number of Cancer Deaths Averted From 1991 to 2009 in Men and From 1992 to 2009 in Women.
The blue line represents the actual number of cancer deaths recorded in each year, and the red line represents the number of cancer deaths that would have been expected if cancer death rates had remained at their peak.
Cancer Statistics, 2013
20 CA: A Cancer Journal for Clinicians
registries and for Spain as a whole, along with the years in which the trend changed.
Figure 2 depicts the trend in age-specific rates by birth cohort, plus the results that identify the age–period and cohort effects on CRC incidence and mortality among men and women. The specific rates for incidence and for mortality plot the characteristic javelin-like trajectory pattern displayed by diseases with a marked age effect, whereby such diseases register a change in trend, going from an increase to a subsequent decrease in risk from a given cohort onwards.
The cohort effect became increasingly pronounced, both in incidence and in mortality, among men and women until 1995, after which it clearly decreased in importance,
something that was very visible among the<35 age groups. The
change in the mortality trend in the 20–24 age group could not be assessed because it had been estimated on the basis of a single rate and very few cases (14 cases in men and 8 in women).
discussion
Our results indicate an important increase in CRC incidence in Spain, that remained steady across the entire study period but became slightly attenuated in both sexes around 1995, when a change-point was detected. Before this, the annual increase in incidence was 4.26% per annum among men, falling to 2.53% thereafter. Among women, the increase in incidence, albeit also
of considerable magnitude, was more moderate. The incidence trend contrasted sharply with that for mortality (Table 2), inasmuch as there was a change in trend in 1997–98, after which mortality rates in both sexes began to decline. To ascertain the origin of this pattern of change, it is useful to observe the trend in specific rates for both incidence and mortality, which reveal a cohort effect in the form of an increase in the relative risk of dying that affected generations up to and including those born from 1950 to 1960, and then decline sharply thereafter. The models show that both effects are statistically significant, with it being difficult to distinguish between the contributions attributable to cohort and those attributable to period. The divergence between incidence (upward) and mortality rates (a downward trend observed from the mid-1990s onwards) would suggest that possible explanations might lie in: enhanced access to endoscopy; increased early detection with a corresponding shift to an earlier disease stage; improvements in therapy. This trend is having important consequences insofar as disease prevalence and burden of care are concerned.
The results of this study are strengthened by: inclusion of the latest incidence data available, drawn from all population cancer registries in operation for a minimum of 10 years, with close on 90 000 cases being registered; their analysis in parallel with mortality data; and use of appropriate statistical methods for detection of changes in incidence and mortality trends and components.
Table 2. Trends in incidence (1975–2004) and mortality (1975–2007) in Spain among subjects aged>29 years, and identification of changes in trend.
Change-point Annual percentage change (95% CI)
P-values Year (95% CI) Overall Below change-point Above change-point
Men
Incidence <0.0001 1995 (1993, 1997) 3.42 (3.25, 3.59) 4.26 (3.92, 4.61) 2.53 (2.17, 2.89)
Mortality <0.0001 1998 (1996, 2000) 1.86 (1.75, 1.97) 2.88 (2.72, 3.05) –0.39 (–0.70, –0.08)
Women
Incidence 0.008 1996 (1992, 1999) 1.94 (1.75, 2.12) 2.39 (2.07, 2.72) 1.20 (0.74, 1.66)
Mortality <0.0001 1997 (1995, 2000) 0.29 (0.18, 0.39) 1.18 (1.00, 1.35) –1.51 (–1.82, –1.20)
Figure 1. Colorectal cancer in Spain. Trends in incidence (adjusted for age and registry) and mortality rates (adjusted for age) among men and women aged
>29 years, obtained from the change-point model. The vertical grey lines show the time interval when the change in trend occurred.
Annals of Oncology
original article
Volume 21|Supplement 3|May 2010 doi:10.1093/annonc/mdq091|iii79
at Universitat Autonoma Barcelona on November 18, 2013
http://annonc.oxfordjournals.org/
Downloaded from
A
ceCi a eti c
LL
i R ( CWen tc ) i tc t c )nt tel t C ce 1 ee Ccl 1 c tcI i c en
i aceCsW i C ) u 1d tc en 0 en tc t c n l C l x t I dWL8qZ%WR ntd
tc 1 tc x c u i l e i en aCi 1 c i aceCt l %tl l etdd tc C l tcI x tI aC E%
x h1 pz ce WL8q8%0
f a R d , a r r r r a n ea o n r a i Fmr r n n n ael pT3B ne 2. . Tm c n ael om2. pP , a r r r r a n ea eoea n o r a r c r v f n ea r a nai , l er l r r s el r ( 2T i a m c n ael 1c gw r n
m2. p. h
i C i ( CWen C C ci e i cds t C c l u i cI i aceCt l W 0 tc t c c
u i Ce dtes C e l ( Cs i cl t C ds u i cI C t d c enct I Ci a1l x d L%0
Lifetime Probability of Developing Cancer
The lifetime probability of being diagnosed with an invasive cancer is higher for men (45%) than for women (38%) (Table 4). However, because of the earlier median age at diagnosis for breast cancer compared with other major cancers, women have a slightly higher probability of developing cancer before age 60 years. These estimates are based on the average experience of the general population and may over- or underestimate individual risk because of differences in exposure (eg, smoking history) and/or genetic susceptibility.
Trends in Cancer Incidence
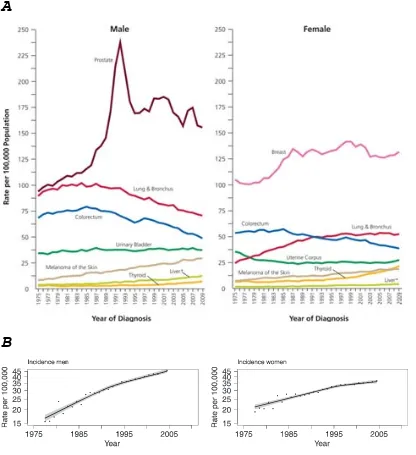
Figures 2 to 5 depict long-term trends in cancer incidence and death rates for all cancers combined and for selected cancer sites by sex. While incidence rates are declining for most cancer sites, they are increasing among both men and women for melanoma of the skin and cancers of the liver and thyroid (Fig. 3, Table 5). Table 5 shows incidence (delay-adjusted) and mortality trends for all cancers com-bined and for selected cancer sites based on joinpoint regres-sion analysis. Joinpoint is a tool used to describe and quantify trends by fitting observed rates to lines connected at ‘‘join-points’’ where trends change in direction or magnitude.13,15
According to data from the SEER 13 cancer registries, inci-dence rates in the most recent 5 years (2005-2009) decreased in males by 0.6% per year and were stable in females (Table 5). Incidence rates are decreasing for all 4 major cancer sites except female breast, for which rates remained relatively stable from 2005 to 2009 after decreasing by 2% per year from 1999 to 2005. Lung cancer incidence rates in women began declining in the late 1990s, more than a decade after the decline began in men.6Differences in lung cancer inci-dence patterns between men and women reflect historical differences in tobacco use; cigarette smoking prevalence peaked about 20 years later in women than in men.16Recent
[image:24.595.102.518.167.622.2]rapid declines in colorectal cancer incidence rates have largely been attributed to increases in screening that can detect and allow the removal of precancerous polyps.17-19 Although joinpoint trend analysis shows that the incidence rate for prostate cancer declined steadily by 1.9% per year from 2000 to 2009, it is important to realize that annual rates fluctuate widely (Fig. 3), likely reflecting variation in the prevalence of prostate-specific antigen testing for the detection of prostate cancer. For example, in the SEER 13 areas, the delay-adjusted prostate cancer incidence rate increased from 154 (per 100,000) to 164 from 2005 to 2006, then dropped from 168 to 153 from 2007 to 2008.
FIGURE 3.Trends in Incidence Rates for Selected Cancers by Sex, United States, 1975 to 2009. Rates are age adjusted to the 2000 US standard population and adjusted for delays in reporting.
*Liver includes intrahepatic bile duct.
VOLUME 63_NUMBER 1_JANUARY/FEBRUARY 2013 17
CA CANCER J CLIN 2013;63:11–30
registries and for Spain as a whole, along with the years in which the trend changed.
Figure 2 depicts the trend in age-specific rates by birth cohort, plus the results that identify the age–period and cohort effects on CRC incidence and mortality among men and women. The specific rates for incidence and for mortality plot the characteristic javelin-like trajectory pattern displayed by diseases with a marked age effect, whereby such diseases register a change in trend, going from an increase to a subsequent decrease in risk from a given cohort onwards.
The cohort effect became increasingly pronounced, both in incidence and in mortality, among men and women until 1995, after which it clearly decreased in importance,
something that was very visible among the<35 age groups. The
change in the mortality trend in the 20–24 age group could not be assessed because it had been estimated on the basis of a single rate and very few cases (14 cases in men and 8 in women).
discussion
Our results indicate an important increase in CRC incidence in Spain, that remained steady across the entire study period but became slightly attenuated in both sexes around 1995, when a change-point was detected. Before this, the annual increase in incidence was 4.26% per annum among men, falling to 2.53% thereafter. Among women, the increase in incidence, albeit also
of considerable magnitude, was more moderate. The incidence trend contrasted sharply with that for mortality (Table 2), inasmuch as there was a change in trend in 1997–98, after which mortality rates in both sexes began to decline. To ascertain the origin of this pattern of change, it is useful to observe the trend in specific rates for both incidence and mortality, which reveal a cohort effect in the form of an increase in the relative risk of dying that affected generations up to and including those born from 1950 to 1960, and then decline sharply thereafter. The models show that both effects are statistically significant, with it being difficult to distinguish between the contributions attributable to cohort and those attributable to period. The divergence between incidence (upward) and mortality rates (a downward trend observed from the mid-1990s onwards) would suggest that possible explanations might lie in: enhanced access to endoscopy; increased early detection with a corresponding shift to an earlier disease stage; improvements in therapy. This trend is having important consequences insofar as disease prevalence and burden of care are concerned.
The results of this study are strengthened by: inclusion of the latest incidence data available, drawn from all population cancer registries in operation for a minimum of 10 years, with close on 90 000 cases being registered; their analysis in parallel with mortality data; and use of appropriate statistical methods for detection of changes in incidence and mortality trends and components.
Table 2. Trends in incidence (1975–2004) and mortality (1975–2007) in Spain among subjects aged>29 years, and identification of changes in trend.
Change-point Annual percentage change (95% CI)
P-values Year (95% CI) Overall Below change-point Above change-point
Men
Incidence <0.0001 1995 (1993, 1997) 3.42 (3.25, 3.59) 4.26 (3.92, 4.61) 2.53 (2.17, 2.89)
Mortality <0.0001 1998 (1996, 2000) 1.86 (1.75, 1.97) 2.88 (2.72, 3.05) –0.39 (–0.70, –0.08)
Women
Incidence 0.008 1996 (1992, 1999) 1.94 (1.75, 2.12) 2.39 (2.07, 2.72) 1.20 (0.74, 1.66)
Mortality <0.0001 1997 (1995, 2000) 0.29 (0.18, 0.39) 1.18 (1.00, 1.35) –1.51 (–1.82, –1.20)
Figure 1. Colorectal cancer in Spain. Trends in incidence (adjusted for age and registry) and mortality rates (adjusted for age) among men and women aged
>29 years, obtained from the change-point model. The vertical grey lines show the time interval when the change in trend occurred.
Annals of Oncology
original article
Volume 21|Supplement 3|May 2010 doi:10.1093/annonc/mdq091|iii79
at Universitat Autonoma Barcelona on November 18, 2013
http://annonc.oxfordjournals.org/
Downloaded from
A
ceCi a eti c
LZ
o 2 d r r r l ean oni a n i Fma r n r ni mr r n n n ael 2. . B ne 2. . Th c n ael om2. pPh
n l tl l tu td Ctet l tc i di C e d tc t c c u i Ce dtes eR c t C ce
i aceCt l i C enct dI Ci a1l u s eeCt ae tc 1 Ce ei oci R c ei Cl l a n l
)1i l aC ei Ctl o ei Cl x1i ddaeti c tc en tCW t eW d i ni dtce o T %W l l ei
ntI nz9a dtes l C ctcI Wetu ds t I ci l tl c en 9a dtes i en eC eu ce0
eoea n o r a a C nea
( C dCtl o ei Cl C l l i t e R ten en tc t c i i di C e d c C0 n C
C eR i es1 l i Ctl o ei Cl 2 en ci c zu i t t d Ctl o ei Cl c en
c( tCi cu ce dCtl o ei Cl 0
er wl e o a C nea y
k I 2 c C tl c I zC d e tddc l l c i di C e d c C tl d C
) u 1d i te0 i C en c ó8D i i di C e d c C l l i aC tc 1 i 1d I : 8
i Ci d Cx t l WL887%0 n tc t c C e tl u i C en c : 8 etu l ntI n Ctc /8
ei Uó s Cl i d 1 i 1d en c tc eni l si acI C en c E8 s Cl 0 i R ( CWen
tc t c tl I Ci R tcI tc si acI 1 i 1d 0 i R sl tc en 0 Wi di C e d c C tl
u i cI en q8 u i l e i u u i cds t I ci l c C tc R i u c c u c I
eR c L8 c Eó x tCd s WL88/%0
k Cl i c d tl ei Cs i ci u ei al i ds1l 2 i ds1l C i cl 9a c i
en cn c I Ci R en i en i di c 1ten dtau etl l a x tI aC : % c C 1C aCl i C
d l ti cl i i di c C tci u l x tc R C Wqóó/%0 n dt etu Ctl o i
( di 1tcI c ci u tl )eC u ds ntI n, te n l c l aI I l e en e
l su 1ei u et ctI c ci u l C i ac tc u i C en c E8D i en tc t( t a dl
i ( C en I i : 8 s Cl x dt el ei l F i ado l WL88/%0 Cds ó: D i l 1i C t
i di C e d c Cl Ctl Ci u en l ci u l x I I C F i al n sWL88ó%0 n
White African American Assian American and Pacific islanders and Alaska native American Indian Hispanic
Incidence
Male 52.8 65.1 41.4 50.7 46.9
Female 39.2 48.0 32.1 41.1 33.3
Mortality
Male 19.5 29.8 13.1 18.8 15.3
ceCi a eti c
LE
eC eu ce i cl tl el tc en C u i ( d i en 1i ds1l WR nt n C a l en Ctl o i
( di 1tcI i di C e d C tci u l x tc R C Wqóó/%0
f a B dv , l n m neoe o r l ae ec a c a r n ner e r o eoea n oc eoi c h v , l o a r el nef c eoi c e eoer c n r nh c n ael s s s hs C c hea 0
k cn Cte I c et Ctl oW u tdt d ci u ei al 1i ds1i l tl x % c
n C te Cs ci cz1i ds1i l tl i di C e d c C x %2 tl c tcn Cte
i c teti c tc R nt n cau Ci al 1i ds1l C i Cu tc en 1ten dtau i en d CI
tce l etc x tI aC : %0 tl al s u ae eti cl tc en eau i C l a11C l l i C I c
x Ct d WL88q, ddtl Wqóóó%0 tl n C e Ctp s en
( di 1u ce i u adet1d ci u ei al 1i ds1l Wte n l c tc t c e tCen i
A
Introduction
25
about 1/8,300 and it manifests equally in both sexes. FAP just accounts for less than 1% of colorectal cancer cases (Galiatsatos & Foulkes, 2006). Most of the colorectal cancer patients (~70%) have a family history of colorectal polyps and cancer. Generally cancer starts to develop a decade after the appearance of the polyp, they normally are asymptomatic until the large number of them cause rectal bleeding or other complications. Without treatment, FAP individuals carry 100% of possibilities of developing colorectal cancer.
Hereditary non-‐polyposis colorectal cancer (HNPCC) or Lynch syndrome is another inherited disease caused by mutations on DNA mismatch repair genes, mainly MLH1 and MSH2. In addition to colorectal cancer, HNPCC patients show an increased relative risk in other cancers such as uterus, stomach, small bowel, pancreas, kidney and ureter. In contrast to FAP patients, HNPCC individuals develop few adenomas. Without treatment individuals affected with HNPCC have an approximate 80% lifetime risk of developing colon cancer (Lynch et al., 2009; Weissman et al., 2011).
· Inflammatory bowel disease (IBD): IBD includes two diseases: ulcerative colitis and Crohn disease. Ulcerative colitis causes inflammation of the mucosa of the colon and rectum. Crohn disease causes inflammation of the full thickness of the bowel wall and may involve any part of the digestive tract from the mouth to the anus. These inflammatory conditions are known to increase the risk of developing colorectal cancer (Triantafillidis et al., 2009). In patients with inflammatory bowel disease the relative risk of developing colorectal cancer has been estimated to be increased 4 to 20 fold (Haggar & Boushey, 2009).
Environmental risk factors:
Introduction
26
perhaps enhances the uncontrolled cellular growth (Chan & Giovannucci, 2010). Other relevant hypothesis propose red meat as a source of heme iron, which catalyzes the oxidation of polyunsaturated fats to some compounds that are known risk factors for several human diseases, such as Malondialdehyde or 4-‐ Hydroxynonenal (Bastide et al., 2011).
Fiber intake has also been linked with colorectal cancer where a reduced impact was observed in some African populations with high-‐fiber diet more than 4 decades ago (O’Keefe et al., 1999). Since then, many studies have been testing this hypothesis, some of them successfully and others not (Chan & Giovannucci, 2010; Huxley et al., 2012). Anyway, it has been proposed that fiber could dilute or adsorb fecal carcinogens, modulate colonic transit time, alter bile acid metabolism, reduce colonic pH, or increase the production of short-‐chain fatty acids (Huxley et al., 2012).
It is well known that the composition of the individual’s flora can fluctuate under some circumstances and is deeply affected by dietary habits (Grölund et al., 1999; Smith, 1965). The human gut is the natural habitat for a large and dynamic bacterial community but a substantial part of these bacterial populations are still to be described. Out of curiosity, in the large intestine we can find bacterial concentrations up to 1011 or 1012 cells/g of luminal contents
(Guarner & Malagelada, 2003), these concentrations are similar to those found in colonies growing under optimum conditions over the surface of a laboratory plate. Intestinal bacteria could play a role in initiation of colon cancer through production of carcinogens, co-‐carcinogens or pro-‐carcinogens. Furthermore, some intestinal microorganisms strongly increase damage to DNA in colon cells induced by heterocyclic amines, whereas other intestinal bacteria can uptake and detoxify such compounds (Wollowski et al., 2001).
Introduction
27
Obesity (commonly accompanied by diabetes type II) is also a cancer risk factor, although the molecular mechanisms are not well understood. There are some evidences that obese people have more of the mitogenic factor insulin-‐like growth factor 1 in their bloodstream (Renehan et al., 2003), what could predispose cells to uncontrolled cellular growth. Adipose tissue is a complex, essential, highly active metabolic and endocrine organ (Kershaw & Flier, 2004). Polypeptide hormones derived from adipocytes are known as adipokines, among them, leptin and adiponectin are linked to cancer. Leptin concentration is directly correlated with the amount of body fat and is regulated by insulin. Leptin is adipogenic, antiapoptotic and mitogenic for various cell types, including hematopoietic progenitor cells, normal and transformed epithelial cells, and vascular endothelial cells (Bray, 2002; Rose et al., 2004; Vona-‐Davis & Rose, 2007). Adiponectin is the most abundant of adipokines, it is an insulin-‐sensing hormone and unlike leptin, its correlation is inverse with body mass index and appears in low levels in cancer patients (Roberts et al., 2010).
· Alcohol intake: The risk factor that alcohol represents to some cancers
like gastric or liver is clearly demonstrated, whereas in the case of colorectal cancer is not so well understood. Some studies point out that moderate and heavy drinking alcohol was associated with a 21% and 52% increased risk for colorectal cancer, respectively (Fedirko et al., 2011). The results for alcohol drinking and colorectal cancer risk appeared to be similar between men and women.
· Cigarette Smoking: Colorectal cancer has not historically been linked to cigarette smoking although nowadays it is known that heavy cigarette smokers have a 2-‐3 fold elevated risk of developing colorectal adenomas (Giovannucci, 2001). Overall, cumulated evidences within the past decade support the addition of colorectal cancer to the list of tobacco-‐associated malignancies. It is known that tobacco’s carcinogens could reach the colorectal mucosa and produce cellular damage that could trigger the cancerous process (Fu et al., 2013; Wei et al., 2009).
ceCi a eti c
L7
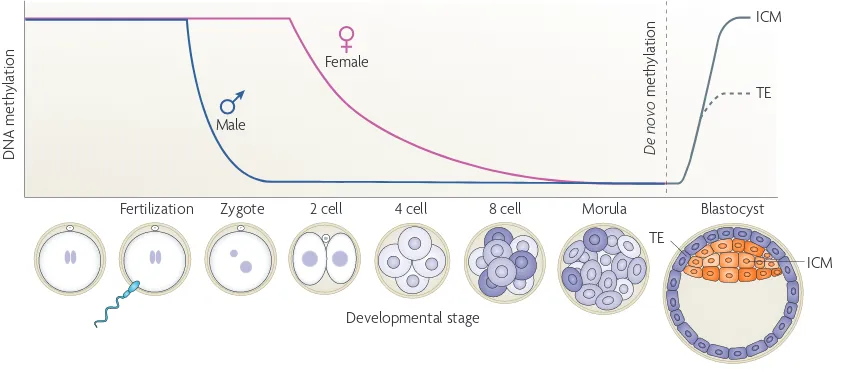
eoea n o r a n c s c ae a er l e o
i di C e d c C tl di cI etu u adetl e 1 tl l Wen u ri Ctes i eau i Cl e o
s Cl ei ( di 1W ( c l i ad 1 l l ei ( di 1 C tci u Ci u ci Cu d
dd0 aCtcI entl etu ci Cu d ddl u al e 9atC c Ci al eaC l ei ( cea dds
1Ci a eau i C x Ci c F i I dl e tcWqóó8%0 n l c Ci al eaC l C
oci R c l en n ddu Col i c C c R C 1i l ead e tc L888 s i aI d l
c n c c i Ce tc CI x c n c F tc CI WL888% c C ( tl tc
L8qq s en l u aeni Cl x tI aC /%x c n c F tc CI WL8qq%0 n s tc
en ti di I t d1Ci l l l en e ci Cu d ddl ni ad i ( C1 l l ei i u u dtI c ce0
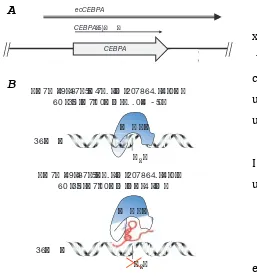
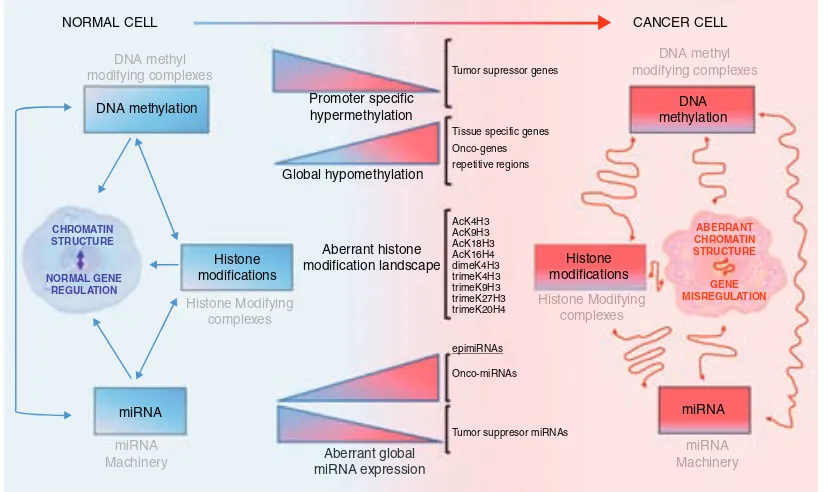
f a 0 d o v , r a u v , ool aC e r ah r n o n i a c ae f a f o nr oof o a r a n m r el r n oni r l f n ner m ue r l l f r naf ner r nf l eawc ael enr r o l l ner u r nn a f r a nee r er a af o ea nf l ea
u oec l r nh c n ael r r | r a m2. . . r 2. pph
n l n ddu Col i ci e C C ei u d ac eti c i l 1 t t I c l Wen s i al tc
1 enR sl i C ti di I t d ac eti cl de C tc c C c i ci e i ddi R l 1 t t
i C Ci 9atl teti c0
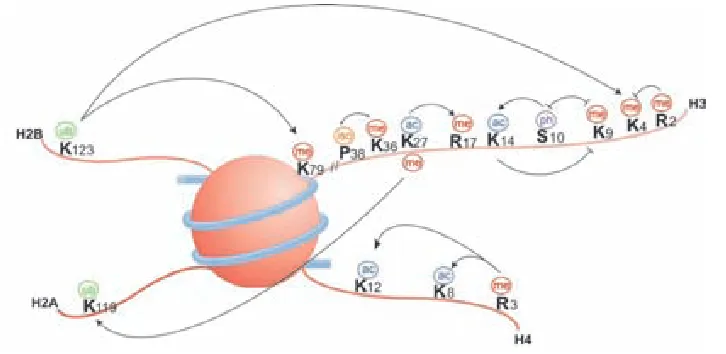
Ci u u i d ad C1i tcei ( t R Wen de C eti c i en ci Cu d ddad C n o1i tcel
tl a ei n cI l tc en I c et l i C 1tI c et l i l 1 t t I c l 0 i tc en
u ae eti c d l 1 eCau tc i di C e d c CW n c C ci u ed l 1Ci r e
1 C i Cu )i u 1eaC l 9a c tcI i c LLE eau i C c ci Cu du e n
1 tCl 0 n u i l e C 9a ceds u ae e I c l R C W : ZW W Z W
UW EW U LW W qW LW qLZ c ó0 dd
u ae eti cl R C tc et( etcI u ae eti cl ) 1e i C c I c l WR ni l
u ae eti cl C al a dds i c i I ct c di e tc en i i c qLWqZ i C /q
x a n Cd 1 et F n d CWL8qL%0 c en l u R i CoWen s i u 1 C nCi u i l i u d
c l a z nCi u i l i u d n cI l tc L: U eau i Cl W e etcI L7 C aCC ce d eti cl W
etcI C d ( ce I c l l a n l W qW W EW W c
number and thus maintenance of normal tissue architecture and function. Cancer cells, by deregulating these signals, become masters of their own destinies. The enabling signals are conveyed in large part by growth factors that bind cell-surface receptors, typically containing intracellular tyrosine kinase domains. The latter proceed to emit signals via branched intra-cellular signaling pathways that regulate progression through the cell cycle as well as cell growth (that is, increases in cell size); often these signals influence yet other cell-biological prop-erties, such as cell survival and energy metabolism.
Remarkably, the precise identities and sources of the prolifer-ative signals operating within normal tissues were poorly under-stood a decade ago and in general remain so. Moreover, we still know relatively little about the mechanisms controlling the release of these mitogenic signals. In part, the understanding of these mechanisms is complicated by the fact that the growth factor signals controlling cell number and position within tissues are thought to be transmitted in a temporally and spatially regu-lated fashion from one cell to its neighbors; such paracrine signaling is difficult to access experimentally. In addition, the bioavailability of growth factors is regulated by sequestration in the pericellular space and extracellular matrix, and by the actions of a complex network of proteases, sulfatases, and possibly other enzymes that liberate and activate them, apparently in a highly specific and localized fashion.
[image:30.595.92.529.262.412.2]The mitogenic signaling in cancer cells is, in contrast, better understood (Lemmon and Schlessinger, 2010; Witsch et al., 2010; Hynes and MacDonald, 2009; Perona, 2006). Cancer cells can acquire the capability to sustain proliferative signaling in a number of alternative ways: They may produce growth factor ligands themselves, to which they can respond via the expres-sion of cognate receptors, resulting in autocrine proliferative stimulation. Alternatively, cancer cells may send signals to stim-ulate normal cells within the supporting tumor-associated stroma, which reciprocate by supplying the cancer cells with various growth factors (Cheng et al., 2008; Bhowmick et al., 2004). Receptor signaling can also be deregulated by elevating the levels of receptor proteins displayed at the cancer cell
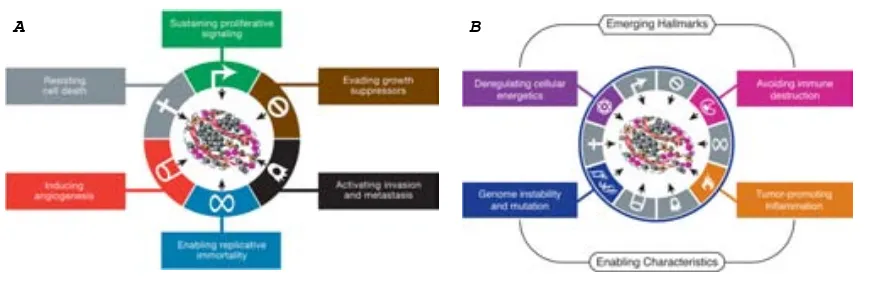
Figure 1. The Hallmarks of Cancer
This illustration encompasses the six hallmark capabilities originally proposed in our 2000 per-spective. The past decade has witnessed remarkable progress toward understanding the mechanistic underpinnings of each hallmark.
surface, rendering such cells hyperre-sponsive to otherwise-limiting amounts of growth factor ligand; the same outcome can result from structural alter-ations in the receptor molecules that facilitate ligand-independent firing.
Growth factor independence may also derive from the constitutive activation of components of signaling pathways oper-ating downstream of these receptors, obviating the need to stimulate these pathways by ligand-mediated receptor activation. Given that a number of distinct downstream signaling pathways radiate from a ligand-stimulated receptor, the activa-tion of one or another of these downstream pathways, for example, the one responding to the Ras signal transducer, may only recapitulate a subset of the regulatory instructions transmitted by an activated receptor.
Somatic Mutations Activate Additional Downstream Pathways
High-throughput DNA sequencing analyses of cancer cell genomes have revealed somatic mutations in certain human tumors that predict constitutive activation of signaling circuits usually triggered by activated growth factor receptors. Thus, we now know that !40% of human melanomas contain activating mutations affecting the structure of the B-Raf protein, resulting in constitutive signaling through the Raf to mitogen-activated protein (MAP)-kinase pathway (Davies and Samuels 2010). Similarly, mutations in the catalytic subunit of phosphoi-nositide 3-kinase (PI3-kinase) isoforms are being detected in an array of tumor types, which serve to hyperactivate the PI3-kinase signaling circuitry, including its key Akt/PKB signal transducer (Jiang and Liu, 2009; Yuan and Cantley, 2008). The advantages to tumor cells of activating upstream (receptor) versus downstream (transducer) signaling remain obscure, as does the functional impact of crosstalk between the multiple pathways radiating from growth factor receptors.
Disruptions of Negative-Feedback Mechanisms that Attenuate Proliferative Signaling
Recent results have highlighted the importance of negative-feedback loops that normally operate to dampen various types of signaling and thereby ensure homeostatic regulation of the flux of signals coursing through the intracellular circuitry (Wertz and Dixit, 2010; Cabrita and Christofori, 2008; Amit et al., 2007; Mosesson et al., 2008). Defects in these feedback mech-anisms are capable of enhancing proliferative signaling. The prototype of this type of regulation involves the Ras oncoprotein: the oncogenic effects of Ras do not result from a hyperactivation of its signaling powers; instead, the oncogenic mutations affectingrasgenes compromise Ras GTPase activity, which
Cell144, March 4, 2011ª2011 Elsevier Inc. 647
Yet other distinct attributes of cancer cells have been proposed to be functionally important for the development of cancer and might therefore be added to the list of core hallmarks (Negrini et al., 2010; Luo et al., 2009; Colotta et al., 2009). Two such attributes are particularly compelling. The first involves major reprogramming of cellular energy metabolism in order to support continuous cell growth and proliferation, replacing the metabolic program that operates in most normal tissues and fuels the physiological operations of the associated cells. The second involves active evasion by cancer cells from attack and elimination by immune cells; this capability highlights the dichot-omous roles of an immune system that both antagonizes and enhances tumor development and progression. Both of these capabilities may well prove to facilitate the development and progression of many forms of human cancer and therefore can be considered to be emerging hallmarks of cancer. These enabling characteristics andemerging hallmarks,depicted in
Figure 3, are discussed individually below.
An Enabling Characteristic: Genome Instability and Mutation
Acquisition of the multiple hallmarks enumerated above depends in large part on a succession of alterations in the genomes of neoplastic cells. Simply depicted, certain mutant genotypes confer selective advantage on subclones of cells, enabling their outgrowth and eventual dominance in a local tissue environment. Accordingly, multistep tumor progression can be portrayed as a succession of clonal expansions, each of which is triggered by the chance acquisition of an enabling mutant genotype. Because heritable phenotypes, e.g., inactivation of tumor suppressor genes, can also be acquired through epigenetic mechanisms such as DNA methylation and histone modifications
(Berdasco and Esteller, 2010; Esteller, 2007; Jones and Baylin,
2007), some clonal expansions may well be triggered by nonmu-tational changes affecting the regulation of gene expression.
The extraordinary ability of genome maintenance systems to detect and resolve defects in the DNA ensures that rates of spontaneous mutation are usually very low during each cell generation. In the course of acquiring the roster of mutant genes needed to orchestrate tumorigenesis, cancer cells often increase the rates of mutation (Negrini et al., 2010; Salk et al., 2010). This mutability is achieved through increased sensitivity to mutagenic agents, through a breakdown in one or several components of the genomic maintenance machinery, or both. In addition, the accumulation of mutations can be accelerated by compromising the surveillance systems that normally monitor genomic integrity and force genetically damaged cells into either senescence or apoptosis (Jackson and Bartek, 2009; Kastan, 2008; Sigal and Rotter, 2000). The role of TP53 is central here, leading to its being called the ‘‘guardian of the genome’’ (Lane, 1992).
A diverse array of defects affecting various components of the DNA-maintenance machinery—often referred to as the ‘‘care-takers’’ of the genome (Kinzler and Vogelstein, 1997)—have been documented. The catalog of defects in these caretaker genes includes those whose products are involved in (1) detect-ing DNA damage and activatdetect-ing the repair machinery, (2) directly repairing damaged DNA, and (3) inactivating or intercepting mutagenic molecules before they have damaged the DNA
(Negrini et al., 2010; Ciccia and Elledge, 2010; Jackson and
Bartek, 2009; Kastan, 2008; Harper and Elledge, 2007; Friedberg et al., 2006). From a genetic perspective, these caretaker genes behave much like tumor suppressor genes, in that their functions can be lost during the course of tumor progression, with such losses being achieved either through inactivating mutations or via epigenetic repression. Mutant copies of many of these care-taker genes have been introduced into the mouse germline and result, predictably, in increased cancer incidence, supporting their potential involvement in human cancer development (Barnes and Lindahl, 2004).
Figure 3. Emerging Hallmarks and Enabling Characteristics
An increasing body of research suggests that two additional hallmarks of cancer are involved in the pathogenesis of some and perhaps all cancers. One involves the capability to modify, or repro-gram, cellular metabolism in order to most effec-tively support neoplastic proliferation. The second allows cancer cells to evade immunological destruction, in particular by T and B lymphocytes, macrophages, and natural killer cells. Because neither capability is yet generalized and fully vali-dated, they are labeled as emerging hallmarks. Additionally, two consequential characteristics of neoplasia facilitate acquisition of both core and emerging hallmarks. Genomic instability and thus mutability endow cancer cells with genetic alter-ations that drive tumor progression. Inflammation by innate immune cells designed to fight infections and heal wounds can instead result in their inad-vertent support of multiple hallmark capabilities, thereby manifesting the now widely appreciated tumor-promoting consequences of inflammatory responses.
658 Cell144, March 4, 2011ª2011 Elsevier Inc.