COMMUNICATION
Controlling the CO adsorption on Pt clusters by dopant induced
electronic structure modification
Piero Ferrari,
[a]Luis M. Molina,*
[b]Vladimir E. Kaydashev,
[a]Julio A. Alonso,
[b]Peter Lievens,
[a]and
Ewald Janssens,*
[a]Abstract: A major drawback of state-of-the-art proton exchange membrane fuel cells is the CO poisoning of platinum catalysts. It is known that CO poisoning is reduced if platinum alloys are used, but the underlying mechanism therefore is still under debate. We study the influence of dopant atoms on the CO adsorption on small platinum clusters using mass spectrometry experiments and density functional theory calculations. A significant reduction in the reactivity for Nb and Mo doped clusters is attributed to electron transfer from those highly coordinated dopants to the Pt atoms and the concomitant lower CO binding energies. On the other hand Sn and Ag dopants have a lower Pt coordination and have a limited effect on the CO adsorption. Analysis of the density of states demonstrates a correlation of dopant induced changes in the electronic structure with the enhanced tolerance to CO poisoning.
The development of efficient fuel cells is a promising strategy to diminish the dependence on fossil fuel by making use of environmentally friendly energy sources.[1] Proton exchange
membrane fuel cells (PEMFCs) are highly susceptible to CO poisoning of the platinum catalyst.[2] CO molecules, present as
trace components in the fuel, preferentially adsorb on Pt nanoparticles, thereby blocking the active sites and degrading the cell’s performance. Several Pt alloys, such as Pt–X (X = Sn, Ru, Mo, Nb, W, Ag, and Ni), are known for an enhanced tolerance to the CO poisoning and thus improve the performance of the fuel cell.[3-7] The physical mechanism
responsible for the tolerance has been extensively studied and is ascribed to an alteration of the local electronic structure at the reaction site upon alloying and/or to a bi-functional mechanism, in which OH groups adsorbed on the alloying agent interact with CO and form CO2 and H2, which are released from the catalyst,
regenerating the active sites.[3]
The interaction of transition metal surfaces with CO is a complex problem which has been described by three qualitative models: the d-band center model,[8] the Blyholder model,[9] and
the π-σ model.[10] In the Blyholder model, the Pt-CO interaction
is described by donation of electron density from the CO 5σ orbital to empty Pt 5d states and back-donation from occupied Pt 5d states to the CO 2π* antibonding orbital. The bottom-line of local electronic structure modifications as explanation for the CO tolerance in Pt–X alloy nanoparticles is that electron transfer from the alloying agent to the empty Pt 5d states reduces the Pt–CO bonding strength.[11]
Although few-atom platinum clusters in the gas phase differ significantly in size and in environmental conditions from the nanoparticles used in PEMFCs, they can provide a better understanding for the enhanced tolerance to CO poisoning. The CO binding is a local event, which poisons a Pt active site. Clusters in molecular beams are ideal model system for complex processes that depend on local chemistry. Conditions (cluster size, composition, and charge state) are well controlled in a gas phase experiment. In addition, reactions with unknown molecules are excluded if the experiments are performed under high vacuum conditions while the small size of the clusters allows for direct comparison with quantum chemical calculations.[12,13] For instance, studies on the small Pd
6+ cluster
identified the Pd6O4+ oxide as a key intermediate in the catalytic
combustion of CO.[14] Joined experimental and theoretical
studies on VxOy+ clusters elucidated the nature of the active site
in the catalytic ethylene oxidation on vanadium oxide,[15] and
experiments on Au2+ clusters demonstrated the activation of
methane on Au with subsequent release of ethylene.[16]
Here we combine mass spectrometric experiments and density functional theory (DFT) calculations to study the influence of dopant atoms on the CO adsorption on small Pt clusters. The size-selected clusters are ideal model systems to investigate how doping modifies the local electronic structure at the active Pt site, thereby altering the CO adsorption strength. At the same time, the experimental high vacuum conditions eliminate the presence of bi-functional mechanisms.[17]
Cationic doped Pt clusters, XPtn+ (X = Mo, Nb, Sn, and Ag;
13 ≤ n ≤ 23), are produced in a dual-target dual-laser vaporization source. The room temperature clusters are subsequently exposed to CO gas in a low-collision reaction cell and the abundances of the cluster–CO complexes are analyzed by time-of-flight mass spectrometry.[18] With the used CO
pressures (pCO = 0 to 0.05 Pa) up to two CO molecules are
adsorbed on the clusters.
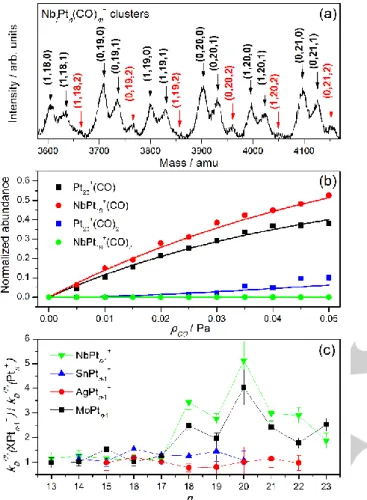
A part of the mass spectrum of pure and Nb doped Pt clusters, recorded for a CO pressure of 0.05 Pa in the collision cell, is presented in Figure 1a. For all bare Ptn+ clusters,
complexes with one and two CO molecules are formed, while for the doped NbPtn-1+ (n = 18–22) clusters the intensity of the
complexes with two CO molecules is low. This clearly illustrates the influence of Nb doping on the likelihood for CO adsorption. The molecular beam of clusters interacts with CO in the collision cell and formed complexes are mass analyzed about 100 μs later, corresponding to the flight time from the cell to the
[a] P. Ferrari, Dr. V. E. Kaydashev*, Prof. Dr. P. Lievens, Prof. Dr. E. Janssens,
Laboratory of Solid State Physics and Magnetism KU Leuven
Celestijnenlaan 200D, 3001 Leuven (Belgium) E-mail: [email protected] [b] Prof. Dr. L. M. Molina, Prof. Dr. J. A. Alonso
Department of Theoretical, Atomic and Optical Physics Universidad de Valladolid
Paseo Belén 7, 47011 Valladolid (Spain) E-mail: [email protected]
*Current address: Laboratory of Nanomaterials, Southern Federal University, 344090 Rostov-on-Don (Russia)
Supporting information for this article is given via a link at the end of the document.
extraction zone of the mass spectrometer. The influence of the Nb dopant is mainly reflected on the adsorption of the second CO molecule and in the n = 18–22 size range, which is a consequence of the time scale of the experiment and is explained below.
Figure 1b illustrates the pressure dependent kinetics data, which reveal an increase in the cluster–(CO) and cluster–(CO)2
complexes with pCO. The formation of cluster–CO complexes
can be described by a two-step reaction mechanism, characterized by forward (𝑘𝑓(1,2)) and backward (𝑘𝐷(1,2)) reaction
coefficients for adsorption and desorption of the first (1) and second (2) CO molecule:[18]
Pt𝑛++ 2CO
𝑘𝐷(1)
⇆ 𝑘𝑓(1)
PtN(CO)++ CO
𝑘𝐷(2)
⇆ 𝑘𝑓(2)
Pt𝑛(CO)2+ (1)
Pt𝑛(CO)2+ 𝑘
𝐷(2)
→ Pt𝑛(CO)++ CO 𝑘𝐷(1)
→ Pt𝑛++ CO (2)
where (1) and (2) represent the reaction mechanism for clusters in and after the reaction cell.
The fits presented in Figure 1b show that 𝑘𝑓(1) and 𝑘𝑓(2)can
be approximated by hard-sphere collision rates, while the size-and dopant dependent strength of the cluster–(CO)1,2 bonds is
reflected in the magnitude of 𝑘𝐷(1,2).[19] A detailed description of
this procedure and the validity of the underlying analysis is presented as Supporting Information.
The dependence of the unimolecular dissociation rates on the CO adsorption energies can be simulated with statistical RRKM analysis (see Supporting Information). Desorption rates of the first CO molecule, 𝑘𝐷(1), are found slower than the time scale of the experiment. This explains why size and dopant dependences are only seen in the desorption of the second CO molecule. 𝑘𝐷(2)is significantly higher than 𝑘𝐷(1), because the
corresponding clusters are internally heated by adsorption of two instead of one CO molecule. For example, assuming binding energies of 2.4 eV and 2.0 eV for the first and second CO molecule on Pt19+ (cfr. DFT calculation in Supporting
Information), the simulated value of 𝑘𝐷(2) is 6·103 s-1. A dopant
induced reduction of the adsorption energies by 0.4 eV results in an increase of 𝑘𝐷(2) to about 107 s-1. Such a high 𝑘𝐷(2) implies
dissociation before detection and thus a strong reduction in the measured abundance of the doped cluster–(CO)2 complex.
Because of the finite size of the heat bath, 𝑘𝐷(1,2) strongly
depends on the size of the cluster. In a small cluster, with few degrees of freedom, the same CO adsorption energy results in a large temperature increase and thus a high unimolecular dissociation rate.[17] For example, no cluster–(CO)
2 complexes
are observed for clusters with less than 17 atoms, since they all dissociate on the time scale of the experiment. Also this observation can be well explained by the RRKM simulations (see Supporting Information).
Figure 1c presents the ratio of the fitted dissociation rates
𝑘𝐷(2) for the doped clusters (with X = Mo, Nb, Sn, and Ag) to that
of pure Pt clusters as a function of cluster size. Comparing clusters of the same size one can make abstraction of the heat bath effect on the dissociation rates and directly probe the influence of the dopant atom. It is remarkable that 𝑘𝐷(2) is not
significantly affected by the substitution of Pt for Sn or Ag dopants (𝑘𝐷(2) ratio in Figure 1c is around unity), while doping
with Mo or Nb leads to a strong increase in 𝑘𝐷(2) for n > 17
cluster sizes. This different behavior in terms of CO binding energies will be describedfurther.
Density functional theory (DFT) was used to analyze the chemical bonding of CO with representative Pt19+ and XPt18+ (X
= Nb, Mo, Ag, and Sn) clusters. Simulations were carried out within the projector augmented-wave method as implemented in the GPAW software using a 20 Å cubic cell.[20,21] The spacing of
the real-space 3D grid was set to 0.2 Å and exchange-correlation effects were modelled with the PBE functional.[22,23]
The SCF convergence threshold was set to 10-6 eV/e-. Structure
optimization was carried out using the BFGS (Quasi-Newton) algorithm until forces were below 0.01 eV/Å.
The lowest energy structural isomer found for Pt19+ has an
octahedral shape, which has also been predicted computationally for neutral Pt19.[24] Isomers for XPt18+ are
explored by substituting inequivalent sites of Pt19+ with the
dopant atom, followed by local structural optimization. The
Figure 1. a) Part of the mass spectrum of pure and Nb doped Pt clusters exposed to 0.05 Pa of CO gas. The label (l,n,m) refers to the composition of the complexes NblPtn(CO)m+. (CO)2 complexes are
marked in red. b) Fit of normalized intensities of (CO) and (CO)2
complexes of Pt20+ and NbPt19+ clusters as a function of pCO. c) Size
dependence of the ratio of backward reaction coefficients 𝑘𝐷(2) of
doped to pure Pt clusters.
1
obtained minimum energy structures are shown in Figure 2. Nb and Mo preferentially locate at the cluster core, whereas Ag and Sn occupy an edge site. CO adsorption energies, Eads = Ecluster-CO
– (Ecluster + ECO), are calculated for adsorption of CO to each
inequivalent surface site. The largest CO adsorption energies (Table 1), are obtained at edge site (1) for both the Pt19+ and all XPt18+ clusters.
The CO binds most strongly with pure Pt19+ (Eads = 2.38
eV), while a much weaker CO binding is found for Nb and Mo doped Pt clusters (Eads≈ 1.8 eV). The values for Ag and Sn
doped clusters (Eads ≈ 2.2 eV) are close to that of pure Pt. The
calculated lower CO binding energy for Nb and Mo doped Pt clusters is in good agreement with the mass spectrometric observations. As shown in the RRKM analysis (see Supporting Information) a reduction in the CO binding energy considerably increases the cluster–CO dissociation rates, which is reflected in lower abundances of cluster–(CO)2 complexes. The DFT result
that Ag and Sn doping only slightly reduces Eads also agrees with
the experimental data, since for these dopants no significant change in cluster reactivity was observed.
Table 1. Calculated CO adsorption energies and Bader charges on X in
XPt18+ clusters.
Cluster Eads / eV Bader charge
Pt19+ -2.38 -
NbPt18+ -1.81 +1.73
MoPt18+ -1.83 +1.40
AgPt18+ -2.26 +0.37
SnPt18+ -2.21 +0.95
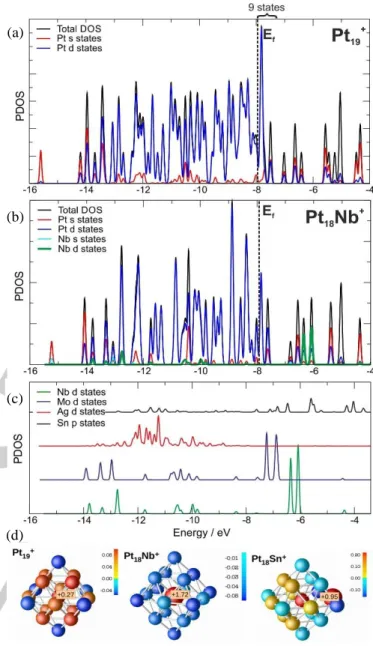
Figure 3 presents an analysis of the clusters’ electronic structures. The upper panel shows the total DOS of Pt19+ and
projections into atomic Pt s and d states. As expected, the electronic structure is dominated by valence d states, which form a band ranging from -14 to -7.5 eV. This d band is nearly full, with only 9 empty states from the Fermi level, EF, to the top of
the band.
Figure 3b shows an analogous DOS analysis for NbPt18+,
including projections on s and d states of Nb. Most of the Nb d states are located above the Fermi level. Nb d electrons are transferred to the Pt d band. Hereby, EF moves up slightly, with
only 7 empty states from EF to the top of the valence band. A
comparison of the valence occupancy of the different dopants in XPt18+ is presented in Figure 3c. For heavier dopants the
electronegativity difference between dopant and Pt gets smaller and the energy of the dopant’s d states decreases. Nb has the largest dopant–host charge transfer, followed by Mo, while most of the Ag d states have energies within the Pt d band. Sn dopants are qualitatively different, as charge transfer takes place from 5p orbitals. The Sn 5p orbitals are located partly inside, and partly outside the Pt d band.
Figure 2. Relaxed structures of Pt19+ and XPt18+ clusters (X= Nb, Mo,
Ag, and Sn). Dopant atoms are colored in red (Nb, Mo) and green (Ag,
Sn). Inequivalent surface sites are numbered.
Figure 3. Total and projected densities of states (DOS) for (a) Pt19+ and
(b) NbPt18+ clusters. (c) Series of projected DOS into the d states of the
impurity atom (p states for Sn) for XPt18+ clusters. (d) Bader charges on
Pt19+, NbPt18+, and SnPt18+. Positively (negatively) charged atoms are
colored with various shades of red (blue). Labels indicate the value of charges which lie off the scale. The dopant atoms have a larger size.
(d)
(c)
(b)
(a)
A Bader charge analysis demonstrates dopant induced charge transfer. Figure 3d illustrates that the charge in pure Pt19+
is distributed over edge-like sites (around +0.09 e at each site) and the central atom (+0.27 e), while there is a very large net positive charge on the central dopant atom in NbPt18+ (+1.73 e)
and all Pt atoms are negatively charged. The Mo dopant in MoPt18+ has also a large, however slightly lower, net positive
charge (see Table 1).In contrast, charge transfer from Ag to the Pt cluster is much smaller. In SnPt18+ there mainly is charge
transfer from the edge located Sn dopant to the neighboring Pt atoms, while other Pt edge sites still have a positive charge. Overall, the Bader charge of the Pt atoms is strongly correlated with CO adsorption energies, with a stronger CO bonding at sites with a more positive charge (see Supporting Information for CO binding energies at different sites). The smaller CO binding energy on NbPt18+ and MoPt18+ can thus be rationalized by the
large charge transfer from the dopants to all Pt atoms of the clusters. In AgPt18+ and SnPt18+ CO preferentially binds on Pt
atoms distant from the dopant that are positively charged.
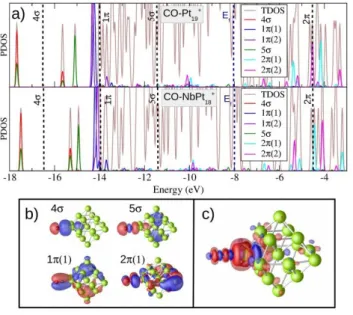
Figure 4 provides an analysis of the cluster–CO bond. There is a strong interaction between the 5 orbital, which is strongly shifted down in energy, and the Pt d states. In addition, hybridization between the 2 MO and the d states results in levels with partially 2 character below the Fermi energy. Also the CO 1 MOs hybridize with Pt states. The shapes of charge redistributions upon bonding confirm a major role of donation from orbitals, which becomes more difficult when the Pt reaction sites are negatively charged.
In summary, a combined mass spectrometric and density functional theory study has shown that a single dopant atom in small cationic Pt clusters alters the interaction strength of the clusters with CO. The magnitude of the effect depends on the
kind of dopant atom, with a significant change in the cluster–CO interaction upon Nb and Mo doping and no or minor influence for Sn and Ag doping. The Nb and Mo dopants occupy highly coordinated positions in the clusters concomitant with a large dopant–Pt charge transfer, thereby affecting the local electronic structure of all Pt atoms including the CO reaction site. This is not the case for Sn and Ag, which take low coordinated positions in the Pt clusters. The higher occupancy of the Pt valence d band in Nb and Mo doped clusters is responsible for the reduced CO adsorption energies, which explains the lower abundances of the cluster–(CO)2 complexes in the experiment.
Several Pt alloy nanoparticles, including PtNb, PtMo, PtSn and PtAg, have been tested in real PEMFCs and show an improved tolerance to CO poisoning. We demonstrated the particular role of intraparticle charge transfer on the CO binding energies in Pt clusters containing a single dopant atom. Since CO binding is a local event, conclusions from this work may be relevant for larger Pt-X alloy nanoparticles that show enhanced CO tolerance and should be considered when developing future
fuel cells with better durability.
Acknowledgements
This work is supported by the Research Foundation-Flanders (FWO) and by the KU Leuven Research Council (GOA/14/007). P. Ferrari acknowledges CONICyT for Becas Chile scholarship. The work in Valladolid was supported by MINECO (Grant MAT2014-54378-R) and Junta de Castilla y Leon (Grant VA050U14).
Keywords: CO tolerance • Pt clusters • doped clusters • mass spectrometry • DFT simulation
[1] X. Zhao, M. Yin, L. Ma, L. Liang, C. Liu, J. Liao, T. Lu and W. Xing,
Energy Environ. Sci.2011, 4, 2736.
[2] J. Baschuk, and X. Li, Int. J. Energy Res.2001, 25, 695.
[3] S. Ehteshamia and S. Chan, Electrochim. Acta 2003, 93, 334.
[4] Y. Feng, L. Bi, Z. Liu, D. Kong and Z. Yu, J. Catal. 2012, 290, 18.
[5] J. Hu, Z. Liu, B. Eichhorn and G. Jackson, Int. J. Hydrogen Energy, 2012,
37, 11268.
[6] J. Kim, S. Choi, S. Nam, M. Seo, S. Choi and W. Kim, Appl. Catal.
B-Environ. 2008, 82, 89.
[7] T. Rocha, F. Ibanhi, F. Colmati, J. Linares, V. Paganin, E. Gonzalez, J.
Appl. Electrochem.2013, 43, 817.
[8] J. K. Nørskov, T. Bligaard, J. Rossmeisl and C. H. Christensen, Nat.
Chem.2009, 1, 37.
[9] G. Blyholder, J. Chem. Phys. 1964, 68, 2772.
[10] N. Dimakis, M. Cowan, G. Hanson and E. S. Smotkin, J. Phys. Chem. C
2009, 113, 18730.
[11] M. Liao, C. Cabrera and Y. Ishikawa, Surf. Sci. 2000, 445, 267.
[12] H. Schwarz, Angew. Chem. Int. Ed. 2015, 54, 10090; Angew. Chem2015,
127, 10228.
[13] S. Zhou, J. Li, M. Schlangen and H. Schwarz, Acc. Chem. Res. 2016, 49,
494.
Figure 4. a) Projected densities of states (PDOS) on the CO molecular orbitals (MO) for CO-Pt19+ and CO-NbPt18+. The brown line shows total
DOS. Dashed vertical lines indicate the position of free CO MO’s. (b) Wave functions of selected CO related states on CO–Pt19+. c) Plot of
induced charge density differences for CO–Pt19+. Red/blue contours
represent regions of charge accumulation/depletion, respectively.
1
[14] S.M. Lang, I. Fleischer, T.M. Bernhardt, R.N. Barnett and U. Landman, J.
Am. Chem. Soc. 2012, 134, 20654.
[15] D. Justes, R. Mitrić, N. Moore, V. Bonačić-Koutecký and A. Castleman Jr.,
J. Am. Chem. Soc. 2003, 125, 6289.
[16] S. M. Lang, T. Bernhardt, R. Barnett and U. Landman, Angew. Chem. Int.
Ed.2010, 49, 980; Angew. Chem2010, 122, 933.
[17] V. Kaydashev, E. Janssens and P. Lievens, Int. J. Mass Spectrom. 2015,
379, 133.
[18] H. Le, S. M. Lang, J. De Haeck, P. Lievens and E. Janssens, Phys. Chem.
Chem. Phys. 2012, 14, 9350.
[19] E. Janssens, H. Le and P. Lievens, Chem. Eur. J. 2015, 21, 1.
[20] J. Mortensen, L. Hansen and K. Jacobsen, Phys. Rev. B 2005, 71,
035109.
[21] J. Enkovaara et al. J. Phys.: Condens. Matter 2010, 22, 253202.
[22] J. Perdew, K. Burke and M. Ernzerhof, Phys. Rev. Lett. 1996, 77, 3865.
[23] M. Marques, M. Oliveira and T. Burnus, Comput. Phys. Commun. 2012,
183, 2272.
[24] L. Xiao and L. Wang. J. Chem. Phys. 2004, 108, 8605.