Application of natural stable isotopes in aquaculture nutrition
by
Julián Gamboa-Delgado
B.Sc., Biology; M.Sc., Marine Aquaculture
A thesis submitted in fulfillment of requirements for the degree of
Philosophiae Doctor at Bangor University
Bangor University
School of Ocean Sciences
College of Natural Sciences
Menai Bridge LL59 5AB
Gwynedd, Wales
United Kingdom
Declaration
This work has not previously been accepted in substance for any degree and is not
concurrently submitted in candidature for any degree.
Signed………. (Candidate)
Date………
Statement 1
This thesis is the result of my own independent work/investigation, except where otherwise
stated. Other resources are acknowledged by footnotes giving explicit references. A
bibliography is annexed.
Signed………. (Candidate)
Date………
Statement 2
I hereby give consent for my thesis, if accepted, to be available for photocopying and for
inter-library loans, and for the title and summary to be available to outside organizations.
Signed………. (Candidate)
Date………
Dedicatory
To my mother M. Guadalupe Delgado
For your love and constant support.
Even in the most difficult times
you have always given us
admirable example of
strength, hope
and faith.
Acknowledgments
I wish to express my most sincere gratitude to Dr. Lewis Le Vay for his supervision,
professional guidance, constant advice and for the encouraging meetings throughout the PhD
project. Thanks are also due to Gwyn Hughes, Berwyn Roberts and Tom Galley for their
valuable technical support with the shrimp rearing and maturation systems and to Roeland
Wouters (INVE Technologies) for kindly supplying the experimental shrimp larval diets. The
present PhD project was financially supported by the Programme Al an: the European Union
Programme of High Level Scholarships for Latin America (scholarship E05D056486MX)
and by the Mexican National Council of Science and Technology (CONACYT, grant
178649). Both funding sources are deeply acknowledged. The Atlantic Arc Aquaculture
Group (AAAG, European Commission, Interreg IIIb) is also acknowledged for supporting
the present study through projects 091 and 201. Menai Bridge and Bangor, UK: Many thanks
to my friends Mark, Mar, Claudio, Julia, Pedro, Camille, Rafa, Maricarmen, Oscar, Andy,
Dan, Gaelle, Phillip, Jitka, Raquel, Luis, Reza, Tina and all those who made me feel at home
since my first weeks in UK. Thanks are also due to my friends Nigel and Yousof with whom
countless hours were shared at the office.
Abstract
The use of stable isotopes as nutritional tools in aquaculture represents a powerful analytical
technique that allows direct assessment of the origin, flow and fate of nutrients. Aquaculture
systems can be considered as simplified ecological systems and the present study aimed to
apply carbon and nitrogen stable isotopes (
13C and
15N) as analytical tools in determining
nutrient incorporation from different experimental diets, ingredients and feeding regimes.
Due to their high growth and commercial value, Pacific white shrimp (
Litopenaeus
vannamei
) and Senegalese sole (
Solea senegalensis
) were used as model organisms. In a
preliminary experiment, a range of dietary ingredients and larval feeds were analyzed for
elemental and isotopic compositions in order to formulate practical diets and also to design
experimental larval feeding protocols. The nutritional contribution of fish meal and soy
protein isolate to the growth of shrimp was estimated using an isotopic mixing model. In all
cases, analysis of muscle tissue indicated a biased nutritional contribution from fish meal, so
that in postlarval shrimp fed on a 46% protein diet containing a 50:50 ratio of the two
ingredients, 69% of nitrogen in muscle tissue originated from fish meal, while juvenile
shrimps fed the same diet, incorporated 73% of nitrogen from fish meal and 27% from soy
protein. Nutritional contributions from soy protein isolate to growth were high, which
highlights the suitability of soy derivatives as alternative protein sources for penaeid shrimp.
isotopic changes occurring over time in an exponential model. A second larval experiment
was conducted on Senegalese sole in order to assess the isotopic influence of different larval
feeding regimes on larval tissue and to assess nutrient turnover rates. Dietary effects on the
digestive physiology of fish were also studied by determining digestive enzyme activity of
trypsin and chymotrypsin and trypsinogen gene expression. Changes in isotopic values and
digestive enzyme activities were clearly influenced by the different feeding regimes and
specific dietary changes.
Contents
Chapter 1: General introduction
Application of natural stable isotopes in aquaculture nutrition 1
1.1. The intensification of marine aquaculture 2
1.1.1. Larval nutrition of fish and crustaceans 2
1.1.2. The use of inert diets in co-feeding regimes 5
1.2. The need to replace fish meal in aquaculture diets 6
1.2.1. Fish meal replacement using alternative protein sources 7
1.3. Nutritional assessment methodologies applied to marine larval organisms 9 1.3.1. Assimilation assessments using stable and radioactive isotopes 13
1.4. The use of stable isotopes in aquaculture nutrition 13
1.4.1. Dietary tracers 13
1.4.2. Nutrient turnover rate 16
1.4.3. Estimation nutrient contribution from different sources into tissue 19
1.4.4. The isotopic discrimination factor 19
1.5. Advantages and disadvantages of the use of stable isotopes 21
1.6. Objectives of the thesis 22
Chapter 2: General methods 23
2.1. Experimental animals 24
2.1.1. Broodstock shrimps 24
2.1.2. Maturation induction 24
2.1.3. Shrimp larval and postlarval culture 25
2.1.4. Senegalese sole broodstock and larval culture 25
2.2. Experimental diets 26
2.2.1. Ingredient analysis 26
2.2.2. Formulation and preparation of artificial diets 27
2.3. Elemental and isotopic analyses 27
2.3.1. Sample pre-treatment 27
2.3.2. Carbon and nitrogen isotopic analysis 28
2.3.3. Estimation of nutrient contribution 28
2.3.4. Carbon and nitrogen turnover rate and half times in tissue 30
Chapter 3: Carbon and nitrogen stable isotopes as indicators of relative contribution of live
and inert diets to growth in larvae of Senegalese sole (Solea senegalensis) 31
Abstract 32
3.1. Introduction 33
3.1.1. Senegalese sole farming 33
3.1.2. Co-feeding regimes in larviculture 33
3.1.3. Assessment of nutrient incorporation using stable isotope values 34
3.2. Material and methods 35
3.2.1. Senegalese sole and rearing system 35
3.2.2. Live food and inert diets 36
3.2.3. Experimental design and sampling 36
3.2.4. Stable isotope analysis and estimation of nutrient contribution 38
3.2.5. Statistical analysis 38
3.3. Results 38
3.3.2. Larval growth and survival 39 3.3.3. Changes in carbon isotope values in larval tissue with treatment and age 40 3.3.4. Changes in nitrogen isotope values in larval tissue with treatment and age 43 3.3.5. Relative contribution of live prey and inert diet to tissue growth 44 3.3.6. Estimation of turnover rates and carbon and nitrogen half lives 45
3.4. Discussion 46
3.4.1. Growth rate and isotopic change in tissue 46
3.4.2. Relative contribution of live prey and inert diet to tissue growth 47 3.4.3. Are the isotopic discrimination factors good indicators of dietary quality? 49 3.4.4. Estimation of turnover rates and carbon and nitrogen half times 49 3.4.5. Stable isotopes as tools in larval and postlarval nutritional studies 50
Chapter 4: Effect of larval feeding regimes on trypsinogen gene expression, proteolytic
enzyme activity and dietary carbon and nitrogen assimilation in Senegalese sole (Solea
senegalensis) larvae 53
Abstract 54
4.1. Introduction 55
4.1.1. Senegalese sole aquaculture and nutrition 55
4.1.2. Digestive physiology parameters and stable isotopes as nutritional tools 55
4.2. Material and methods 56
4.2.1. Senegalese sole and rearing system 56
4.2.2. Experimental feeding regimes 56
4.2.3. Stable isotope analysis and nutrient turnover rates 58
4.2.4. Digestive enzyme analysis 59
4.2.5. Gene expression analysis 60
4.2.6. Statistical analysis 60
4.3. Results 60
4.3.1. Larval growth and survival 60
4.3.2. Influence of diet on fish tissue C:N ratio and stable isotope values 63
4.3.3. Nutrient turnover rate and isotopic discrimination factor 66
4.3.4. Expression of ssetryp1 under different feeding regimes 68
4.3.5. Enzymatic trypsin and chymotrypsin activities 69
4.4. Discussion 69
4.4.1. Dietary effects on larval growth and C:N ratio in fish tissue 69
4.4.2. Effect of diet on isotopic composition of fish tissue 71
4.4.3. Carbon and nitrogen turnover rates 72
4.4.4. Isotopic discrimination factors and dietary quality 73
4.4.5. Effect of feeding regime on trypsinogen gene expression and enzymatic activities 74
4.4.6. Larval feeding regimes and nutritional performance 76
Chapter 5: Artemia replacement in co-feeding regimes for mysis and postlarval stages of
Litopenaeus vannamei: Nutritional contribution of inert diets to tissue growth as indicated by
natural stable isotopes 78
Abstract 79
5.1. Introduction 80
5.1.1. Shrimp larviculture and nutrition 80
5.1.2. Nutritional assessments in crustacean larvae 80
5.2. Material and methods 82
5.2.1. Experimental animals 82
5.2.2. Experimental design and larval rearing system 82
5.2.4. Stable isotope analysis and estimation of nutrient contribution 84
5.2.5. Estimation of carbon turnover rates 85
5.2.6. Statistical analysis 85
5.3. Results 85
5.3.1. Larval growth and carbon turnover rates 85
5.3.2. Dietary influence on 13C values and shrimp-diet ∆13C values 86
5.3.3. Dietary influence on shrimp tissue 15N values 88
5.3.4. Relative contribution of Artemia and inert diet to larval and postlarval growth 90
5.4. Discussion 93
5.4.1. Larval growth and survival 93
5.4.2. Influence of diet on isotope value changes and carbon turnover rate 93
5.4.3. Dietary influence on shrimp tissue 15N values 94
5.4.4. The relative contribution of Artemia and inert diet to larval tissue growth 96
5.4.5. Shrimp – diet isotopic discrimination 97
5.4.6. The use of stable isotopes in larval nutrition 97
Chapter 6: Effect of two formulated diets on the natural stable isotope ratios ( 13C and 15N)
and nutrient turnover rates of Pacific white shrimp (Litopenaeus vannamei) muscle tissue 99
Abstract 100
6.1. Introduction 101
6.1.1. Shrimp aquaculture 101
6.1.2. Stable isotopes as nutritional tools 101
6.2. Material and methods 103
6.2.1. Experimental animals 103
6.2.2. Experimental diets 103
6.2.3. Experimental design and sampling 104
6.2.4. Elemental and stable isotope analysis 105
6.2.5. Estimation of carbon and nitrogen turnover rates 105
6.2.6. Statistical analysis 106
6.3. Results 106
6.3.1. Growth and rearing conditions 106
6.3.2. Stable isotope values in experimental diets 108
6.3.3. Effect of the experimental diets on the isotope values of shrimp tissue 108
6.3.4. Carbon and nitrogen turnover rates 108
6.3.5. Dietary effect on isotopic discrimination factors 110
6.3.6. Isotope values in different shrimp tissues 110
6.4. Discussion 115
6.4.1. Growth and rearing conditions 115
6.4.2. Dietary stable isotope values and their effect on shrimp 115
6.4.3. Carbon and nitrogen turnover rates 116
6.4.4. Effect of diets on the isotopic discrimination factors 116
6.4.5. Carbon and nitrogen isotope values in different tissues 117
6.4.6. Conclusion 118
Chapter 7: Natural stable isotopes as indicators of the relative contribution of soy protein and
fish meal to tissue growth in Pacific white shrimp (Litopenaeus vannamei) fed compound diets 119
Abstract 120
7.1. Introduction 121
7.1.1. Aquaculture and plant proteins as ingredients 121
7.1.2. Stable isotopes as tools to estimate nutrient incorporation 121
7.2. Material and methods 123
7.2.1. Postlarval and juvenile shrimps 123
7.2.2. Experimental diets 124
7.2.3. Experimental design and sampling 125
7.2.4. Carbon and nitrogen stable isotope analysis 126
7.2.5. Nitrogen contributions from fish meal and soy protein isolate 126
7.2.6. Carbon and nitrogen turnover rates in muscle tissue 126
7.2.7. Statistical analysis 126
7.3. Results 127
7.3.1. Shrimp growth and survival 127
7.3.2. Effect of diets on shrimp muscle isotope values 128
7.3.3. Nitrogen and carbon turnover rates and half times in muscle tissue 129 7.3.4. Estimation of nitrogen contributions from fish meal and soy protein 134
7.3.5. Muscle-diet carbon and nitrogen discrimination factors 134
7.4. Discussion 138
7.4.1. Effect of growth and nutrient turnover rate on tissue isotope values 138
7.4.2. Muscle-diet isotope discrimination factors 139
7.4.3. Estimation of nitrogen contribution from fish meal and soy protein 142
7.4.4. Natural stable isotopes in dietary evaluations 144
Chapter 8: Summary and conclusions 146
Chapter 1
General introduction:
1.1. The intensification of marine aquaculture
The farming of marine organisms has been steadily increasing over the last two decades and
in the last 10 years world aquaculture production has almost doubled (FAO, 2008a). It is
evident that if the finfish and crustacean aquaculture sectors are to sustain their current
growth rate of 8.5% per year, then the supply of larvae and juveniles, and the required feed
inputs will also have to grow at similar rates so as to meet demand (Battaglene and Fielder,
1997; Tacon and Metian, 2008). These are critical issues, as the continued growth of marine
aquaculture is required not only to satisfy the increasing demand for seafood but also to
alleviate pressure on wild fish extraction. FAO (2008a) reports the following figures on the
status of the oceans' wild fish stocks in 2007: 20% are moderately exploited and still offering
some scope for further expansion, 52% fully-exploited (extraction is already at or very close
to the maximum sustainable production limit), 19% overexploited, 8% depleted and 1%
recovering from depletion. Marine aquaculture as an industry is still in its infancy years and
whether its further future impacts on the marine environment and resources are on the
positive or negative side remains to be seen. The outcome and magnitude of these impacts
will depend on how carefully expansion of the industry is planned and how the resources
needed for its development are sourced. The constant growth of the aquaculture industry has,
in part, been supported by an increasing knowledge of the nutritional physiology of
commercially important species but, on the other hand, two nutritional constraints that limit
the development of the sector are (1) the lack of appropriate diets and feeding regimes during
the larviculture phase and (2) the successful partial or total replacement of fish meal in
grow-out diets.
1.1.1. Larval nutrition of fish and crustaceans
et al., 1993). Extensive research has been done on the nutrition and pathology of marine fish
larvae (see reviews by Cahu and Zambonino-Infante, 2001; Kolkovski, 2001; Olafsen, 2001
and references therein), while automated larval culture systems have been implemented in
order to increase control of environmental parameters and feeding (Kolkovski et al., 2004).
Nutrition is considered to be one of the most important issues in marine larvae research
(Cahu and Zambonino-Infante, 2001; Koven et al., 2001) and Sorgeloos and Leger (1992)
have described development of effective finfish and crustacean larval diets for the early first
feeding stages as being the major bottleneck for complete replacement of live foods. The
majority of larval rearing techniques for marine crustaceans and fish are still highly
dependant on live food such as rotifers and
Artemia
(Teshima et al., 2000) and this has
complicated the study of their nutrition (Gallardo et al., 2002). Although live feeds represent
clear advantages in the culture of marine larvae, such as high digestibility and availability in
the water column, they are expensive to culture, nutritionally variable and provide a vector
for the introduction of pathogenic micro-organisms into larval culture tanks (Southgate and
Partridge, 1998). On the other hand, weaning fish larvae onto formulated feeds can be
relatively difficult due to their selective feeding behaviour and low acceptance of inert diets
(Teshima et al., 2000). Most marine fish larvae hatch from small, mostly pelagic, eggs and
their digestive tracts are still developing at the onset of exogenous feeding; even if their
digestive capacity is sufficient to support fast larval growth on live prey, there are
physiological constraints with respect to digestion of formulated starter feeds (Rønnestad et
al., 2007).
or aquariums have been used for post-settlement stages, but such systems increase the size
and complexity of the facilities. Culture of spiny lobsters (Palinuridae) from egg to
marketable size is still difficult; laboratory-scale rearing of larvae from egg to puerulus has
been achieved for some species (Kittaka, 2000; Matsuda and Yamakawa, 2000) but although
the rearing of phyllosomata stage to pueruli has been achieved (Phillips and Liddy, 2003) it
has been done in limited numbers still unsuitable for commercial scale (Nelson et al., 2004).
To date, there are no commercial diet formulations developed specifically for
Jasus
,
Panulirus
or
Homarus
lobster larvae; therefore, diets formulated for other organisms which
approximate to the lobsters’ nutritional requirement are used (Fiore and Tlusty, 2005).
1.1.2. The use of inert diets in co-feeding regimes
towards future complete replacement of live food in the larval culture of marine species.
Similarly, the commercial production of shrimp larvae is also becoming less dependent upon
live foods. In fact, some studies have reported the successful total replacement of microalgae
and/or
Artemia
at different larval stages (Kanazawa, 1990; Cuzon and Aquacop, 1998;
D'Abramo et al., 2006). Complete replacement of microalgae and
Artemia
with formulated
diets through all the larval stages has also been demonstrated (Jones et al., 1979; Kurmaly et
al., 1989b; Le Vay et al., 1993) but while survival can be equivalent to that of larvae reared
on live foods, growth and metamorphosis rates are usually slower (Le Vay et al., 1993;
D'Abramo et al., 2006). A few hatcheries are no longer designed with an algae room (e.g. in
New Caledonia); instead they operate with microencapsulated diets (Cuzon and Aquacop,
1998). Nevertheless, most modern shrimp hatcheries also use co-feeding regimes that
combine inert commercial diets and live food (mainly microalgae, rotifers and
Artemia
nauplii). In contrast to most marine fish larvae, crustacean larvae handle and reduce the feed
to fine particles, thus microdiets are also consumed inefficiently and some nutrients are more
prone to leach into the water (Teshima et al., 2000). Larval diets for the filter-feeding zoea
stages are supplied as very fine particles that present high surface area to volume ratios,
which in turn results in extensive leaching of nutrients. The extent to which inert diets
contribute directly to the larval growth has not been determined. In this context, a better
understanding of the ingestion and assimilation of nutrients provided in co-feeding regimes
during specific growth stages would assist in two ways: by improving the current larviculture
of traditional species and also in further diversifying the rearing of alternative species.
1.2. The need to replace fish meal in aquaculture diets
al., 2009). Addition of fish meal to animal diets increases feed efficiency and growth through
better food palatability, enhanced nutrient uptake, digestion and absorption, while the
balanced amino acid composition of fish meal complements and provides synergistic effects
with other animal and vegetable proteins in the diet to promote fast growth and reduce
feeding costs (Miles and Chapman, 2006). Such nutritional advantages have resulted in high
demand for this resource and it has been estimated that by 2006, 68% of the global fish meal
production was utilised for compound aquaculture feeds (Tacon and Metian, 2008). Miles
and Chapman (2006) estimate that approximately 4.5 tons of whole fish are required to
produce 1 ton of dry fish meal and although supply is presently stable (at 6.0 to 6.5 mmt
annually) and most fish meal and oil are produced from sustainable and monitored fish
stocks, recent statistics indicate that the continued growth of the aquaculture industry is likely
to be limited by fish meal and fish oil supply (FAO, 2008b).
1.2.1. Fish meal replacement using alternative protein sources
production technology based upon raw materials which are locally available in large
quantities (cellulose, coal, petroleum) and feasibility of continuous culture with limited space
and water requirements. However, despite this apparent potential, early attempts to substitute
fish meal using SCP in aquaculture diets were not successful. For example, Voss (1988)
replaced fish meal using an SCP product and a mixture of poultry offal-feather meal at
different levels in diets for turbot (
Scopthalmus maximus
). None of the components were able
to substitute for fish meal in the diet, as indicated by growth rate and protein efficiency ratio.
Subsequent studies have shown better results when SPC is used at low replacement levels.
Lunger et al. (2006) conducted a feeding trial to evaluate the use of a yeast-based protein
source as a replacement for fish meal in diets for cobia (
Rachycentron canadum
). A dietary
level of 25% was recommended, as inclusion levels above this value resulted in reduced
weight gain and feed conversion ratio.
1.3. Nutritional assessment methodologies applied to marine larval organisms
Despite extensive research, the quantitative nutritional requirements of larvae of most marine
species have not been well understood yet and this has been often due to difficulties in
quantifying feed intake (Villamar and Langdon, 1993; Teshima et al., 2000). In general,
accurate measurement of feed intake is the first step in understanding animal nutrition
(Teshima et al., 2000) and as filter feeding is one of the most common ways employed by
larval organisms to capture food, assessment of filtration and/or clearance rates is frequently
used as a mean to evaluate the consumption of suspended particles. Table 1 presents some of
the methods used to assess ingestion in aquatic larvae. In the case of crustaceans, the
ingestion process is complex and enabled by an array of appendages and mechanisms for
grinding and separating fine food particles, though most of the chewing action actually
occurs in the stomach (Ceccaldi, 1997), which marks the beginning of mechanical digestion.
Analysis of the content of the digestive tract provides qualitative and quantitative information
as to what a consumer animal has selected and ingested; however, the methodology is either
difficult or impossible to apply to early marine larval stages. Alternative techniques have
focused on applying serological estimations to assess prey-protein residence time and meal
size (Feller, 1991; Hoyt et al., 2000) and measuring the natural fluorescence of pigments
found in micro algal cells and artificial diets (Marin-Magan and Cañavate, 1995; Kelly et al.,
2000; Hinz et al., 2001). Soto-Rodriguez et al. (2003) and Nagano and Decamp (2004)
labelled bacteria and live prey with fluorescent particles in order to assess ingestion rates and
bacterial colonization times in crustacean larvae.
C hapt er 1: G ene ra l int rodu ct
___________________________________________________________________________
T
ab
le
1.
D
es
cr
ipt
ion of
m
et
hods
f
re
que
nt
ly
a
ppl
ie
d t
o a
ss
es
s i
nge
st
ion i
n a
qua
ti
c l
ar
va
e.
M et hod D es cr ipt ion O bs er va ti ons R ef er enc es A ss es sm ent o f f il tr at ion and c le ar anc e r at es T he num be r of f ee d pa rt ic le s re m ov ed f rom w at er by a f il te ri ng or ga ni sm i s c om pa re d t o co nt ro l tr ea tm ent s to e st im at e t he ing es ti on r at e i n a pe ri od of t im e. S im pl e m et hod. R equ ir es h ig h re pl ic at ion to a voi d m is es ti m at ing di vi di ng or r ep roduc ing pr ey or ga ni sm s. K um lu, 1998 B ay lon e t a l., 2 004 D ar cha m be au a nd T hy s,2005 Pina
1.3.1. Assimilation assessments using stable and radioactive isotopes
One of the most reliable ways to determine assimilation efficiencies is by means of isotopic
evaluations (D’Avanzo et al., 1991; Nunes et al., 1997; Verschoor et al., 2005). Most
elements of biological interest have two or more stable isotopes, although one isotope is
usually present in far greater abundance (Ehleringer and Rundel, 1989). Hence, isotopes
occur naturally in organic tissues, but they may also be added to a certain component to label
or “enrich” it. Carbon, nitrogen and sulphur isotopes are the most widely evaluated in
nutritional and ecological studies (Table 2). Isotopes may be stable or unstable (radioactive),
the use of the latter is subject to a number of safety regulations (Schlechtriem et al., 2004)
and the dilution factor is relatively fast; as a result, their use is restricted to short-term
nutritional studies and only terminal measures can be obtained. The use of radioactive
isotopes (
14C,
3H) as nutritional tracers has been successfully applied in early studies on
crustacean nutrition in order to assess lipid incorporation and metabolism (Teshima and
Kanasawa 1971; Teshima et al., 1976, 1986a, 1986b). Radio-labelled compounds have been
also recently applied to trace nutrients in fish larvae (Koven et al., 1998; Rønnestad et al.,
2001; Morais et al., 2005). On the other hand, stable isotopes are hazardous,
non-invasive and several measurements can be made on a population or individual. Stable isotope
ratios are determined using an isotope ratio mass spectrometer, which measures the ratio of
heavy and light isotopes in a combusted sample, comparing this to a standard (Lajtha and
Michener, 1994). The availability of purified radio-isotopes or stable isotope-labelled
compounds, in combination with sensitive laboratory equipment allows tracing the fate of
these isotopes within organisms, thus, it is possible to measure ingestion, assimilation and
respiration rates by direct rather than indirect methods (Verschoor et al., 2005).
1.4. The use of stable isotopes in aquaculture nutrition
1.4.1. Dietary tracers
1.4.2. Nutrient turnover rate
By tracking carbon and nitrogen isotope changes in tissue over time, it can be possible to estimate the turnover rate of nutrients. Turnover rates are important for determining how
quickly the isotopic profile of a diet is incorporated into animal tissues (Pearson et al., 2003). Tissues of fast growing animals exhibit shorter half-times of carbon and nitrogen in tissue than slow growing animals (MacAvoy et al., 2005). The resolution in estimating turnover rates improves as isotopic differences between initial animal tissue and diet increase (Fry and Arnold, 1982). Nitrogen stable isotopes can be used to estimate the
turnover rate of this element, and given that proteins contain approximately 16% nitrogen, the nitrogen turnover rate can be used as a reliable indicator of protein turnover, especially in muscle tissue. Protein nutrition is the most studied area within the whole of aquatic nutrition (Guillaume et al., 2001); therefore the metabolism of proteins has been widely studied as a mean to understand and improve the growth process in animals
(Carter et al. 1994, 1998; Beltran et al., 2008). Protein is a macronutrient that may limit growth and is also the most expensive ingredient in artificial diets, but an unnecessary excess in protein level not only increases the price of the practical diets, but also impacts the culture media and effluents when the nitrogenous wastes increase. Most larval diets are formulated with a high protein level to provide amino acids required for early stages
when the growth rate is very high, hence a high number of studies have focused on protein metabolism (Owen et al., 1999; Tonheim et al., 2004; Morais et al., 2005)
Protein turnover is a dynamic process in which constant breakdown (catabolism) and synthesis (anabolism) of proteins occurs within a whole organism, organ, tissue or cell (Waterlow et al., 1978). The amino acids resulting from tissue breakdown, along with the
amino acids from dietary protein, enter a common pool of free amino acids from where new protein is synthesized. The protein turnover can be thus divided into its constituent processes: protein synthesis, protein growth and protein breakdown (Houlihan, 1991). In aquatic animals, the rate of protein turnover has been determined in a number of fish and crustaceans (see reviews by Houlihan et al., 1995; Waterlow, 2006; Fraser and Rogers,
(Houlihan, 1991), this will result in lower food conversion efficiencies as less energy is directed for protein accretion (muscle growth). Protein turnover rates have been frequently estimated by the flooding dose method (Garlick et al., 1980; Houlihan et al.,
1988) using radioactive isotopes (14C-labelled lysine or 3H-labelled phenylalanine) that are incorporated through injection or constant infusion as metabolic tracers into the free amino acid pool (Waterlow, 2006). Sveier et al. (2000) evaluated growth and protein turnover in Atlantic salmon (Salmo salar) fed diets having different protein levels and
particle sizes. Conceição et al. (1997b) evaluated the protein turnover and the amino acid
metabolism in larval turbot (Scophthalmus maximus) fed with natural zooplankton or
Artemia. They found an association with high growth rates and low protein turnover rates and concluded that a feeding regime based on Artemia is deficient in methionine. In
another study, Conceição et al. (1997a) estimated the protein turnover rate and energy
cost of growth in African catfish (Clarias gariepinus) larvae. The protein synthesis
retention efficiency was 70% and high rates of protein and RNA synthesis were associated with a low cost of protein synthesis.
Table 3. Fractional rate of protein synthesis (Ks, %d-1), protein growth (Kg, %d-1) and
protein degradation (Kd, %d-1) estimated for some crustaceans and fish using radioactive
and stable isotopes.
Species Weight (g) Method Ks Kg Kd References
Carcinus maenas
1-100 Flooding dose [3H]-phe
1.15 - - El Haj and
Houlihan, 1987
Homarus gammarus
0.05-0.1 Flooding dose
[3H]-phe 7-12 0.5-3.0 10-12 Mente et al., 2001
Litopenaeus vannamei
1-2 Flooding dose [3H]-phe
9.5-9.7 7.2-9.2 0.5-1.8 Mente et al., 2002
Penaeus esculentus
5 Flooding dose
[3H]-phe 0.9-1.4 - - Hewitt, 1992
Pleuronectes flesus
17-60 [15N] labelled
protein in diet
2.9 0.5 2.4 Carter et al., 1998
Oncorhynchus mykiss
106-116 [15N] labelled
protein in diet
1.7 - - Carter et al., 1994
Hippoglossus hippoglossus
36-282 [15N] labelled
protein in diet
2.0 1.3 Urea excretion
0.85 ug N g h
Fraser et al., 1998
Salmo salar 37 Flooding dose
De la Higuera et al. (1998) also measured protein turnover, conversion efficiency and growth in carp (Cyprinus carpio) fed diets formulated with corn-gluten protein and
supplemented with lysine. Supplementation with coated lysine significantly increased the
protein synthesis rate. The metabolism of proteins has also been evaluated using stable isotopes as an alternative to the use of radioactive isotopes. Protein synthesis studies on trout (Oncorhynchus mykiss) have shown that results obtained measuring stable isotopes
in enriched feed are similar to those obtained using radio-labelled amino acids (Houlihan et al., 1995). Carter et al. (1994, 1998) used stable isotopes in trout (O. mykiss) and
flounder (Pleuronectes flesus) in order to assess protein synthesis, protein turnover rates and to construct nitrogen budgets. Fraser et al. (1998) also applied this technique to measure growth and protein synthesis in halibut (Hippoglossus hippoglossus). These
studies were all based on the end-point stochastic model presented by Waterlow et al. (1978). It is possible to use stable isotopes to measure protein synthesis over long periods
of time, and given the non-destructive nature of the method, several measurements can be made on the same individual (Carter et al., 1998). In crustaceans there are only limited reports of use of stable isotopes to assess nitrogen and protein turnover and the majority of studies have instead made use of radio-isotopes. For example, El-Haj and Houlihan (1987) applied the flooding dose method using 3H-phenylalanine to determine protein
synthesis rates in crab (Carcinus maenas). Mente et al. (2001, 2002) applied the same method to assess protein turnover and amino acid metabolism in lobster (Homarus gammarus) and in shrimp (Litopenaeus vannamei). They reported protein conversion efficiencies (growth/intake) of 55% in shrimp and 33% in lobster. Using similar techniques (3H-phenylalanine), Hewitt (1992) esimated a muscle protein retention efficiency of up to 93% in growing shrimp (Penaeus esculentus) fed 40% protein diets.
The small size of crustacean larvae still poses difficulties for the application of some radio-labelling techniques that have been used successfully in marine fish larvae (e.g. Rønnestad et al., 2001).
1.4.3. Estimation of nutrient contribution from different sources into tissue
that isotope values in tissues of consumer organisms reflect those of their diet, and that tissue isotope signatures may change over time due to dietary variations (Fry, 2006). Isotopic mixing models generate better results and resolution when the different feeding
sources have contrasting isotopic values, allowing estimation of carbon and nitrogen contributions from different dietary ingredients into a target organism (Schlechtriem et al., 2004; Beltran et al., 2008), thus providing an integrated nutritional history of organic matter assimilation (Yokoyama et al., 2002). A “consumer organism–diet” relationship in terms of carbon and nitrogen stable isotope compositions can therefore be used to identify
dietary components contributing to growth, both in pond culture (Schroeder, 1983; Nunes et al., 1997) and in larval rearing systems (Schlechtriem et al., 2004; Jomori et al., 2008). This is of particular interest in the study of larval nutrition due to the limited size of marine larvae and the difficulties associated with the assessment of ingestion and assimilation at such early and fast-changing life stages. The estimation of nutrient
incorporation using stable isotopes also has several practical applications in the biological assessment of new diets developed to reduce or substitute fish meal as the main protein source in aquaculture feeds.
1.4.4. The isotopic discrimination factor
The carbon and nitrogen isotopic signatures of animals reflect the isotopic signatures of their diets with a small difference previously called the trophic shift (DeNiro and Epstein 1978, 1981). A number of authors have recently replaced the terms “trophic shift” or “fractionation factor” by the term “isotopic discrimination factor” to describe the isotopic difference between the consumer (body or specific tissue) and its diet (Cerling and Harris, 1999; Pearson et al., 2003; Cherel et al., 2005). The latter term is used throughout the
present study. Isotopic discrimination occurs because organisms have an affinity to incorporate heavy isotopes rather than the lighter and more common isotopes. This is the result of heavy isotopes concentrating in molecules where the bond strengths are greatest, the effect being amplified in every chemical and enzymatic transformation (Peterson and Fry, 1987). Processes that may cause this enrichment are: (1) preferential loss of 12CO2
the order of +1 part per thousand (‰) for 13C in aquatic ecosystems, and in overall, there appears to be a slight enrichment (+0.5 to +1.0‰) in animal tissue relative to diet (Michener and Schell, 1994; Fry and Sherr, 1984). However, there is gathering evidence
indicating that (1) isotopic discrimination factors are species- and tissue-specific (DeNiro and Epstein, 1981; Tiezen et al., 1983; Yokoyama et al., 2005; Stenrothet al., 2006) and (2) considerable variance in the reported values demonstrate that careful validation of assumptions about discrimination factors are critical for interpreting stable isotope data (Crawley et al., 2007). In regards to nitrogen, different field studies indicate average
enrichment of 3.2‰ in animal 15N values when compared to diet (Peterson and Fry, 1987). Minagawa and Wada (1984) showed evidence of a preferential excretion of 15 N-depleted nitrogen, usually in the form of urea and ammonia. In another study, Macko et al. (1986) suggested that the discrimination factor may be due to isotopic fractionation during amino acid transamination. They assessed the transfer of amino nitrogen from
glutamic acid to form aspartic acid and observed that 14NH2 reacted 1.0083 times faster
than 15NH2. Both reports may explain the tissue enrichment frequently observed with
increasing trophic levels. In feeding experiments, the discrimination factor can be normally determined by waiting until a constant difference between diet and animal is achieved. In fish larvae, this is difficult to accomplish due to their fast growth and
development and the fact that certain food types are suitable only for a short time, which may not be sufficient for the consumer to reach a constant difference from the diet (Schlechtriem et al., 2004). In crustacean larvae, the difficulty increases due to the rapid metamorphic and trophic changes observed.
1.5. Advantages and disadvantages of the use of stable isotopes
The use and application of natural stable isotopes allows direct determination of nutrient ingestion and tissue incorporation, the collection techniques are straightforward, the sample analysis are short and the accuracy is high (Michener and Schell, 1994; Dittel et al., 1997; Verschoor et al., 2005). The application of isotopic mixing models has been successfully used in a number of field and laboratory studies to assess nutrient
have allowed reduction of preparation times and cost per sample (Fry et al., 1992). Another disadvantage constantly encountered is the possibility of having overlapping isotopic values in the dietary items (Preston et al., 1996). One approach to deal with this
latter issue is to label the natural or artificial diets with 15N- or/and 13C-enriched compounds to allow its differentiation and eventually trace it into the consumer (i.e. Burford et al., 2004b). There is a minimum sample size (± 1 mg) for analyzing bulk
carbon and nitrogen isotopes and even though this is small, it is still large when it comes to analyzing larval organisms or micro algal cell samples on a dry weight basis, therefore
1.6. Objectives of the thesis
The general aim of the present thesis project was to assess the carbon and nitrogen stable isotope ratios at natural abundance levels in a range of live prey, inert diets, individual
dietary ingredients and tissues of their respective consumers, and to develop their use as analytical tools to trace nutrients in aquaculture studies. Specific aims of the project were:
To evaluate changes in carbon and nitrogen isotope values of Senegalese sole (Solea senegalensis) larvae and postlarvae co-fed Artemia and inert diets at
different levels of substitution in order to estimate nutritional contributions from both sources using an isotope mixing model.
To assess the effects of different feeding regimes on the digestive physiology of early Senegalese sole (Solea senegalensis) larvae by determining trypsin and
chymotrypsin activity and trypsinogen gene expression, while simultaneously evaluating incorporation of nutrients using stable isotopes to assist in the interpretation of results.
To estimate the nutritional contributions from Artemia and inert diets to the
growth of mysis and postlarvae of Pacific white shrimp (Litopenaeus vannamei) fed co-feeding regimes having different levels of Artemia substitution.
To investigate the effect of formulated diets containing fish meal and soy protein isolate on the carbon and nitrogen isotopic composition of Pacific white shrimp (Litopenaeus vannamei) tissue, and to quantify the rate of change of tissue
isotopic composition following dietary shifts.
To evaluate the nutritional contribution from fish meal and soy protein isolate to muscle tissue growth of Pacific white shrimp (Litopenaeus vannamei) postlarvae
Chapter 2
2.1. Experimental animals
2.1.1. Broodstock shrimp
Two batches of thirty individuals of Pacific white shrimp (Litopenaeus vannamei) broodstock were acquired from two commercial shrimp farms in the Dominican Republic
and Florida, USA. Animals were kept were kept at a sex ratio of 1.5 female to 1 male in a 10,000 litre capacity fibre glass tank (4 m diameter, 1 m depth) connected to a recirculation system in the Tropical Laboratory of the School of Ocean Sciences, Bangor University. Seawater was pumped from the Menai Strait and particulate solids were
allowed to settle for 5 days before pumping the water through 50 and 5 m mechanical filters and an ultraviolet filter. After this stage, seawater entered a recirculation system where it was pumped through a sand filter and through a pre-conditioned, Nexus vortex biofilter, and finally through a protein skimmer before returning to the broodstock tank. Seawater in the tank was heated up with two, 1-kw aquarium heaters and kept under the following mean conditions: temperature 27 ±1.2 °C, salinity 32 ±2.3 g l-1 and pH 8.1
±0.5. An artificial light:dark photoperiod was set at 10:14 hours, respectively. Seawater in the broodstock tank had a daily exchange rate of 200% and total ammonia nitrogen was periodically monitored using a Palintest standard photometer (Palintest, Ltd, England).
2.1.2. Maturation induction
After animals were conditioned to the maturation room and broodstock diets, females were unilaterally eye-stalk ablated and were labelled using colour-coded bird identification rings in order to monitor their moulting frequency and reproductive performance. Shrimps were fed in excess form 2 to 3 times per day on varying proportions of fresh mussels, live polychaete worms, cockles, scallops and squid. Once the broodstock females were in optimal reproductive condition, as indicated by full ovary
maturation and frequent mating behaviour, mated females were caught and placed into individual spawning tanks (60 l) containing UV-filtered seawater previously aerated and warmed up by individual heaters. Mated females were allowed to spawn overnight and were returned to the main tank. After stopping the tank aeration, eggs were allowed to settle down and collected by siphoning the bottom of the spawning tanks into a
2.1.3. Shrimp larval and postlarval culture
Selected egg batches were either allowed to hatch in the individual spawning tanks after replacing most of the seawater with clean filtered water, or they were transferred to larval
rearing tanks in another facility (Nuffield Fish Laboratories). Recently-hatched shrimp nauplii were photo-tactically selected using a hand torch placed over the water surface to attract the fastest swimming larvae and discarding the rest. Table 1 shows the standard larval feeding protocol used to rear larvae to the postlarval stage. Shrimp larvae were co-fed Artemia and three dry larval diets supplied at different particle sizes [Frippak 1CAR
(5-30 µm), 2CD (30-90 µm) and 3CD (80-150 µm), INVE Technologies, Dendermonde, Belgium]. Early postlarvae were gradually weaned from the larval diets to an inert diet (Bernaqua MeM) supplied as the only feed thereafter, until they reached the age required for the respective experiments.
2.1.4. Senegalese sole broodstock and larval culture
A batch of 40 wild-caught Senegalese sole (Solea senegalensis) adults was kept under
ambient light and temperature conditions at CIFPA-“El Toruño” aquaculture centre, Cadiz, Spain. Broodstock animals were kept at a female to male ratio of 1:1 and fed on
fish, cuttlefish and different bivalves. Spawned eggs were flow-collected overnight from the surface of a rearing tank (12,000 l) and into small individual off-tank containers. Eggs were then incubated in 300-l conical-bottom tanks with 50% water exchange h-1 using seawater pumped from the Bay of Cadiz. Seawater was mechanically filtered through sand and cartridge filters (10 and 3 m). Temperature, dissolved oxygen and salinity in
Table 1. Standard shrimp larval rearing schedule used to produce postlarvae and juveniles
of Pacific white shrimp (Litopenaeus vannamei).
Larval Substage
Chaetoceros gracilis (cells µl-1)
Tetraselmis or
Rhinomonas sp.
(cells µl-1)
Artemia nauplii
(ind ml-1)
Inert diet (mg l-1)*
Nauplii 5 60 15 0 0
Zoea 1 100-120 30 0 1
Zoea 2 120 35 0 1.5
Zoea 3 120 35 0.5 2.5
Mysis 1 100 30 0.2-1.5 4
Mysis 2 75 20 1.5-5.0 6
Mysis 3 50-75 20 3-8 7
Postlarvae 1-5 20-50 5-20 6-20 7
incubation tanks were maintained at 21.5 °C, 7.4 mg l-1 and 33 g l-1, respectively. Two days after hatching (DAH), larvae were transferred into 300 l capacity rearing tanks and stocked at initial densities of 50 individuals l-1. Mean rearing conditions for the early
larval culture were: salinity 33.7 ±1.2 g l-1, dissolved oxygen 6.8 ±0.9 mg l-1, total NH3-N
0.15 ±0.07 mg l-1 and temperature 21.1 ±1.3 °C. A light:dark photoperiod was set as 16:8 h with mean light intensity of 800 lux. Salinity and temperature were determined with a WTW 340i multi-line probe; dissolved oxygen concentration and light intensity were monitored using a YSI-55 dissolved oxygen meter and a Lutron LX-102 light meter,
respectively. The ammonium concentration in water was measured using the phenol-nitroprussiate method (Strickland and Parsons, 1972). Different experimental larval feeding regimes were applied from 2 to 3 DAH onwards.
2.2. Experimental Diets
2.2.1. Ingredient analysis
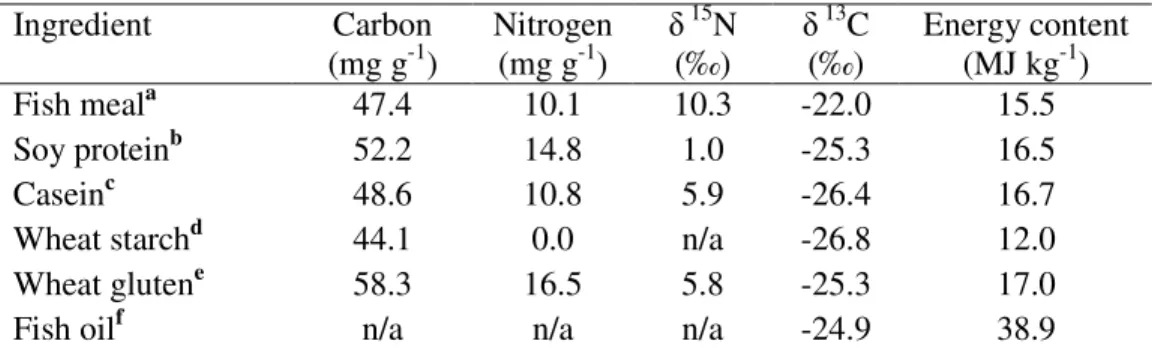
In order to formulate a series of practical experimental diets for shrimp, the energy content, protein content and carbon and nitrogen isotopic values were determined in a range of selected ingredients such as white fish meal, soy protein isolate, wheat starch and fish oils (Table 2). The experimental diets and main ingredients were ground and dried
and their energy content and carbon and nitrogen contents were determined using a bomb calorimeter (Parr 6725 PIC, Illinois, USA) and an elemental analyzer (Carlo Erba NA1500) respectively. The elemental, caloric and isotopic information of the ingredients was used to formulate the diets in an Excel spreadsheet. Main ingredients were weighed using a Metler balance (0.01g) and the weights of vitamins and ingredients present at minor inclusion levels were determined using an Ohaus balance (0.1 mg).
2.2.2. Formulation and preparation of artificial diets
Bulk ingredients were then mixed in a Kenwood mixer-extruder; ingredients added in smaller amounts were mixed separately in small glass flasks to ensure a homogeneous distribution before adding them into the main mixture. Lipids such as lecithin and
The mix was extruded through the dice twice to further compact and mix the ingredients. Strands formed were collected on trays and oven-dried for 24 hours at 45 °C. Diets were
then mildly crumbled to obtain small pellets that were stored at -20 °C until they were fed to the experimental animals.
2.3. Elemental and isotopic analyses
2.3.1. Sample pre-treatment
Diet ingredients, live food, inert diets, and whole pooled animals or tissue samples were sieved or directly rinsed with distilled water and frozen at -80 °C until pre-analysis treatment. When required, samples were lipid extracted in a 1:1 mixture of methanol:chloroform according to the method proposed by Beaudoin et al. (2001) but considerably increasing the sample immersion time in the solvent mixture to up to 18 hours and periodically stirring the mixture. Samples were dried at 60°C for 24 to 48 hours
and homogenized using a mortar and pestle or pooled and fragmented when animal samples were too small to grind without losing material. Samples were kept in a desiccator until weighed. Samples ranging from 900 to 1100 g were packed into tin cups (D1008, Elemental Microanalysis Ltd, UK), which were in turn organized in 96-well microplates to be analyzed for carbon and nitrogen content and their stable isotope ratios
at natural abundance levels.
Table 2. Carbon and nitrogen contents and their respective stable isotope values of
individual ingredients used to formulate experimental diets for shrimp.
Ingredient Carbon
(mg g-1)
Nitrogen (mg g-1)
15N
(‰)
13C
(‰)
Energy content (MJ kg-1)
Fish meala 47.4 10.1 10.3 -22.0 15.5
Soy proteinb
52.2 14.8 1.0 -25.3 16.5
Caseinc 48.6 10.8 5.9 -26.4 16.7
Wheat starchd
44.1 0.0 n/a -26.8 12.0
Wheat glutene 58.3 16.5 5.8 -25.3 17.0
Fish oilf n/a n/a n/a -24.9 38.9
a Provimi 66, Provimi white fish meals, LTD, UK; b Supro, Protein Technologies International, MO,
2.3.2. Carbon and nitrogen isotopic analyses
Samples were analyzed at the Department of Plant Sciences, University of California, Davis CA using a PDZ Europa Scientific Roboprep elemental analyzer coupled to a PDZ
Europa Hydra 20/20 stable isotope ratio mass spectrometer (Crewe, UK). Preliminary samples and dietary ingredients were analyzed at the Isotope Laboratory of the School of Ocean Sciences, Bangor University, UK, using a VG SIRA II dual inlet isotope ratio mass spectrometer ( 15N) and a Europa-PDZ GEO 20/20 isotope ratio mass spectrometer ( 13C). A range of cross-calibration samples were analyzed at both laboratories to ensure
consistency. Stable isotope ratios in the samples are expressed in delta notation ( ), which is defined as parts per thousand (‰) deviations from the isotopic ratios found in Pee Dee belemnite and atmospheric nitrogen, the two standard reference materials from which 13C and 15N values are respectively reported (Fry, 2006). These values were defined by equation 1. Every 12 measurements, two validation samples were run and the isotopic
standard deviation from these reference samples was less than 0.1‰.
HX = (R
sample/Rstandard – 1) 1000 (1)
where X is either nitrogen or carbon, superscript H indicates the heavy isotope mass for
that element and R = 15N/14N or 13C/12C.
In the present study, the term “discrimination factor” (∆HX) is used following Cherel et al. (2005) and Pearson et al. (2003) to describe changes in isotopic values between a consumer organism (whole body or specific tissue) and its diet after having reached isotopic equilibrium, leaving the term fractionation to refer to isotopic changes at the
molecular level.
2.3.3. Estimation of nutrient contribution
Proportional contributions of dietary carbon and nitrogen to animal growth were estimated using a two-source, one-isotope mixing model (Phillips and Gregg, 2001). The
over time. Additional assumptions associated to the application of isotopic mixing models and the validation of results (Gannes et al., 1998; Martínez del Rio and Wolf, 2005; Post, et al., 2007; Martinez del Rio et al., 2009) were also met or taken into consideration in
interpreting the results. These include similar (or known, in order to correct for) elemental composition of the food sources, quantified or known discrimination factors, avoidance of tissue isotopic routing by using whole animals for tissue analysis and known or estimated dietary assimilation efficiencies. In the present study, isotopic reference values used as positive and negative controls to correct for carbon and nitrogen discrimination factors in
the mixing model were taken from final isotope values between diets and tissues of animals fed exclusively on either live food or inert diet (co-feeding experiments) or fed non mixed-ingredient diets (experiments assessing contribution of individual ingredients in practical diets). Isotope values of consumer organisms fed on other diets were then introduced into the model to estimate relative nutrient incorporation and their truncated
95% confidence intervals.
Carbon and nitrogen contents in different feeding items may vary significantly; therefore, in order to correct for the total amount of carbon or nitrogen contributed by each of the two feeding sources, the following equation (Fry, 2006) was used:
ftotal1 = f1W2/(f1W2 + f2W1) and ftotal2 = 1-ftotal1 (2)
where ftotal1= is the total percent contribution of source 1 in a two-source mixing model,
f1= ( HX sample- HX source2)/( HX source1- HX source2) and f2 = 1-f1
where X is either nitrogen or carbon, superscript H indicates the heavy isotope mass for that element. W1 and W2 represent the percent elemental content in each of the two
sources.
2.3.4. Carbon and nitrogen turnover rate and half times in tissue
following a diet transition. These values were fitted to an exponential model (equation 3, Hesslein et al., 1993) that integrates growth and isotope value shift over time.
Csample= Cn + (Co – Cn)e -(k+m)t (3)
Where Csample is the consumer’s isotope value (whole body or specific tissue) at time t, Co
is the isotope value of tissue in equilibrium with the initial diet, Cn is the isotope value
reached when the animal or tissue is in equilibrium with a new diet. m is the metabolic
turnover rate (d-1) and was derived from Equation 3 and calculated using iterative non-linear least squares regression. An estimate of the growth (constant k) is required for the model, and it was derived from the exponential growth equation:
Wf = W0 e(k t)
k = In(Wf/W0)/t (4)
Where k is the specific growth rate constant (d-1), Wf is the final weight, Wo is the initial
dry weight and t represents time (d). SPSS 12.0 software (SPSS Inc.) was used to fit
observed isotope values to the exponential model in order to integrate growth and isotope
value shift over time. Isotope values were fitted to the models using iterative non-linear regression. The only parameter not defined in the equation was m. After running the model, the difference between the calculated and estimated isotope values was used to fit the m parameter. The best estimate gave the least absolute sum of the differences. Tests
were run at a significance level of P<0.05. In Equation 3, coefficients k and m indicate the
magnitude of the isotopic rate of change in relation to growth and metabolic turnover,
respectively, and can also give an estimation of the time necessary for half of the body tissue to reach isotopic equilibrium after consuming the new diet (half time for elemental replacement in tissue, t50):
t50= In 2/(m+k) (5)
Chapter 3
Carbon and nitrogen stable isotopes as indicators of the relative
contribution of live and inert diets to growth in
larval Senegalese sole (
Solea senegalensis
)
Abstract
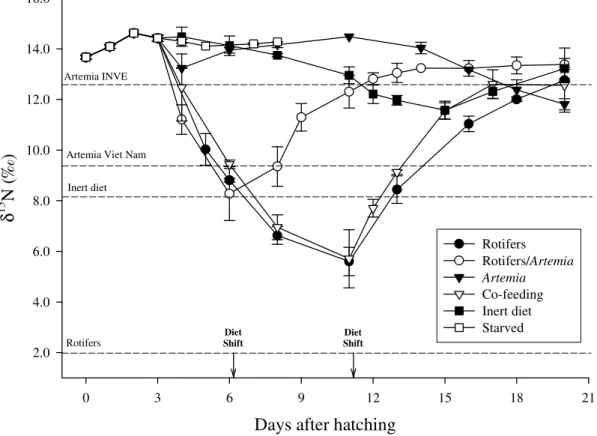
The relative contributions of live Artemia metanauplii and an inert diet for growth of Senegalese sole larvae and postlarvae were assessed through the analysis of carbon and nitrogen stable isotopes ratios ( 13C and 15N) in both diets and whole fish. Isotopic
values were also determined in different diets and nutritional enrichement items frequently used in larval culture. 13C values were wider among these feeding items than among 15N values, therefore, the former were used to estimate nutrient turnover rates and nutritional contributions. Larvae were reared on four dietary regimes: 100% live prey
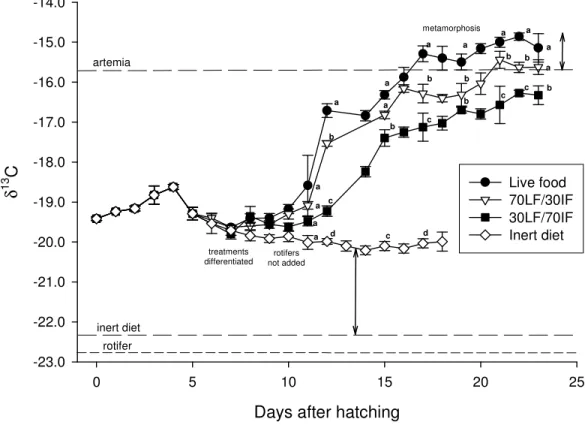
(rotifers and Artemia), 100% inert formulated diet and two co-feeding regimes of 70:30 and 30:70 ratios of Artemia and inert diet, respectively. Larvae from the live food regime and both co-feeding regimes showed a steep increase in 13C from 10 days after hatching (DAH) as a result of the onset and continuation of Artemia consumption. From 12 DAH
fish larvae from all the regimes showed significant isotopic differences as their 13C increased to final asymptotic values of −15.1, −15.6 and −16.3‰ in the live food, 70:30
and 30:70 regimes, respectively. Carbon turnover rates in larvae from live food and co-feeding regimes were relatively high (0.071 to 0.116 d−1) but more than 90% of the observed change in fish tissue isotopic values was accounted for by the retention of carbon in new tissue growth. A two-source, one-isotope mixing model was applied to estimate the nutritional contribution of Artemia and inert diet to postlarvae growth in the
co-feeding regimes. At 23 DAH, the relative contributions of live and inert diets to tissue growth in larvae were respectively, 88 and 12% for the 70:30 co-feeding regime and 73 and 27% for the 30:70 co-feeding regime. At 17 DAH, the estimated proportion of tissue carbon derived from the inert diet was higher at 23 and 38% for the 70:30 and 30:70 regimes, respectively. Even though changes in 15N values of fish were also directly influenced by their diets, the isotopic similarity of values between Artemia and inert diet
prevented the use of the mixing model to estimate proportional assimilation of nutrients. However, results from the analysis of carbon stable isotopes suggest that co-feeding regimes in Solea senegalensis larvae may be adjusted to meet ontogenetic changes in the
capacity for larvae to utilise inert diets. The contrasting levels of carbon isotope discrimination between diet and tissue in larvae reared on either 100% live diet or 100%
3.1. Introduction
3.1.1. Senegalese sole farming
The Senegalese sole (Solea senegalensis Kaup, 1858) is one of several potential candidates that might contribute to the diversification of farmed species of marine fish
due to its characteristics of high growth rate, tolerance to a range of salinities and high commercial value (Ribas et al., 2007; Salas-Leiton et al., 2008). Although various biological aspects of the larval, postlarval and juvenile stages of this species have been studied over the last 15 years, further information is still needed in regards to the nutrition
and physiology during early life history. The larval development of S. senegalensis is characterized by a fast growth followed by an early metamorphosis (20-22 DAH) and transition from the planktonic to benthic stages (Cañavate and Fernández-Díaz, 1999). In common with the majority of larval rearing techniques for marine fish, larval production of sole larvae is still highly dependant on live feeds, while weaning post-settlement juveniles to formulated diets can be relatively difficult due to their selective feeding
behaviour and slow acceptance of inert diets (Teshima et al., 2000).
3.1.2. Co-feeding regimes in larviculture
In the larval culture of many marine fish species, varying proportions of inert diets may be used in co-feeding regimes to partially replace live foods (Appelbaum, 1989;
Kolkovski and Tandler, 2000), which are expensive and frequently variable in nutritional quality. This feeding strategy is designed to overcome the undeveloped digestive system of early larval stages and to take advantage of the increased digestion and assimilation of inert diets in the presence of live food prey within the gut (Rønnestad et al., 2001). Co-feeding strategies have potential economic benefits through improvement to the nutritional condition of the larvae as well as pre-conditioning them to better accept
manufactured weaning diets at an earlier stage (Cahu and Zambonino-Infante, 1995; Rosenlund et al., 1997). Fletcher et al. (2007) and Langdon et al. (2007) have both pointed out that the degree to which live foods can be replaced with inert diets has been steadily increasingly as a result of the development of new microdiets and delivery methods. A number of studies have reported on the performance of different inert diets
However, the extent to which inert diets contribute directly to sole larval growth has not been determined.
3.1.3. Assessment of nutrient incorporation using stable isotope values
The majority of techniques employed to determine assimilation of nutrients are indirect methods that are difficult to apply in marine animals at the very early life stages, and often require some manipulation of dietary ingredients, for example incorporation of labelled component using radio- or stable isotopes (Tonheim, et al., 2004; Verschoor et
al., 2005) The use of natural stable isotopes provides a safe alternative to the use of radio-isotopes and represents a straightforward technique to directly trace the flow and incorporation of carbon and nitrogen from unadulterated inert diets and live prey into the target organism (Schlechtriem et al., 2004), providing an integrated nutritional history of
organic matter assimilation and retention (Yokoyama et al., 2002). The use of this
approach relies on the assumptions that isotope values of consumer tissues reflect those of their diet (plus or minus a correction factor for isotopic discrimination) and that tissue isotope signature may change over time due to dietary variations. The application of mixing models makes it possible to estimate the proportion of nutrients derived from different food sources after these have been incorporated into the consumer. The study of
13
C at natural abundance levels has been of great assistance in quantifying the relative roles of natural and formulated diets in the nutrition of pond-reared organisms and in evaluating and maximising diet assimilation, consequently minimising waste products from the individual ingredients used in compound aquaculture diets (Shroeder, 1983; Nunes et al., 1997). Carbon accounts for approximately 50% of the dry weight of most life forms (Matsumura-Tundisi et al., 1989); hence a consumer-diet relation can be
established in regards to this element and used to identify dietary components contributing to growth. Comparisons of different 13C values in available natural foods and supplied diets have been useful in gaining insight into the flow of organic matter in several aquatic environments and into the consumer organisms (Schroeder, 1983; Fry, 1991) which in turn closely resemble their diet 13C values (DeNiro and Epstein, 1978).
15