Accession of Romania in the European Union FDI determinants analysis
35
0
0
Texto completo
(2) 1.. Index Introduction ........................................................................................................ 2. 2.. Presentation of the studied phenomenon ........................................................... 2 2.1 Historical perspective ....................................................................................... 2 2.2 Process of integration in the European Union .................................................. 4 2.3 Access of Romania in the EU .......................................................................... 4 2.4 Quantitative description ................................................................................... 5 2.5 Foreign Direct Investment ................................................................................ 9. 3.. Revision of the FDI’s literature in Romania ....................................................... 13. 4.. Analytical framework ........................................................................................ 19 4.1. Data and statistical analysis ...................................................................... 21. 4.2. Econometric model ................................................................................... 23. 4.3. Results ...................................................................................................... 27. 5.. Conclusion ....................................................................................................... 28. 6.. Annex ............................................................................................................... 29. 7.. References....................................................................................................... 32. 1.
(3) 1. Introduction. The main objective of this study is to see whether the entry of Romania in the European Union effectively improved Foreign Direct Investment (FDI) of this country. Trade in a country has on one hand positive effects since diversifies the goods and services available and so due to competition product price decreases and this leads in fact to a consumer surplus. When referring to the wealth of a country, trade leads to reduction in the price of products, better technology and a larger market and this involves more investment, economic growth and increase in employment. On the other hand, the increase in competition may lead to the end of domestic firms but this can be moderated through entrepreneurial policy and innovation. The accession of Romania in the EU is an advantage when considering trade. Foreign Direct Investment is considered to be relevant for economic development and many multinationals have appeared lately in Romania as well. Firstly, a briefly revision of the Romanian historical evolution of trade is presented and after that the contemporary trade and FDI situation of Romania before the entry in the European Union followed by the presentation of some data with results and conclusions of economists as well as graphs, tables taken from Eurostat mainly, and the behavior of Romanian Trade Balance. Secondly, the process of integration of Romania in the European Union, advantages, disadvantages, duties, changes as well as Government’s interventions. Thirdly, the literature’s review considering foreign direct investment phenomenon and taking this into account an econometric model having as a dependent variable FDI being a function of GDP of both domestic and foreign countries, exports and imports of Romania, corruption perception index and a dummy variable representing countries in the European Union.. 2. Presentation of the studied phenomenon. 2.1. Historical perspective The exchange of products and animals approximately equal in value or barter. was the first form of trading. Afterwards money was invented to facilitate trade between humans. First of all, appeared trade between people of the same town, then with the improvement of the infrastructure in the same country and finally between different countries, international trade. Global Industrial Revolution was not produced in Romania at the beginnings of XVIII century. The transition from hand production method to the 2.
(4) use of machines for manufacturing was produced later. After the I World War and the reintegration of Romania (since the territory was divided in several regions) there has been an improvement in the economy. After the II World War the new communist constitution has been created and from that moment on domestic and foreign trade is under the control of the communist government. Trade is made by public firms (nationalized companies) and international trade has decreased in substantial amount during that period. During the communist phase the nationalization of companies was produced and the co-operative farming was established. At that time everything was nationalized and was said to belong to the people. One of the communist’s government objectives was the intense industrialization of the country giving less importance to the third sector. As mentioned by Georgescu, (1972) in his book “Rumanía” the industry became at that time the most relevant for the improvement of the country’s economic growth at an annual rate of 12.8% during 19511970. Employment in the industry sector increased from 12% in 1950 to approximately 40% in 1991. In order to finance the high investment in the industry the communist government borrowed from the West, and the repayment of the foreign debt became very costly since the return on the investment in industry was not so high. The communist president Nicolae Ceausescu engaged in repaying the high debt and this was only possible through the decrement of population living standards since consumer goods were intended for exports (Ben-Ner and Montias 1991). And this was accompanied by the mechanization in the agriculture and with the increase in national income. The higher investment percentage went to the industry sector and the agriculture sector due to its historical relevance. Approximately 18% of total industrial production was exported. After 1989 with the end of communism in Romania, the re-emergence of private property occurs. Although during the transition there were many difficulties caused because the communist’s regime main focus was to reduce the foreign debt by limiting imports and increasing exports (Marcu, 2005). This produced a shortage of the necessary inputs for the national industry to develop while leading to a surplus in the trade balance. In order to reduce the external debt, investment and population consumption had to be diminished. As a consequence, the wealth of citizens decreased. Low labor productivity and low motivation were the characteristics of communist labor market since incentives as higher wages were not given to workers. The absence of entrepreneurial class and the fact that Romania was not attractive for foreign investors constituted a limitation for the change in the economic system. The transition was initiated mainly by privatization of nationalized companies, by opening to the international market and by being part of institutions as International Monetary Fund (IMF), the World Bank, the General Agreement on Tariffs and Trade (GATT) from 1971 or through signing agreements with 3.
(5) the European Union. In 1995 Romania becomes a member of the World Trade Organization. Romania has a trade agreement with the European Free-Trade Association (EFTA) and participates in the Black Sea Economic Cooperation (BSEC). 2.2. Process of integration in the European Union “The collapse of communism was followed by a long and deep recession rather. than economic boom despite the fact that the European Union offered financial support to help the countries of Central Europe in coping with drastic economic restructuring and political change”. (M.Peter van der Hoek, 2007). On 1st of February 1993 the first Europe agreement which offered trade benefits to Romania with the other European countries was signed. In 1995 Romania applies to join the European Union and from the beginning of negotiations in February 2000 Romania started to focus on policies to improve the situation of the country for its accession to be accepted although the accession of Romania was delayed because differences between this country and the other European members were relevant. In 2002 the Copenhagen European Council decided that the entry of Romania would be in 2007. In 2005 Romania had one of the lowest GDP per capita in the European Union as well as the lowest FDI inflow per capita. But it had high economic growth due to the reforms implemented until its accession in 2007 moment from which the authorities unfortunately did not keep on implementing these necessary reforms as before the accession. During 1995-2006 period Romania is the country with highest corruption level from the EU measured by the Transparency International, Corruption Perception Index, and this high level has been maintained constant during this period of pre-accession. 2.3. Access of Romania in the EU On 1st of January of 2007 Romania became a member of the European Union. with both rights from treaties and obligations from EU law as implications of its accession. With its entrance there is a special focus on implementing some measures related to food security, agriculture reforms, law regulations and fighting corruption. With respect to the agriculture funds the European members including Romania from 2007 must follow an Integrated Administration and Control System (IACS) in order to pay the farmers and for the rural development expenditures to avoid fraudulent practices. Furthermore, with the entry of Romania in the European Union the focus was on a reform of law and the fight against corruption by cooperation and verification from the European Union and the Romanian Government has been given the aim of fighting corruption and reforming the judicial system. Even if there had been done much to abolish corruption during the 4.
(6) transition and until the accession of Romania in the European Union there is still much to do. Since unfortunately, even nowadays Romania is one of the countries with highest corruption level when comparing the European countries and Western Europe countries. Taken from the Transparency International source with data from 2015, the CPI compares the countries public sector corruption level and Romania ranks in a very low position of transparency of the public sector with high level of corruption. According to the European Commission in its first report in June 2007, even though before the accession there has been some improvements in the judicial system, more efficiency and transparency is needed in Romania and these measures have to be implemented. At the moment of the Romanian accession in the EU the judicial treatment against corruption was not sufficient in accordance to the European Commission as it is not even nowadays even if measures have been applied; these ones are not enough to see a relevant positive change in the level of corruption which is still acute. Romania had a considerable positive growth after the transition although there was and still there exists an important gap between this country and other European countries. As stated by Parean and Vadasan, (2012) at the moment of Romanian accession six of the EU poorest economic regions were in Romania. However, the accession benefited the country bringing economic prosperity, modernizations of institutions and foreign direct investments. Highly qualified workers left the country looking for better opportunities and higher wages. After the accession the crash of 2007 happened and this also affected Romanian economy with an internal crisis in 2008 due to as some authors argue, the external demand decrement, or the investors more conservative attitude or the governmental ineffective measures. One of the objectives adopted by the government with the accession was the improvement of infrastructure especially transport but this has still much to improve even nowadays. With the accession, as stated by Parean and Vadasean, (2012) in 2008 the government adopted a program to fight against the recent crisis negative effects called “Action Plan for Economic Growth and Jobs”. The measures focused on fiscal relaxation, employment, increment of aggregate demand through government expenditures, the aggregate supply by favoring private investment and administrative measures to improve the coordination of activities.. 2.4. Quantitative description International trade of the capitalist developed, developing and socialist countries. increased. At a global level there has been, due to the international trade, an increase in GDP. In 1989 with the beginning of transition Romanian gross domestic product 5.
(7) decreased considerably until 1992 when it started its positive growth again. From 2000 on there has been a positive growth of GDP accompanied by high growth in investment as well. However, this positive trend stopped with the beginning of the international 2007 crisis which affected also Romania. Although in 2014 GDP has almost reached the level it had before the start of the crash in 2007 and the forecast is positive growth of GDP for the next years. According to data from the World Bank GDP per capita at current prices in 2007 was $7,966.03 and $10,034.67 in 2014, so there has been an increase of wealth of citizens as well. With respect to investment as a percentage of GDP, from 2000 is characterized by a positive trend being approximately 20% and reaching its maximum level of 33, 44% in 2008 moment from which started decreasing being 23,01% in 2014. With respect to the unemployment rate, from 1991 on it increased hugely until 1994 when it decreased until the crisis of 2007 affected Romania’s employment rate as well as other European countries. Nevertheless, the employment rate decreased in a lower proportion than in other countries with a current unemployment rate of 5,37% in March 2015 according to National Labour Agency. In the following figure 1 obtained with data from the National Agency for Employment and National Institute of Statistics, we can observe the evolution of unemployment in Romania from 2001 until 2014.. 6.
(8) We observe high level of unemployment at the beginnings of 2000s followed by a downward trend until the crisis of 2007 was initiated moment from which unemployment rose sharply. From 2010 decreased considerably until nowadays. Corporate tax rate in Romania in 2012 was at a very low level 16% so this should encourage foreign companies to invest in the country as it is low similar to the corporate tax in Ireland (12,5% in 2012) but very low if we compare it with the Spanish corporate tax rate of 30% or German one of 29,48% both in 2012. Furthermore, for foreign investors to establish their company in Romania another important thing to take into account is the ease of doing business. The World Bank has done a study with economy rankings from many countries in the world taking into account the country regulatory environment to start a business and in June 2014 Singapore is ranked as the first preferable country to do business in followed by New Zealand, Hong Kong and China. Other countries are Denmark, Republic of Korea, Norway, United States, United Kingdom, and Spain occupying the 33 ranking place and Romania 48 ranking place out of 189 countries of the world. During the period from 1990 to 2007 we observe empirically a positive evolution of trade in Romania an increase tendency in exports. Romanian rural economy is dominated by agriculture, which is mainly characterized by subsistence farms producing for self-consumption; very few are selling in the market and this would be a possible explanation of the small agriculture exports percentage observed empirically. Romania is implementing a 2004-2025 agriculture strategy aimed at ensuring food security and self-sufficiency by completing the privatization of state farms and promoting rural development. Romania is rich in minerals and has the largest production of crude oil and natural gas in Central and East Europe. The manufacturing sector is diversified; textiles, iron, automotive and electrical machinery which have increased in the last years. Due to privatization private ownership in manufacturing has increased. Services sector is the most important sector since contributes more than half per cent to GDP. In figure 2 obtained with data from Eurostat we can see the evolution of exports and imports. There is tendency of exports increment in Romania from 2002 but in 2008 due to the recent crisis there has been a decrement in Romanian exports to European countries although in 2010 the positive tendency started again caused by the accession of Romania in the European Union. Recent research, by Ioan and Angelo Ioan, (2013) studied the upward trend of trade balance before the crisis of 2012; as we see in our graph the small descend of exports was followed by a recovery.. 7.
(9) With respect to imports in Romania from European countries there is an upward trend in concordance with the exports positive evolution. We observe a decrement in imports from the crash of 2007 due to the fact that Romanian citizen’s demand of products decreased. From 2009 on, the upward trend starts again although between 2011 and 2012 there is a small decrease. Analyzing the 2002-2014 period the trade balance has been negative mostly from 2002 to 2008 when the crisis started, moment from which there has been a downward trend in the trade deficit mainly because of the decrease in imports as a consequence of lower Romanian people’s willingness to consume. This upward tendency in the trade balance may also be due to the fact that from that moment on, the Romanian exports became more attractive as these ones are cheaper. Therefore, there has been an improvement in the trade balance in the last years although there is still trade deficit. In the following figure 3 extracted from the National Institute of Statistics 2014 Bulletin we observe the main exports of Romanian goods. Romania has traditionally exported machinery and mechanical devices. “Dacia” automobile industry, relevant mostly in Eastern Europe is the reason why machinery ranks as first group of exported good, followed by transport means, textiles and agrofood products. Finally, from the National Institute of Statistics we classify exports by its partners which are mostly European countries. Romanian exports go to Germany, followed by Italy at second place. France, Hungary and Turkey are main partners as well.. 8.
(10) According to data from Central Agency of Intelligence of US, from The World Factbook, exports are very important for economic growth, and approximately 70% of Romanian trade is within the European Union. GDP real growth rate was 2.4% in 2014. When comparing the composition of Romanian GDP, approximately 12% goes to agriculture, 35% to industry and 53% to services. 2.5. Foreign Direct Investment “Foreign direct investment (FDI) is a key driver of international economic. integration. With the right policy framework, FDI can provide financial stability, promote economic development and enhance the wellbeing of societies.” (OECD Benchmark Definition of Foreign Direct Investment, 2008). In the era of globalization we are living foreign direct investment is an important factor for international economy since if governments use the right policies it can help the global development improving the situation of both host and home countries. As stated by OECD, “FDI encourages the transfer of technology and know-how between economies”. FDI of the world has grew hugely in the last decades and its mainly actors are the multinational enterprises since these big companies have the possibility to invest in other countries rather by greenfield investment or by merger and acquisition. According to John Dunning, the necessary conditions for FDI are the ownership advantage, which means a company has an advantage because of providing unique products to the market as patents. The location advantage is another condition meaning that is beneficial for a multinational to locate a 9.
(11) plant in the foreign country. For different reasons a foreign company would like to locate in Romania either because of saving costs, or because of the natural resources or for closer access to consumers, etc. And finally, the internalization advantage from setting up a new plant in Romania, a country that would benefit from the production process of a Romanian firm. There are two types of Foreign Direct Investment, Horizontal FDI and Vertical FDI. Horizontal FDI occurs between very similar countries since it is about duplicating activities in other countries while benefiting from firm-level economies of scale. While Vertical FDI occurs mainly between different countries since it is about separating activities by function. The country with high technology level locates its headquarters in the home country and its operational plant in a country with lower standard of living benefiting in this way from lower labour costs. Having in mind the distinction of FDI we can have an idea of the type of FDI in Romania by having a look at the distribution of FDI by main economic activities. In the following figure obtained from Andrei (2012) own elaboration with data from NIS (National Institute of Statistics) and NBR (National Bank of Romania) we can see that the major percentage of FDI goes to the manufacturing sector with more than 30% of FDI stock where the main industries were rubber and plastic products (6.3 %), metallurgy (5.2%), transport equipment (4.7%), food, beverages and tobacco (4.1%), oil processing, chemicals, cement, glassware, ceramics (3.3%) and textiles, wearing apparel and leather goods.. Another important sector that attracted FDI is the financial and insurance sector followed by the constructions sector with a significant amount of FDI stock. As mentioned in (Andrei, 2012) the FDI inflows and stocks are dominated by the European Union 15 10.
(12) member countries. The first six countries investing in Romania, (Savoiu, 2012) are The Netherlands with 20.7% of total FDI, followed by Austria (17.8%), Germany (12.2%), France (8.3%), Greece (5.7%) and Italy (5.3%). And these countries mentioned previously have the 70% of FDI in Romania. During the first years of the transition, Romania was characterized by one of the lowest Foreign Direct Investment in Central and East Europe and an important decline of GDP. From 1997 to 1999 Romania had negative growth rates. However, this situation changed from 2000 on as pointed by Gheorghe and Vasile (2012), due to the privatization process. The type of FDI in Romania is directed to industries with low technology such as food industry, wood and manufacturing. Foreign Direct Investment in a country creates employment since many firms invest in the country by doing Greenfield FDI a foreign company that would start a new venture so building an operational facility in Romania or by Merger and Acquisition; merger a consolidation of a foreign with a Romanian company or acquisition of a Romanian company by a foreign enterprise. There is still nowadays low level of FDI inflow and one of the main reasons for this is the distrust of foreign investors due to the high country risk level and the corruption problem in Romania.. Foreign Direct Investment has followed a positive growth path from the transition on since in the nineties FDI was almost non-existent as observed in the previous Figure 5 obtained from (Nistor, 2014) due to the fact that it was a communist economy until 1989 and during the transition measures to attract FDI have been applied and so FDI. 11.
(13) inflows have been seen until the crisis of 2008 moment from which the FDI inflows in Romania have been reduced and from 2012 we see increment of FDI inflows again. In the following Figure 6 obtained from United Nations Conference on Trade and Development, UNCTAD’s 2014 World Investment Report we observe the inflows and outflows of Foreign Direct Investment of some countries of the world. In 2013, Romania’s FDI inflows are higher than its FDI outflows.. 12.
(14) As a consequence we can argue that Romania receives more foreign direct investments from world economies than the amount of Romanian direct investments in other countries. This FDI inflow in Romania is mainly in form of Greenfield Investment as we can see in the previous figure 7, obtained from the same UNCTAD World Investment Report 2014. As argued in (Ghibutiu, 2014) FDI will continue its positive growth because of its competitive labor market and its productivity level but in order to attract FDI in the country it should focus on Greenfield Investment and Merger and Acquisitions since the privatization form of FDI has been almost completely done. In the previous paper it is argued the relevance of the automotive sector, the banking and IT and communications sectors. The economic freedom, also mentioned in the previous paper by Ghibutiu (2014), is an important factor when considering doing business in a country. As we can see in the previous figure 8 obtained from the Index of Economic Freedom website, the business freedom has followed a positive growth path in the last years getting closer to the levels of European countries, in our example Germany and Spain.. 3. Revision of the literature “It is widely believed that the advantages that Foreign Direct Investment brings to the standard of living and prospects for economic growth of the host nation largely outweigh its disadvantages” (Janicki and Wunnava, 2004). As Foreign Direct Investment creates growth and wealth in a country many economists have studied the factors that determine it in order to give advice on the good measures that must be taken to get an improvement of the overall economy with it. As mentioned in (Vasilescu, 2007) in order to attract foreign investors the Romanian Corporate Tax Rate is very low, at 16% although this is 13.
(15) not enough since the country risk and corruption remain still at high levels so these cause lack of confidence, but the advantage is that there is high level of education in the labor market accompanied by low labor costs and this attracts FDI. Direct Investment flows have had a low growth when taking into account the Romanian natural resources and skilled labor but as mentioned before there is lack of confidence from investors caused by high corruption. The rate of absorption of European Union funds from its accession remains still low because of lack of government transparency (Zgribut and Olaru, 2011). According to the European Comission in 2010 the rate of absorption was at 14% in the last place in absorbing European funds before Greece with 12%. We can argue consequently that this low absorption rate of European funds discourages foreign direct investment in Romania. The theoretical models of FDI are based in the advantages of a firm as argued by Quazi (2014) and Sova et al., (2009); in the OLI (ownership, location and internalization) introduced by Dunning (1998:1) framework. The ownership advantage may be a patent, reputation for quality. The ownership factor answer to the “why” question for foreign production and is influenced by the availability of firm specific resources and capabilities. The location factor answers to “where” to locate foreign production which takes into account the search of new markets, efficiency and strategic assets or advantage of low factor prices. The internalization factor answers to “how” firms internalize markets and is driven by transaction costs. The internalization advantage responds to the firm’s interest in maintaining its knowledge assets as for example their skilled workers who know the firm’s technology internally and in this way avoid spillovers. UNCTAD defines three types of FDI determinants: market seeking, resources or assets seeking and efficiency seeking. Furthermore as mentioned before there are different types of Foreign Direct Investment namely Greenfield Investment which can be whole ownership or joint venture and Merger and Acquisition. As defined by Raff (2012), Greenfield Investment consists in setting up a plant in the host country to produce goods there and for that production the firm uses its own assets; Merger and Acquisition consists in the acquisition by a multinational of a local firm and the combination of its own and the local firm’s assets in the host market; and finally the joint venture is the cooperation of two independent firms that choose to share assets. Botric and Skuflic (2006), choose to classify FDI for the host country into three groups: policy framework, economic conditions and business facilitations. The theoretical factors that determine FDI and are considered relevant by most economists and so included in some econometric models are the market size which represents the size of the host market which is the most relevant factor when considering Horizontal FDI and is irrelevant for Vertical FDI (Kravis and Lipsey, 1982). It can 14.
(16) represent as well the host country’s economic conditions and the potential demand for the FDI’s investors. Is calculated by the Real per capita GDP in the econometric model of Khadaroo and Seetanah (2010), representing the demand for goods produced by foreign companies. Important authors in the economic literature as Stopford and Strange (1991) and Dunning (1993) suggest theoretically that one of the main determinants of the location of FDI is the search for markets with the aim of focusing on customers, suppliers and competitors abroad. According to these authors is positive if these markets provide good access to resources, different factor endowments, high consumer demand, good level of technology as well as good institutions and government policies. Market size is an important factor in determining FDI according to authors such as Savoiu and Popa (2012) measuring it in their econometric model as GDP level and GDP per capita. GDP as a variable measuring the market size is used as well by Amarandei (2013), Quazi (2014) who uses the natural log of per capita Real GDP adjusted for purchasing power parity as a proxy for the market size. This author considers market size determinant in “market seeking” and relevant for the location of FDI since multinational enterprises consider important the market demand of the host market that is the reason he considers this variable in per capita terms and as greater market size higher attraction of FDI. Variables as GDP per capita and GDP growth are considered relevant factors by Jun and Singh (1996). Botric and Skuflic (2006) consider as well market seeking adding factors as GDP, GDP growth and the population as determinants for FDI. The size of the host economy taken as the natural logarithm of GDP is considered relevant for FDI inflows by Janicki and Wunnava (2004) that obtain results such as greater the economy greater the expected FDI flows. Market size is an important domestic factor of FDI with a positive relationship according to Mohamed and Sidiropoulos (2010) that consider natural logarithm of GDP as a representable variable of FDI. “Equity FDI is influenced significantly by market size factors” (Wolff, 2006). According to Sova et al., (2009) the market size of the host country and the origin country and geographical distance between them is important for Foreign Direct Investment’s attraction. Another relevant determinant are production costs, the labor and fixed costs included in this theoretical variable affecting FDI is considered important by Vasilescu (2007) who defends higher qualification of labor force and low labor costs as relevant for higher FDI in the host country. Savoiu, and Popa (2012) consider important the production costs as well as skilled labor and employers with good knowledge of foreign languages. The human capital is relevant according to Quazi, (2014) who considers the availability of skilled workers as the log of per capita expenditure as a proxy for human capital. As mentioned in (Görg and Jabbour, 2009) multinationals adapt their production to the 15.
(17) differences in factor costs and choose location of production of labor intensive goods in labor intensive countries while keeping capital intensive production in their own country or in other developed countries. Wage costs are considered important by Jun and Singh, (1996) and comparative labor costs by Khadaroo and Seetanah, (2010). These authors defend labor costs are determinants mainly of Vertical FDI when attracting investment from advanced countries in labor intensive activities to less developed countries. As well as giving importance to human capital arguing that a more educated population can learn and adopt to new technology faster and the human capital, according to them, affects both Vertical and Horizontal FDI. They use the variable “ser” in their econometric model referring to the secondary education enrollment rate. As variables for asset or resource seeking labor costs are considered for determination of FDI by Botric and Skuflic, (2006). Labor costs in host country are considered as well in (Janicki and Wunnava, 2004). In addition, natural resources, as a general fact greater amount of natural resources means higher attraction of FDI in a host country. Vasilescu, (2007) considers that the existence of important natural resources and proximity to energy suppliers are factors that support higher FDI as well as Savoiu and Popa, (2012). Mohamed and Sidiropoulos, (2010) give importance to natural resources also and include this as the natural logarithm of fuel export (as a percentage of merchandize exports) variable in their econometric model. Infrastructure is also important for FDI inflows in a country and it consists of roads, ports, electricity...etc. According to Savoiu and Popa, (2012) developed physical infrastructure as well as proximity to an airport and to suppliers is relevant for attracting FDI. Quazi (2014) also considers infrastructure as important and measures the natural logarithm of per capita electricity as a proxy for the availability of infrastructure. Other authors such as Wheeler and Mody, (1992), Loree and Guisinger, (1995), Richaud et al., (1999), Asiedu, (2002), Morrisset, (2000), Sekkat and Veganzones-Varoudakis, (2004) argued that infrastructure is necessary for foreign investors to be able to operate in a host country. Khadaroo and Seetanah, (2010) consider infrastructure quality as one of the main factors in attracting FDI and their recommendations are against the cuts in public expenditures even in difficult times because of infrastructure’s relevance in determining FDI. Botric and Skuflic, (2006) use the number of internet connections as a proxy variable for infrastructure and finally, Mohamed and Sidiropoulos, (2010) measure infrastructure in their econometric model as a proxy for infrastructure the telephone line subscribers as per 1000 person. Furthermore, the degree of openness to trade referred to the openness to the foreign market analyzing exports and imports, Romania is opened to trade with the world countries and has many advantages from its entry in the European Union as a member 16.
(18) of this specific market. And the degree of openness can be measured as the level of exports and imports in a country. Authors such as Savoiu and Popa, (2012), use exports and imports as determinants of FDI. In addition, Jun and Singh, (1996) defend that export orientation of countries may be important for encouraging FDI flows arguing also that even a small country could attract high level of FDI by implementing export-oriented policies that is the reason these authors include exports as an indicator of the openness of an economy, since higher level of openness of the host country higher chances to attract FDI. Khadaroo and Seetanah, (2010) measure the openness of the economy on FDI as trade over GDP. Janicki and Wunnava, (2004) consider as well important the openness to trade as a determinant of attracting FDI. Buch et al., (2001) consider the level of imports as an indicator of openness of the country and so relevant for FDI. Also Mohamed and Sidiropoulos, (2010) sujest that the trade openness is relevant for FDI and so these authors take the sum of both imports and exports as a determinant variable for FDI. They measure trade openness as Levinne et al., (2000) since an increase of exports of a country attracts foreign investors because if government applies an open trade policy so an export-oriented strategy this gives incentives to produce export goods. Furthermore, with an import-substitution strategy, foreign investors are also attracted since they can sell their products in domestic markets with this government protection. Investment and political risk, corruption level are important factors that foreign investors take into account before establishing their firm in a country. As well as these determinants Vasilescu (2007) gives importance to the legislative environment because if there are no good institutions that brings lack of investors’ confidence. Savoiu and Popa, (2012) comment that investment risk is relevant for FDI in the host country both in economic and political environment terms. In accordance to World Bank (2002) corruption creates obstacles in doing business. Discussed by Amarandei, (2013) Romania is a highly corrupted country according to Transparency International methodology so the author uses as a variable of corruption the Corruption Perception Index which is computed as an unweight average of all estimates for a particular country finding a negative relationship between corruption and FDI. The corruption perception index is ranged from 0 to 10 being the highest number indicating absence of corruption. So a positive relationship between Corruption Perception Index and FDI attraction. According to Quazi, (2014) corruption, which is treated as a location factor can affect the location advantage of the host country, it can act “either as a grabbing hand by raising uncertainty and transaction costs, which should impede FDI, or a helping hand by “greasing” the wheels of commerce in the presence of weak regulatory framework, which should facilitate FDI”. As well as other economists, Quazi, (2014) uses the Corruption Perception Index to measure the impact of corruption on FDI. Since it is a reliable 17.
(19) measure published by the Transparency International, which scores countries from 0 (highly corrupted) to 10 (very clean). This author considers as well the relevance of political stability since “political instability drives FDI away” (Quazi, 2014) and uses the “Political Stability and Absence of Violence” indicator developed by the Worldwide Governance Indicators (WGI) project as a proxy for political stability. This indicator uses dataset collected from survey institutes, think tanks, and international organizations to measure political stability. Quazi (2014) concludes that with the aim of attracting FDI, a country should focus on reducing corruption using anti-corruption policies or adopting new strategies. Other authors such as Jun and Singh, (1996) consider socio-political variables as well and argue that “negative events” have negative effects on inward FDI. Impressive results are obtained by Haksoon (2010) who argues that countries with high level of corruption and low level of democracy have higher FDI inflows after controlling for macroeconomics variables. Mohamed and Sidiropoulos, (2010) consider in their econometric model institutional quality variables as investment profile which has a positive relationship with FDI and the level of corruption in the host country which as mentioned previously affects negatively foreign direct investment. The authors mentioned before argue that reducing macroeconomic instability is important and the government should take measures in order to attract FDI. Economic freedom which represents the business operating conditions are also taken into account by foreign investors as well. Savoiu and Popa, (2012) mention the liberalization of business as beneficial for FDI attraction in the host country. Authors such as Fallon et al. (2001) give importance to liberalization and deregulation of markets to attract FDI, as well as reduction in trade barriers and worldwide privatization. Quazi (2014) introduces in his econometric model the economic freedom variable for determining FDI using the Economic Fredom Index published by the Heritage Foundation and Wall Street Journal as a proxy for domestic investment climate, the quality of investment climate in host countries. In addition, Jun and Singh, (1996) consider the business climate an important determinant of FDI. Botric and Skuflic, (2006) recommend to improve the business climate reducing administrative procedures and increasing transparency. Janicki and Wunnava, (2004) give importance to the investment climate as well, adding the host country risk using a proxy of credit rating as a variable determinant of FDI. Exchange rate is important as well since by the time Romania accessed the EU it began a process of integrating the euro in this country but this process did not end even neither nowadays so the exchange rate is still relevant for determining foreign direct investment. Many authors such as Jun and Singh, (1996) consider this as an important variable as well. 18.
(20) Inflation is important since if in a country the level of prices is exposed to lots of changes will be negative for foreign direct investment because of the instability it causes. Mohamed and Sidiropoulos, (2010) include the inflation rate as a determinant variable for FDI in their econometric model and find a negative relationship between them. Botric and Skuflic, (2006) consider inflation in their econometric model of the determinants of FDI for the southeast countries as well. Employment is considered a relevant factor for FDI since multinational enterprises create employment when locating in the host country according to Görg and Jabbour, (2009). Authors such as Sune Karlson, Nannan Lundin, Frederick Sjöholm and Ping He focus on the effect of FDI from multinationals on job creation as an indirect effect, and consider as a direct effect the benefits for domestic firms from inward FDI, multinationals that have better knowledge and technologies. Corporate tax rate is another determinant of FDI. As a general fact, lower is the corporate tax rate for a firm in the host country higher is the chance for foreign investors to be attracted in that specific country to do business. Khadaroo and Seetanah, (2010) defend that fiscal incentives tend to affect more Vertical FDI because it is the reason of this type of FDI, save costs and this would be a benefit for multinationals. Although empirical results of Wolff (2006) show that it is difficult to confirm that high corporate tax rates are one reason of low investments from abroad in the host country.. 4. Analytical framework Keeping in mind what previous economists consider relevant determinants for FDI in a country we specify an equation based in a gravity model. Gravity models were first developed by H. Carey (1860) who was inspired by the Newtonian law of gravitation which states that two celestial bodies are attracted directly proportional to their mass and indirectly proportional to their distance. Carey applied this theory to the study of human behaviour and later Tinbergen (1962) used the gravity equation to study the international trade flows, and stated that trade between two countries depend on the economic size measured as GDP, greater the GDP greater trade. The population, distance, greater distance higher the costs of transport so less trade. As well as languages, trade agreements, law system etc. Other authors such as Anderson (1979) and Bergstrand (1985) used the gravity equation for explaining trade. Tinbergen (1962) used a formula as the following one to explain bilateral trade flows between country i and j taking into account the GDP of each country, represented in the equation as Y directly related and the distance (D) inversely related.. 19.
(21) 𝐹𝑖𝑗 =. 𝐴𝑌𝑖 𝑌𝑗 𝐷𝑖𝑗. In accordance with Talamo (2007) who considers the gravity model to measure the FDI flows, we are going to use the GDP of domestic and foreign countries, the exports and imports as a level of openness, a dummy variable if one specific country is a member of the EU and has important trade agreements representing the economic integration as well as the corruption level, which is considered by previous literature as main inconvenient for FDI inflows in Romania. The choice for these explanatory variables was based on the existing theoretical and empirical literature on the gravity model. Generally, gravity models suggest positive relationship between the size of economies and direct investment flows as stated in (Talamo, 2007) and is negatively related to distance. That is the reason we consider the gross domestic product of both domestic and foreign countries in our model. We take into account the direct investments of the main countries or group of countries that invest in other countries. We consider a variable called “id” which is the control variable representing the name of the country or group of countries investing directly in Romania through locating a company there or a plant for production. These are North Africa, Japan, United States, Canada, European Union, Russia and Switzerland. The level of Gross Domestic Product in Romania, to have an idea of the Romanian market size. In addition, the GDP of the foreign considered countries to be able to see their market potential for investing in Romania. In order to see the degree of openness to trade we include in the model exports and imports values from Romania with the previously mentioned countries. Furthermore, the dummy variable which indicates the membership to the EU, as well as the corruption level measured by Transparency International in its Corruption Perception Index (CPI). Therefore we can perform an econometric model with FDI as dependent variable and the previous mentioned factors as independent variables affecting the Foreign Direct Investment.. FDI= 𝑓(𝐹𝐷𝐼) = (X, M, 𝐺𝐷𝑃𝐷 , 𝐺𝐷𝑃𝐹 , 𝐶𝑃𝐼, 𝑑𝑢𝑚𝑚𝑦𝑒𝑢 , 𝑖𝑑) Using the gravity approach, we expect therefore, FDI inflows to be greater from countries with higher GDP and to be negatively correlated with the variable determining the membership to the European Union, implying less distance and better trade benefits. Furthermore, taking into account the previous literature we expect negative relationship between FDI inflows and corruption level in Romania and to be positively related with the openness to trade, measured in our model by the amount of exports and imports. 20.
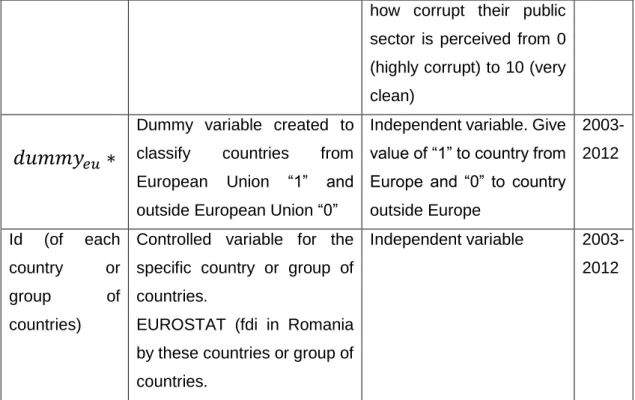
(22) 4.1. Data and statistical tables. In the following table there is a description of the explained variable and the explanatory variables as well as the method used to calculate this.. Description of variables Measure. Data source. Calculation. Year. FDI. Direct investment Stocks in Dependent variable. FDI of 2003millions of euros. Financial each considered country or 2012 account, Direct Investment in group the reporting country.. of. countries.. Measured as logarithm.. EUROSTAT database. Exports. Exports of Romania to each Independent partner country or group of measured countries considered. Data by Export. variable 2003-. as logarithm. 2012 trade. value. the World Integrated Trade converted from dollars to Solution. Imports. euros. (EUR thousands). Imports of Romania from its Independent. variable 2003-. considered partners. Data by measured as logarithm. the World Integrated Trade Import Solution.. trade. 2012. value. converted from dollars to euros (EUR thousands). Gross Domestic Product of Independent. 𝐺𝐷𝑃𝐷. variable 2003-. domestic country (Romania).. measured as logarithm.. EUROSTAT. Romanian GDP at current. 2012. prices in million euros Gross Domestic Product of Independent the. 𝐺𝐷𝑃𝐹. partner. variable 2003-. countries measured as logarithm. 2012. mentioned before with the aim GDP of foreign countries at of. observing. their. market current. prices,. million. potential to invest in Romania. euros EUROSTAT Corruption. The CPI measures the levels Independent. variable 2003-. Perception. of public sector corruption of measured as logarithm. 2012. Index (CPI). 175 countries and territories.. The CPI ranks countries and territories based on. 21.
(23) how corrupt their public sector is perceived from 0 (highly corrupt) to 10 (very clean) Dummy variable created to Independent variable. Give 2003-. 𝑑𝑢𝑚𝑚𝑦𝑒𝑢 ∗. classify. countries. European. Union. from value of “1” to country from 2012. “1”. and Europe and “0” to country. outside European Union “0” Id. (of. outside Europe. each Controlled variable for the Independent variable. country. or specific country or group of. group. of countries.. countries). 20032012. EUROSTAT (fdi in Romania by these countries or group of countries.. In our data of the FDI inflows in Romania from the countries considered (North Africa, Japan, USA, Canada, European Union, Russia and Switzerland) we can see the evolution followed by a path of growth interrupted by the crash of 2007 which caused a decrease in Romanian GDP.. 60. 160 140 120 100 80 60 40 20 0. 50 40 30 20 10 0 2003. 2004. 2005. 2006. 2007. 2008. 2009. 2010. 2011. 2012. GDP in thousands of euros. FDI in thousands of euros. Figure 9: Evolution of FDI and GDP of Romania for the period 2003-2012. year FDI. GDP of Romania. Source: Own elaboration with data from EUROSTAT and World Integrated Trade Solution *dummy variable representing if one specific country is a member of the EU. Because of the relevance of Switzerland with respect to trade agreements with EU members and FDI flows, we include this country as a supposed “member of EU”.. 22.
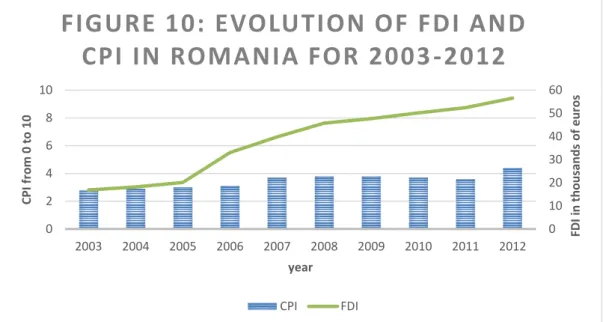
(24) In the following figure inspired on the figures drawn by Amarandei, (2012) we observe the evolution of foreign direct investment and corruption perception index of Romania. We observe the slow improvement of Corruption Perception Index in accordance with increment of FDI inflows in Romania over the years considered.. 60. 8. 50. CPI from 0 to 10. 10. 40. 6. 30 4. 20. 2. 10. 0. 0 2003. 2004. 2005. 2006. 2007. 2008. 2009. 2010. 2011. FDI in thousands of euros. FIGURE 10: EVOLUTION OF FDI AND CPI IN ROMANIA FOR 2003 -2012. 2012. year CPI. FDI. Source: Own elaboration with data from EUROSTAT and World Integrated Trade Solution. 4.2. Econometric model. As previously mentioned we have obtained the data and created the econometric model with the relevant determinants of FDI according to the literature. We use Gretl which is the program we have learned more in deep at the university and has the advantages of being free and easy to use. We use a panel data importing the data downloaded from Eurostat and World Integrated Trade Solution. The Panel Data Model is added in the Annex. Exports and Imports values of Romania and its partners which have been obtained from WITS have been converted from dollars to euros in order to have the same currency using Oanda currency convertor. Therefore the data is given a panel interpretation using as index variables the “id” or the country or group of countries and as time index variable the “year”. We obtain a Pooled Ordinary Least Squares estimation using 70 observations, 7 cross-sectional units (the countries specified previously) observed over 10 periods from 2003 to 2012. In order to see the relationship with the dependent variable and the independent variables we have obtained three models. This idea is based on Savoiu and Popa, (2012). 23.
(25) that obtain various models to describe determinants of FDI focusing in each model on a specific variable or variables. The first model includes all the variables mentioned before, it is a regression of OLS estimation: 1st Model (including all variables):. log(𝑓𝑑𝑖) = 𝛽0 +𝛽1 log(𝑒𝑥𝑝𝑜𝑟𝑡𝑠) + 𝛽2 log(𝑖𝑚𝑝𝑜𝑟𝑡𝑠) + 𝛽3 log(𝐺𝐷𝑃𝐷 ) + 𝛽4 log(𝐺𝐷𝑃𝐹 ) + 𝛽5 log(𝐶𝑃𝐼) + 𝛽6 𝑖𝑑 + 𝛽7 dummyeu + 𝜀. From the 1st model we can do the interpretation of the variables. Ceteris Paribus, keeping everything else constant a 1% increase in exports leads to a 12.5% increase in Romanian FDI inflows from the countries considered. But paying attention to the p-value of exports, which is 0.24577 so greater than the level of significance considered 5% therefore this variable is not significant in determining the FDI inflows of Romania. This can be interpreted when considering the null hypothesis of the parameter of exports to be equal to “0” that is in fact not significant in determining the dependent variable. The 24.
(26) same method applied to the interpretation of the other variables and we conclude that these ones are significant except the corruption perception index, which seems to not explain the level of FDI in Romania. Our second model focuses on the market size of Romania and the foreign countries for determining the level of foreign direct investments in Romania. 2nd Model (based on market size):. Log(𝑓𝑑𝑖) = 𝛽0 +𝛽2 log(𝑒𝑥𝑝𝑜𝑟𝑡𝑠) + 𝛽3 log(𝑖𝑚𝑝𝑜𝑟𝑡𝑠) + 𝛽4 log(𝐺𝐷𝑃𝐷 ) + 𝛽5 log(𝐺𝐷𝑃𝐹 ) + 𝛽6 𝑖𝑑 + 𝛽6 dummyeu + 𝜀. While considering the variables focused on market size all the variables are significant in determining the level of FDI in Romania except exports value. What is relevant here is the high significance of gross domestic product of foreign since this is as we expected to be. Market potential of the partner countries of Romania is important for the FDI inflows in the country, and this is positive related as our expectations. For this particular model based on market size is relevant to comment as well the importance of 25.
(27) high significance of dummyeu since this positive relationship suggests that the inflows of FDI in Romania are greater if the country is from EU or Switzerland. Lastly we obtain a model focused on corruption to see if taken separately from other independent variables this CPI is significant. For that objective we create the third model which includes the Corruption Perception Index of Romania from 2003 to 2012 as well as the GDP of foreign countries in order to keep in mind the market potential of foreign countries which can be reflected by this Gross Domestic Products of the countries considered in our model, since if the GDP in a country increases in principle increases the chance that this country invests in other parts of the world. 3d Model (based on corruption):. Log(𝑓𝑑𝑖) = 𝛽0 + 𝛽1 log(𝐺𝐷𝑃𝐹 ) + 𝛽2 log(𝐶𝑃𝐼) + 𝛽3 dummyeu + 𝜀. When considering a model based on the corruption level and the market potential of foreign partners we obtain that corruption is relevant in determining the level of FDI in Romania since it is significant. We obtain a positive relationship between the corruption perception index and FDI inflows, meaning that higher is the CPI higher is going to be the FDI inflows in Romania.. 26.
(28) 4.3. Results Many of our results coincide with the version of previous literature in the field of. determinants for FDI inflows. Starting with the level of exports, in both the first and second models these ones are positive related with FDI inflows. This suggests that even though is not significant in our models, higher level of exports increase the degree of openness and so with it there is higher chance for FDI inflows in the country. Imports variable, has a negative relationship with FDI inflows in Romania. This may happen because as the country imports more from its partners, and buys their products, it is not necessary anymore to invest in that domestic country with the aim of market seeking, so looking for consumers, because the market is already served by exporting to this domestic country. With respect to gross domestic product of Romania, in both first and second model we obtain positive relationship with FDI inflows, because higher GDP means the country’s wealth has increased and this goes in line with higher chances for FDI inflows as a consequence of being more attractive for investors. These results are in accordance with studies by Savoiu and Popa, (2012) and Janicki and Wunnava, (2004) that obtain results such as greater the economy greater the expected FDI flows. Another hypothesis is that the gross domestic product of foreign countries is relevant for the FDI inflows in Romania from these countries since higher their market potential higher probabilities for them to be able to invest in Romania. And this is in accordance with our results of high significance of positive relationship between GDP of foreign countries and the explained variable, the FDI inflows in Romania and is consistent with previous literature by Sova (2009) who considers relevant the market size of both domestic and foreign countries. The corruption perception index variable, as expected is positive related with the FDI inflows, meaning that higher the CPI greater will be the FDI inflows, since the CPI is classified from 0 (highly corrupt) to 10 (very clean). This is consistent with previous literature that as well finds negative relationship between corruption and FDI inflows by Amarandei (2013) and Quazi (2014) among others. Even though in our first model the CPI is not significant because there is almost no change from 2003 to 2012, it is significant when focusing on corruption in the third model. Finally the dummy variable is always significant in all our three models as a consequence of the high level of empirical data of high trade between EU, so we can confirm that being a country from Europe is an advantage for doing FDI in Romania.. 27.
(29) 5. Conclusion. As previously observed and studied in literature, with the transition and the end of communist phase initiated by privatization of previously nationalized companies both exports and imports increased over time opening to trade in the international market. This is accompanied by benefits to Romania from trade agreements with the European Union. Before the entrance in the EU Romania was characterized by one of the lowest GDP per capita and FDI inflows as well as one of the highest corruption perception index in the EU. With the accession in 2007, the GDP per capita, trade balance, employment rate and FDI inflows improved although there is still much to do also because of the recent crisis that affected Romania as well as the lack of investors’ confidence and governmental ineffective measures. As stated by OECD, Foreign Direct Investment is relevant for economic development and knowing the importance of this we have obtained the econometric model. Our findings coincide with the literature with respect to the relevance of both exports and imports representing the openness to trade as positive for the FDI inflows. Furthermore, we have confirmed that the GDP of both domestic and foreign countries are relevant determinant and both positively related with FDI inflows. The relevance of the benefits for Romania from its entry in the EU is confirmed by the significance of the dummy variable for EU membership, positively related with FDI inflows. Finally, even if in previous literature, corruption is considered as the main relevant problem of Romania for attracting FDI, in our model it is confirmed only when focusing on this variable as a consequence of our limitations coming from analyzing the FDI inflows to one country during short amount of time. We can conclude with the importance of the accession of Romania in the European Union as beneficial for its foreign direct investment inflows.. 28.
(30) 6. Annex In the following table we can observe the data used to obtain the econometric regression model. Country N_Africa. Id. year fdi 1 2003. N_Africa N_Africa N_Africa N_Africa N_Africa N_Africa N_Africa N_Africa N_Africa Japan Japan Japan Japan Japan Japan Japan Japan Japan Japan USA USA USA USA USA USA USA USA USA USA Canada. 1 1 1 1 1 1 1 1 1 2 2 2 2 2 2 2 2 2 2 3 3 3 3 3 3 3 3 3 3 4. 2004 2005 2006 2007 2008 2009 2010 2011 2012 2003 2004 2005 2006 2007 2008 2009 2010 2011 2012 2003 2004 2005 2006 2007 2008 2009 2010 2011 2012 2003. Canada Canada Canada Canada Canada Canada. 4 4 4 4 4 4. 2004 2005 2006 2007 2008 2009. 9 17 22 40 11 19 9 3 7 8 31 25 28 37 42 34 95 155 183 176 324 650 567 627 595 861 1052 1356 1418 1802 76. GDP_F export import GDP_D CPI 305015.8 255656.925 55208.87 52931 381366.5 445052.2 520768.0 674695.5 891263.0 801001.3 867779.5 948671.6 971472.6 4860980.6 5783631.1 5683350.3 5467122.6 5961881.8 7096714.5 7002003.9 7280586.9 8214815.7 7651599.8 10175654 9868076.2 10524636 11035282 10563736 10007207 10337468 11287923 11147917 12580324 1966528.1. 404063.1677 483346.1213 596284.5275 701764.1713 984088.5409 958142.2751 1007727.438 1565810.419 1973856.374 17795.51514 59323.47826 98205.61909 129389.5093 158765.8547 171947.0803 155986.6778 247088.5003 330541.2157 351151.6063 699323.9268 829072.6957 1520595.624 1132179.822 1106266.553 1227084.692 661540.954 972463.1691 1544297.148 1414861 56238.25124. 118 2140106.6 92038.40994 88 2122006.6 119848.5331 210 2116308.0 93778.54185 256 2296377.8 76415.65622 217 2565420.8 94415.80565 125 2484552.1 42628.04895. 91595.04 129990.6 231170.5 208227.7 331501.2 237432 209815.2 303687.4 336740.8 336285.4 545307.5 725911.1 828062.5 581988.7 647923.7 361684.6 388501.3 502419.1 430638.6 625858.7 1161295 842618.2 1883315 1494286 2172920 959954.3 994179.8 1242009 1344496 139846.3. dummy_eu 2.8 0. 61404 80225.6 98418.6 125403.4 142396.3 120409.2 126746.4 133305.9 133806.1 52931 61404 80225.6 98418.6 125403.4 142396.3 120409.2 126746.4 133305.9 133806.1 52931 61404 80225.6 98418.6 125403.4 142396.3 120409.2 126746.4 133305.9 133806.1 52931. 2.9 3 3.1 3.7 3.8 3.8 3.7 3.6 4.4 2.8 2.9 3 3.1 3.7 3.8 3.8 3.7 3.6 4.4 2.8 2.9 3 3.1 3.7 3.8 3.8 3.7 3.6 4.4 2.8. 0 0 0 0 0 0 0 0 0 0 0 0 0 0 0 0 0 0 0 0 0 0 0 0 0 0 0 0 0 0. 218865 61404 240871.4 80225.6 323487.6 98418.6 212906.2 125403.4 414759.5 142396.3 158415.2 120409.2. 2.9 3 3.1 3.7 3.8 3.8. 0 0 0 0 0 0 29.
(31) Canada Canada Canada EU. 4 4 4 5. 208 2269975.4 163447.0456 177119.8 126746.4 2010 256 2435352.2 285872.4023 227052.6 133305.9 2011 75 2352856.2 186939.3472 119846.3 133806.1 2012 2003 * 16108 10489822 15160030.72 18519761 52931. 3.7 3.6 4.4 2.8. 0 0 0 1. EU EU EU EU EU EU EU EU. 5 5 5 5 5 5 5 5. 2004 * 16958 2005 17853 2006 29724 2007 36621 2008 42318 2009 44316 2010 46361 2011 48709. 11015562 11502133 12168082 12900957 12986408 12245901 12789849 13173450. 22106303.94 26827504 24576911.49 842618.2 28850911.11 1883315 39917495.46 1494286 49723964.64 2172920 42239810.79 959954.3 47306184.94 994179.8 62262323.63 1242009. 61404 80225.6 98418.6 125403.4 142396.3 120409.2 126746.4 133305.9. 2.9 3 3.1 3.7 3.8 3.8 3.7 3.6. 1 1 1 1 1 1 1 1. EU Russia Russia Russia Russia Russia Russia Russia Russia Russia Russia Swiss Swiss Swiss Swiss Swiss Swiss Swiss Swiss Swiss Swiss. 5 6 6 6 6 6 6 6 6 6 6 7 7 7 7 7 7 7 7 7 7. 2012 52199 2003 * 0.978 2 2004 7 2005 4 2006 35 2007 72 2008 17 2009 46 2010 13 2011 79 2012 320 2003 446 2004 1556 2005 2371 2006 2191 2007 2277 2008 2111 2009 2032 2010 1837 2011 2185 2012. 13420179 486092.4 734381.4 949408.3 1242228.6 1778709.5 2430624.9 1700243.4 2020290.1 2649589.7 2589506.6 311606.0 316990 327755.2 342123.1 348864.9 376326.4 388781.9 439140.5 501642.7 518204.8. 52466054.06 58942.46498 150243.3168 286738.4883 469427.6823 797585.0281 1313776.16 996090.502 1453012.917 1971124.871 1736446.209 120265.0474 176207.0683 232042.0686 247822.2613 418383.2626 646595.3315 490402.6839 460154.3455 580915.9688 457873.9142. 133806.1 52931 61404 80225.6 98418.6 125403.4 142396.3 120409.2 126746.4 133305.9 133806.1 52931 61404 80225.6 98418.6 125403.4 142396.3 120409.2 126746.4 133305.9 133806.1. 4.4 2.8 2.9 3 3.1 3.7 3.8 3.8 3.7 3.6 4.4 2.8 2.9 3 3.1 3.7 3.8 3.8 3.7 3.6 4.4. 1 0 0 0 0 0 0 0 0 0 0 1 1 1 1 1 1 1 1 1 1. 1344496 2238380 2769449 4149941 5047075 6045134 7244690 2912801 3578771 4071350 3946066 244425.2 405712.7 502881.5 666228.4 673815.7 882234 687580.5 773337.4 799484 771580.9. Approximations made as consequence of no data: Calculation of FDI for the countries with no data for some years First we calculate the growth of GDP in those specific years in which we have no data for fdi to be able to use that growth of GDP from t2 to t1 as an approximation for FDI.. 30.
(32) 𝑔𝑡2−𝑡1 =. 𝐺𝐷𝑃𝑡2 −𝐺𝐷𝑃𝑡1 𝐺𝐷𝑃𝑡1. Because of no enough data for fdi of the European Union to Romania for 2003 and 2004 we approximate these values by taking into account the relationship of GDP of a country with FDI. Therefore, as said before, we use the growth of GDP, in this case the EU’s GDP growth from 2003 to 2004 as an approximation of how FDI could have been. In the following picture we observe the calculation in Excel: *fdi of EU year. GDP of EU. fdi of EU. 2003. 10489822.3 No data. 2004. 11015561.6 No data. 2005. 11502133.1 17853. Calculation of Growth of GDP. of. EU:. g. 0.05011899 Calculation of 2003 and 2004 FDI using the growth of European Union's GDP as an approximation EU FDI 2003. 16108.29653. EU FDI 2004. 16958.22567. *fdi of Russia year. GDP of Russia. fdi of Russia. 2003. 486092.4 No data. 2004. 734381.4 2. Calculation of growth of GDP of Russia: g. 0.510785508 Calculation of 2003 FDI using the growth of Russia's GDP as an approximation. for FDI values in this year: Russia FDI 2003. 0.978428983 31.
(33) 7. References Amarandei C. M., 2013. Corruption and Foreign Direct Investment. Evidence from Central and Eastern European States, Alexandru Ioan Cuza University of Iasi, Romania, CES Working Papers Volume 5, Issue 3. Anderson, J.E. 1979, A Theoretical Foundation for the Gravity Equation, American Economic Review, Volume 63, pages 106-116 Andrei D-M., 2012. Foreign Direct Investment in Romania. A structural and dynamic view, The Romanian Journal of Economic Forecasting, 4/2012. Ben-Ner A., Montias M. J., The Introduction of Markets in a Hypercentralized Economy: The Case of Romania. Journal of Economic Perspectives, Volume 5, Number 4, Fall 1991, Pages 163–170. Benassy-Quere A., Coupet M., Mayer T., 2007. Institutional Determinants of Foreign Direct Investment. The World Economy Botric V., Škuflic L. 2006, Main Determinants of Foreign Direct Investment in the Southeast European Countries, Transition Studies Review (2006) 13 (2): 359–377 DOI 10.1007/s11300-006-0110-3. Commission of the European Communities, 2007. Report from the Commission to the European Parliament and the Council on Romania's progress on accompanying measures following Accession. Brussels: COM Fallon G., Cook M., Bilimoria A., 2001. What factors attract Foreign Direct Investment?, Teaching Business & Economics Volume 5, Number 3. Georgescu, P., Stanescu, C., 1972. Rumanía. Bucarest: Meridiane. Bucarest. Gheorghe Z., Vasile V., 2012. Macroeconomic impact of FDI in Romania, Procedia Economics and Finance 3, 2012, Pages 3-11. Ghibutiu A., 2013. Foreign Direct Investments in Romania: Evolution and the Challenges Ahead, Knowledge Horizons – Economics Volume 5, No. 3, pp. 14–18, 2013 Pro Universitaria Görg H., Jabbour L., 2009. Multinational Enterprises and Foreign Direct Investment, Kiel Institute for the World Economy and Christian-Albrechts University, Kiel, and GEP, University of Nottingham, The World Economy, The Authors Journal compilation Blackwell Publishing Ltd. Haksoon K., 2010. Political Stability and Foreign Direct Investment, International Journal of Economics and Finance Volume 2, No. 3; [online] Available at: www.ccsenet.org/ijef Ioan G., Ioan C., 2013. Romania's Financial Market and Foreign Trade Impaction, Oeconomica, No.3 Volume 9, Danubius, University of Galati.. 32.
(34) Index of Economic Freedom, 2015. The Heritage Foundation [online] Available at: http://www.heritage.org/index/ranking Janicki H. P., Wunnava P. V., 2004, Determinants of foreign direct investment: empirical evidence from EU accession candidates, Applied Economics, Volume 36, Pages 505– 509, Taylor & Francis Group. Jun K. W., Singh H., 1996. The determinants of Foreign Direct Investment in developing countries. Transnational corporations. United Nations Publ, ISSN 1014-9562, ZDB-ID 11271590. Volume 5.Number 2, pages 67-106. Khadaroo A. J., Seetanah B. 2010, Transport Infrastructure and Foreign Direct Investment, Journal of International Development J. Int. Dev. 22, 103–123 (2010) [online] Available at: www.interscience.wiley.com DOI: 10.1002/jid.1506 M. Peter van der Hoek, 2007. Romania and European Union Membership, Munich Personal RePEc Archive, MPRA Paper No. 5877 [online] Available at http://mpra.ub.unimuenchen.de/5877/ Marcu S., 2005. Rumanía: territorio olvidado: procesos de transición e integración 19892005. Valladolid: Universidad de Valladolid. Mohamed S. E, Sidiropoulos M. G., 2010. Another look at the determinants of Foreign Direct Investment in Mena Countries: An Empirical Investigation, Journal of Economic Development, Volume 35, Number 2. Nistor P., 2014. FDI and the Legal Framework in Romania, Studia Universitatis Petru Maior, Series Oeconomica, Fasciculus 1, anul VII, 2014, ISSN 1843-1127. Parean M.O., Vadasean I., 2012. Romania’s economy after the European Union accession, West University of Timisoara. Quazi R. M., 2014. Corruption and Foreign Direct Investment in East Asia and South Asia: An Econometric Study. International Journal of Economics and Financial Issues Volume 4, No. 2, 2014, pp.231-242 ISSN: 2146-4138 online Available at: www.econjournals.com Raff H., Ryan M., Stähler F., 2012. Firm Productivity and the Foreign-Market Entry Decision, Journal of Economics & Management Strategy, Volume 21, Number 3, Fall 2012, 849–871. Savoiu G., Popa S., 2012. Econometric Eclectic Models of Foreign Direct Investments in Romania, after 1990, Economics and Finance Review Volume 1(12) pages 30 – 41, February, 2012 ISSN: 2047-0401 [online] Available at http://www.businessjournalz.org/efr Sova R., Albu L.L., Stancu I., Sova A. 2009, Patterns of Foreign Direct Investment in the new EU Countries, Romanian Journal of Economic Forecasting. Talamo G. M. C., 2007, Institutions, FDI and the Gravity Model, Università di Palermo 33.
(35) Tinbergen J.,1966. Shaping the World Economy: Suggestions for an International Economic Policy. The Economic Journal, Volume 76, Number 301, pages 92-95. United Nations Conference on Trade and Development, 2014. UNCTAD, World Investment Report 2014. Investing in the SDG’s: An Action Plan Vasilescu G. L., 2007. Foreign Direct Investment: Recent Trends, University of Craiova. Wolff G. B, 2006. Foreign direct investment in the enlarged EU: do taxes matter and to what extent? Deutsche Bundesbank. Zgribut A., Olaru E., 2011. Problema absorbtiei fondurilor europene in Romania, Scoala Nationala de Studii Politice si Administrative. [online] Available at http://www.academia.edu/1326049/PROBLEMA_ABSORB%C8%9AIEI_FONDURILOR _EUROPENE_%C3%8EN_ROM%C3%82NIA. 34.
(36)
Figure
Documento similar
