Economic financial analysis of SEAT, S A
76
0
0
Texto completo
(2) INDEX ABSTRACT .................................................................................................................. 3 1.. INTRODUCTION. .................................................................................................. 4 1.1. 2. Objectives and methodology........................................................................... 5. ANALYSIS OF THE COMPANY ............................................................................ 6 2.1. History of SEAT, SA. ...................................................................................... 6. 2.2. Equity analysis ................................................................................................ 7. 2.2.1. Balance sheet .......................................................................................... 7. 2.2.2. Asset Balance........................................................................................ 14. 2.2.3. Income Statement ................................................................................. 14. 2.2.4. Cash Flow Statement ............................................................................ 19. 2.3. Liquidity analysis .......................................................................................... 20. 2.3.1. Short – Term Liquidity............................................................................ 20. 2.3.2. Long – Term Liquidity ............................................................................ 22. 2.3.3. Average Period of Maturation ................................................................ 26. 2.4. Analysis of the profitability of company ......................................................... 27. 2.4.1. Economic Profitability ............................................................................ 27. 2.4.2. Financial Profitability .............................................................................. 30. 3. COMPETITIVE ANALYSIS .................................................................................. 33. 4. SECTOR ANALYSIS ........................................................................................... 43. 5. DAFO .................................................................................................................. 45. 6. CONCLUSIONS .................................................................................................. 47. 7. BIBLIOGRAPHY ..................................................... ¡Error! Marcador no definido.. ANNEX ....................................................................................................................... 50. 2.
(3) ABSTRACT The realization of this project is aimed at the study economic-financial aspects of the company in the automotive sector in Spain, SEAT, SA during the 2011-2015 period, based on the financial statements of the company. As a result of this analysis we have managed to justify and make a series of conclusions as are: the evolution of the turnover coinciding with the improvement of the economic cycle, the losses sustained the first four exercises analyzed which have been borne by the company thanks to the funding of the group to which it belongs, the important reduction of maturation period of economic, full funding of the cycle of exploitation on the part of suppliers and the important cash generation with the exploitation.. 3.
(4) 1. INTRODUCTION. The economic and financial analysis is an aspect of real importance in the era we find ourselves. The growing complexity of business management requires that it is judged on the basis of this analysis (Cuervo, 1986). Llorente (2010) added that the objective of this analysis is to provide information on the financial situation of the company, its outcome and the cash flows generated by it. This will help the corporate finance to offer and explain the methods and tools to determine whether the decisions of a company created or no value. Domínguez and Seco (2010) point out that "accounting provides us with a very useful information to learn about the situation of the company to the economic-financial and patrimonial" (p.3). However, they also add that may not be sufficient accounting information as it is expressed for more information on the situation of the company, but that there is that perform other calculations and analysis that take the accounting as a point of departure. For the achievement of this objective, it will be essential to the realization of an economic and financial analysis based financing in the development of certain ratios, such as profitability or liquidity, consequential on the use of a methodology of accounting and financial. This, will give us the power to know and evaluate the trend and behavior of the company to be able to lead the taking of recommendations economic for the short-term future. Currently, in a period of recovery of economic crisis, this analysis will allow us to know the status of the company during the period required. We know its strengths and weaknesses so as to optimize them and make it more profitable and to maintain its stable activity or even increase it. Thus, the objective of this work is to find out the patrimonial situation that presents the COMPANY SEAT, S.A. in the recent period of 2011-2015, diagnose your financial situation and compare it with its main competitors in the automobile sector in Spanish territory. The choice of the company SEAT, S.A. has been for several reasons. As a company founded in Spain, which has grown over the years to arrive at the international level and be the target of investments and acquisitions of other automobile companies as is the case of Volkswagen, S.A. important for another reason is the automobile sector in Spain, which has a great boom at the global level, Spain being the 9 in world rankings of. 4.
(5) producers of cars. For these reasons you sum the interest and curiosity that generates the SEAT brand, S.A., brand motorist very popular in our territory. Finally, for the choice of competitors, we have selected three companies operating in Spain automotive sector, so to have a broader view of the sector and not to be rendered the comparison to a single company. The selected companies are FORD, S.L., CITROEN, S.A. and PEUGEOT, S.A., the three regimes in Spain.. 1.1. Objectives and methodology. The objective of this project is to analyze the patrimonial, economic and financial situation, of SEAT, S.A. company to issue a judgment on the past and present status of the company and to facilitate the taken of decisions to the interest groups. The period chosen for this study consists of five financial periods, from the year 2011 until 2015. For its achievement, we will use the traditional method of analysis and interpretation of the financial statements included in the annual statements. Thus, information has been obtained both internal and external to make an analysis of these two areas. We will review its position in the sector of engine to then carry out the analysis of its financial statements. It has also been carried out a traditional analysis through ratios highlighting those that we consider most relevant. And finally, we will finish the study with an overall comparison of the most important aspects of this analysis of SEAT, S.A. in relation to its major competitors. For obtaining of the economic and financial information required the Database SABI has been used, from where it the Balance Sheet and the Income Statement of SEAT, SA have been obtained. in addition to other information such as the accounts of the main competitors of SEAT, SA chosen for this analysis. Within this same database, we have obtained different data to the accounts, data that have being given us information throughout the development of the project.. 5.
(6) 2 ANALYSIS OF THE COMPANY 2.1. History of SEAT, SA.. The car company was founded on May 9, 1950 as Spanish Society of Motorcars of Tourism (SEAT) with the objective to motorize Spain. It should be noted that at this time in the country there was a car for every three thousand inhabitants since at this time the car was considered an object of luxury. Three years later, in 1953, the first plant was inaugurated in the Franca Zone of Barcelona, where the first car SEAT was developed and made. In 1964 the company fixed and inaugurated a new head office in Madrid. Two years later, in 1965, the first symbolic exports, were stood out as several planes were loaded with SEAT models to Colombia. In 1970 the Technical Center of Martorell began its activities with high quantities of production, which did not conceive its first car until 1975. During this decade, exactly in the year 1974, SEAT, thanks to its high sales, turned into the eighth manufacturer of cars in Europe. In 1982, SEAT signs several agreements of industrial and commercial cooperation with Volkswagen and four years later, in June Volkswagen bought 51 % of the actions of the Spanish company, reaching this participation 75 % at the end of year. Once entered in the decade of the 90’s, Volkswagen acquired 99% of the shares of SEAT. Therefore in 1991 SEAT presented the first model of car developed within the Volkswagen Group.. 6.
(7) 2.2. Equity analysis. To understand the economic and financial situation of the companies and their evolution during a certain period of time, we will make a equity analysis. Their study will be comprised of a vertical analysis and one horizontal, both the balance sheet and the profit and loss account of the company SEAT, S.A. and it will involve a period of 5 years, from 2011 until 2016. The data for this analysis have been extracted from the SABI database. Thus, with this analysis we can prosper the business management and take those most appropriate decisions for the future of the company and the scope of its main objectives.. 2.2.1 Balance sheet The study of the balance sheet will allow us to determine how the elements of the business structure are divided and movements that occur in the company over time. Then, for its achievement we will look at the structure of the main economic masses (vertical analysis) in order to know what the composition of the company and what items have a greater importance within the balance sheet. On the other hand, with the analysis of the evolution (horizontal analysis), we obtain the variations that have been studied in the masses from one year to another. Next, before you start with the analysis of the balance sheet, we show the Balance sheet of the company and its vertical and horizontal analysis to then analyse it carefully using graphics.. 7.
(8) Table 1: Balance sheet SEAT, S.A. Assets. 2015. 2014. 2013. 2012. 2011. 2.939. 2.949. 3.252. 3.390. 3.094. I Intangible assets. 647. 572. 639. 740. 576. II Tangible assets. 967. 1.003. 1.128. 1.118. 1.010. III Real state investments. n.a.. n.a.. n.a.. n.a.. n.a.. 963. 963. 1.122. 1.114. 1.106. A) Non current assets. IV Long term investments in associated and affiliated companies V Long Term Financial Investments. 2. 2. 2. 2. 2. VI Assets by deferred taxes. 360. 410. 362. 416. 401. VII Non current commercial debts. n.a.. n.a.. n.a.. n.a.. n.a. 1.037. B) C urrent assets. 1.061. 882. 807. 952. I Non-current assets maintained for sale. n.a.. n.a.. n.a.. n.a.. 1. II Stocks. 362. 366. 280. 332. 365. III Trade Debtors and other receivable accounts. 662. 498. 492. 545. 554. 35. 16. 34. 75. 117. IV Short term investments in associated and affiliated companies V Short Term Financial Investments. n.a.. n.a.. n.a.. n.a.. n.a.. VI Short term periodifications. 2. 2. 2. 0. n.a.. VII C ash and equivalents. 0. n.a.. n.a.. 0. n.a.. 4.000. 3.831. 4.059. 4.342. 4.131. A) Net worth. 536. 533. 492. 643. 672. A-1) Equity. 526. 520. 478. 627. 656. 0. 0. 0. 0. 0. 1.008. 1.008. 1.008. 1.008. 1.008 n.a.. Total assets (A + B). Liabilities. I C apital II Issue premium III Reserves. 108. 108. n.a.. n.a.. IV (Net worth own shares and participations). n.a.. n.a.. n.a.. n.a.. n.a.. -596. -530. -382. -352. -290. n.a.. n.a.. n.a.. n.a.. n.a.. 6. -66. -149. -30. -62. VIII (Interim dividend). n.a.. n.a.. n.a.. n.a.. n.a.. IX Other net worth instruments. n.a.. n.a.. n.a.. n.a.. n.a.. A-2) Value changes adjustments. n.a.. n.a.. n.a.. n.a.. n.a.. 10. 13. 14. 16. 16. B) Non current liabilities. 391. 384. 295. 297. 322. I Long term provisions. 266. 257. 189. 180. 195. 87. 98. 84. 89. 93. n.a.. n.a.. 1. 2. 3. IV Liabilities by deferred taxes. 11. 12. 12. 24. 30. V Short term periodifications. 28. 17. 8. 3. 1. VI Non current trade creditors. n.a.. n.a.. n.a.. n.a.. n.a.. VII Long term debts with special characteristics. n.a.. n.a.. n.a.. n.a.. n.a.. 3.072. 2.914. 3.273. 3.403. 3.138. n.a.. n.a.. n.a.. n.a.. n.a.. 799. 692. 653. 588. 595. 60. 73. 67. 45. 55. 522. 775. 1.311. 1.350. 1.052. 1.672. 1.359. 1.210. 1.385. 1.417. 20. 15. 33. 35. 19. n.a.. n.a.. n.a.. n.a.. n.a.. 4.000. 3.831. 4.059. 4.342. 4.131. V Results from previous years VI Other loans from partners VII Exercise Result. A-3) Received legacies, grants and subventions. II Long term debts III Long term debts with associated and affiliated companies. C ) C urrent liabilities I Liabilities related with non-current assets maintained for sale II Short term provisions III Short term debts IV Short term debts with associated and affiliated companies V Trade creditors and other payable accounts VI Short term periodifications VII Short term debts with special characteristics Total net worth and liabilities (A + B + C ). Source: SABI database 8.
(9) Table 2: Structure of the patrimonial masses of the Balance sheet.. Non-Current Assets Current Assets Total Assets Net Equity Non-Current Liability Current Liability Equity and Liabilities. 2015. 2014. 2013. 2012. 2011. 73,48% 26,52% 100,00% 13,40% 9,78% 76,82% 100,00%. 76,98% 23,02% 100,00% 13,92% 10,01% 76,06% 100,00%. 80,11% 19,89% 100,00% 12,11% 7,27% 80,62% 100,00%. 78,07% 21,93% 100,00% 14,80% 6,84% 78,36% 100,00%. 74,90% 25,10% 100,00% 16,26% 7,79% 75,95% 100,00%. Source: Own elaboration. Table 3: Evolution of the patrimonial masses of the Balance sheet.. Non-Current Assets Current Assets Total Assets Net Equity Non-Current Liability Current Liability Equity and Liabilities. 2015. 2014. 2013. 2012. 2011. -0,35% 20,29% 4,40% 0,49% 1,98% 5,44% 4,40%. -9,30% 9,21% -5,62% 8,52% 36,23% -10,96% -5,62%. -4,08% -15,20% -6,52% -23,50% -0,67% -3,82% -6,52%. 9,56% -8,20% 5,10% -4,36% -7,71% 8,44% 5,10%. -0,39% 39,83% 7,36% -8,72% -3,04% 12,86% 7,36%. Source: Own elaboration. For its analysis we do so separately or, to put it another way, by equity, i.e. we first analyze the asset and then the liability and equity.. -. ASSETS.. Next, we find two graphs where we exhibit the structure of the Assets during the period of five years and the interannual evolution.. 9.
(10) Chart 1: Structure of the asset.. Source: Own elaboration. Chart 2: Interannual evolution of the asset.. Source: Own elaboration. •. Non-current asset (ANC): as for the structure, this mass symbolizes between 70% and 80% of the total assets. This is a consequence mainly for two reasons:. o For property, plant and equipment, which represents a percentage higher than 24% during the entire period, due to its business since it is an industrial company. Also, in an average of 15% intangible fixed assets provides your grain of sand through development and other intangibles with figures of around 600 million euros over the period. o. And by investments in group and associated companies in the long term, which represent about 26% during the various years. As it has been 10.
(11) commented above, the company SEAT, S.A. is fully linked to the car company Volkswagen and this makes their investments take great importance within the balance sheet of SEAT, S.A. If we look at the evolution of the non-current asset the largest rise was recorded in the year 2012, where the ANC had a growth of 9.56% that was caused by the increase in tangible fixed assets and intangible with ascents of 28.32. % and 10.77% respectively, compared to the previous year (2011). Conversely, the greatest drop was recorded two years later, in 2014 with a negative percentage of 9.30% caused mainly by a decline of investments in Group companies. •. Current assets (AC): The current asset symbolizes between 20 and 25 per cent of the total assets of the company SEAT, S.A. This mass is mainly represented by two items, which are stocks and trade debtors and other receivable accounts. The stocks represent an average of 8 per cent during the period studied and are highlighted by the values of the finished products that provide the company with an average of 160 million euros per year studied. If we look at the trade debtors, these represent an average of 13 per cent throughout the period and are symbolized by the high percentage of customers of group and associated companies, which comes to refer to what I previously said, the Volkswagen Group. In the latter, it should be noted that 2015 is the year with more significance for the entire period, it was 60.36% compared to the previous year. Regarding the evolution, the current asset suffered a sharp drop in the year 2013, as a result of decreases in the most significant items analyzed above, stocks and trade debtors. After this fall, SEAT, S.A. was recovering the two following years to reach 2015 with a growth of 20.29% with respect to the previous year. In this growth, it should be noted that investments in group and associated companies in the short term have increased by more than 100 per cent and that trade debtors have also registered a growth of 30%. Thus, in the chart we can visualize how current assets to have registered more violent changes than in the case of non-current assets.. 11.
(12) -. EQUITY AND LIABILITIES Chart 3: Structure of the equity and liabilities.. Source: Own elaboration. Chart 4: Interannual evolution of the equity and liabilities.. Source: Own elaboration. The financial structure of the company is represented by an equity that exceeds 12%, non-current liabilities not exceeding 11% and current liabilities of great significance which is located around 77%. With a first insight into the balance sheet we will have observed how own funds have very low representation not being higher than 16% and on the other hand, a great representation of the departure of trade creditors and other payables. 12.
(13) amount, with a representation of the average of 34% over the period. This will take us to infer that the company has a high level of debt, which we'll discuss later. In the Equity of SEAT, S.A. we have the departure of own funds which, as we have said before, is of very low significance which informs us it has a low capitalization. This is due to the fact that during the whole period has registered some negative results of previous years quite significant, that roam the loss around the 450 million euros. Its evolution is moderate, despite the year 2013, which had a decrease of 23.5 per cent over the previous year. This is due to the negative results recorded, which, although they are negative in most of the studied years, in 2013 it fell dramatically. If we look at the chart of the structure, the non-current liabilities represent only 10% of the total of the financial structure. Long term debts are almost void with percentages ranging over 2% and its provisions represent just an average of 5%. If we look at the evolution, it is also fairly constant despite the year 2014, where we found an increase of 36% over the previous year and this is due to its accruals long-term periods increased by more than 100%. With regard to current liabilities, if we look at the balance sheet, we note that the items with more volume are the debts with group and associated companies in the short term (the Volkswagen group) with an average of 24.5% and trade creditors and accounts payable with a significance of around 34.5%. We have, therefore, that the financial structure of the company is based in external financing and much of this comes from the group and associated companies. This situation reflects an extraordinarily high imbalance between the current assets and current liabilities, generating undoubtedly future problems to meet the debts in the short term, where the only positive aspect is that in their majority they are with group and associated companies and therefore, we hypothesized that its renewal may be planned by the own automotive group. This, as we shall see below, has led to a fund for maneuver negative in all the years of the period. With regard to its evolution which remains relatively constant, we can see small alterations but they do not have great impact on the overall financial structure.. 13.
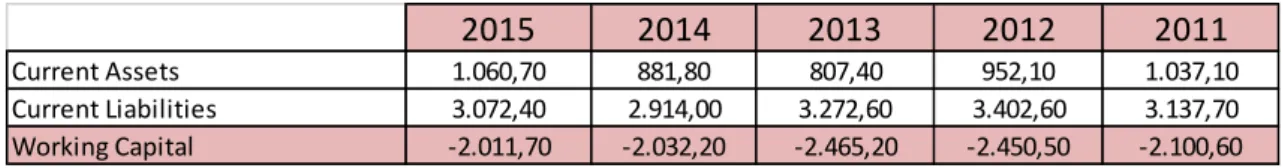
(14) 2.2.2 Asset Balance.. As we have previously said, the balance of SEAT, S.A. presents a working capital negative, i.e., the company counts with an imbalance asset. The current liabilities represent more than double the current assets in all years, which make the background of maneuver be an average of 2,200 million euros per year. During the last two years of the period, in 2015 and 2014, the working capital is decreasing compared to previous years, this is mainly due to the increase of current assets. Normally when you get a negative working capital it is the result that the current liabilities funded at current asset and also part of the not current assets, the other part of the noncurrent assets is financed with permanent resources. Table 4: Breakdown working capital.. Current Assets Current Liabilities Working Capital. 2015. 2014. 2013. 2012. 2011. 1.060,70 3.072,40 -2.011,70. 881,80 2.914,00 -2.032,20. 807,40 3.272,60 -2.465,20. 952,10 3.402,60 -2.450,50. 1.037,10 3.137,70 -2.100,60. Source: Own elaboration. Thus, we see how the company SEAT S.A., does not have sufficient funds to be financed. We face a situation of lack of liquidity, which we will discuss later in the study of the financial situation of the company. However, these negative results could be a feature of the company to obtain a higher return on its resources, as in the case of the liquidity. We will see later in the study of profitability that this is not the case.. 2.2.3 Income Statement The study of the profit and loss statement will allow us to know how and where the output is generated, so that this analysis can enable us to ratify the company or put in doubt its present and/or future. It attached great importance because this income statement provides information of the result, which is in most cases, the first element evaluator of a company. Through this account we will know how much you earn and how it wins, that is to say, what its benefits are and where they come from. For its analysis, we will continue the same procedure used previously in the balance. We will study both the structure (vertical analysis) and the evolution (horizontal analysis) to the length of the period.. 14.
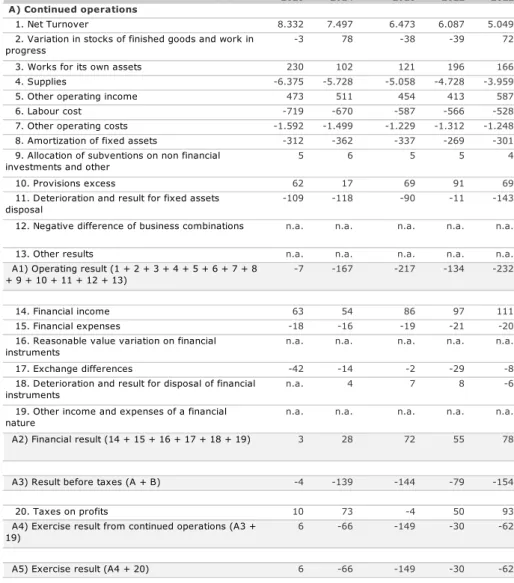
(15) SEAT, S.A. presents the following profit and loss statement during the period 2015 2011:. Table 4: Income Statement SEAT, S.A. Income statement. 2015. 2014. 2013. 2012. 2011. 8.332. 7.497. 6.473. 6.087. 5.049. -3. 78. -38. -39. 72. A) Continued operations 1. Net Turnover 2. Variation in stocks of finished goods and work in progress 3. Works for its own assets 4. Supplies 5. Other operating income 6. Labour cost 7. Other operating costs 8. Amortization of fixed assets 9. Allocation of subventions on non financial investments and other 10. Provisions excess. 230. 102. 121. 196. 166. -6.375. -5.728. -5.058. -4.728. -3.959. 473. 511. 454. 413. 587. -719. -670. -587. -566. -528. -1.592. -1.499. -1.229. -1.312. -1.248. -312. -362. -337. -269. -301. 5. 6. 5. 5. 4. 62. 17. 69. 91. 69. -109. -118. -90. -11. -143. 12. Negative difference of business combinations. n.a.. n.a.. n.a.. n.a.. n.a.. 13. Other results. n.a.. n.a.. n.a.. n.a.. n.a.. -7. -167. -217. -134. -232. 111. 11. Deterioration and result for fixed assets disposal. A1) Operating result (1 + 2 + 3 + 4 + 5 + 6 + 7 + 8 + 9 + 10 + 11 + 12 + 13) 14. Financial income 15. Financial expenses 16. Reasonable value variation on financial instruments 17. Exchange differences. 63. 54. 86. 97. -18. -16. -19. -21. -20. n.a.. n.a.. n.a.. n.a.. n.a.. -42. -14. -2. -29. -8. 18. Deterioration and result for disposal of financial instruments. n.a.. 4. 7. 8. -6. 19. Other income and expenses of a financial nature. n.a.. n.a.. n.a.. n.a.. n.a.. 3. 28. 72. 55. 78. -4. -139. -144. -79. -154. A2) Financial result (14 + 15 + 16 + 17 + 18 + 19). A3) Result before taxes (A + B) 20. Taxes on profits A4) Exercise result from continued operations (A3 + 19) A5) Exercise result (A4 + 20). 10. 73. -4. 50. 93. 6. -66. -149. -30. -62. 6. -66. -149. -30. -62. Source: SABI database.. 15.
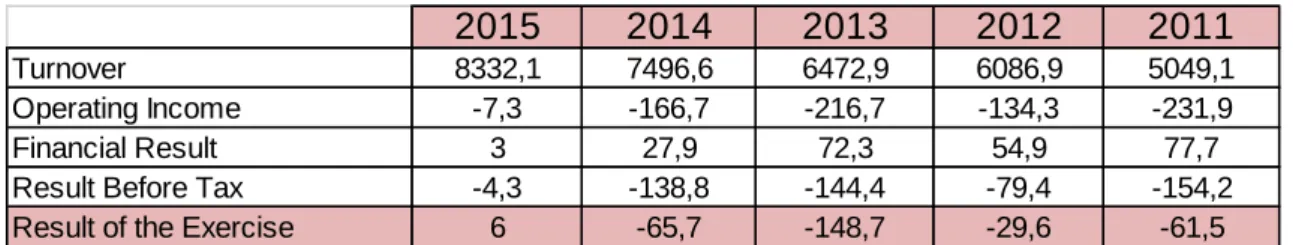
(16) First of all, we are going to summarize the profit and loss statement in the following table, which will guide us in the study onwards. Table 5: Composition of the Income Statement.. Turnover Operating Income Financial Result Result Before Tax Result of the Exercise. 2015. 2014. 2013. 2012. 2011. 8332,1 -7,3 3 -4,3 6. 7496,6 -166,7 27,9 -138,8 -65,7. 6472,9 -216,7 72,3 -144,4 -148,7. 6086,9 -134,3 54,9 -79,4 -29,6. 5049,1 -231,9 77,7 -154,2 -61,5. Source: Own elaboration. The first observation that we must make is the amount of turnover during the period. This is represented by vehicles parts, gearboxes and other sales as for example materials and services. We note that by the step of the years it is steadily growing due to the increase of their sales, passes from 5.049 million Euros in 2011 to reach 8332in 2015. But these figures, as we will see, later on will not be sufficient to cover the operating expenses of the incurred SEAT S.A. As we can see, the operating income where the activities of the company are negative in the five years of the period, although it should be noted that in the last year this negative figure has been reduced considerably to 7 million euros compared to the 167 of the previous year. As we have previously announced, this is because the operating cost of the company are superior to their operating income as we will see below. The most significant expenditure headings are supply costs and the costs of external services that together nullify nearly the amount of turnover in all the analyzed exercises. The financial result that we find in the account of this company is positive over the years studied, but in the year 2015 this positive result has been on the decline due to the increase of the foreign exchange differences, thus placing a SEAT S.A. with a financial result of 3 million euros. The only special feature to add in this heading is that financial revenues come in large part by the yields obtained from investments in group and associated companies. Thus, except in the year 2015 where the result of the exercise obtained is positive, with a total of 6 million euros due to the increase of the amount of turnover, the other years all obtained negative results due to what was previously commented.. 16.
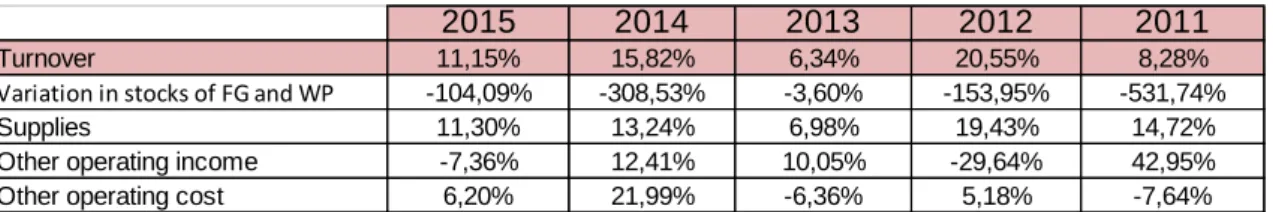
(17) Then, we will show the evolution of those items with more and less significance within the income statement, in addition to its significance with respect to the net amount of the turnover. We will perform the analysis supporting its graphics and tables with the data.. Table 6: Evolution items significant Income Statement.. Turnover Variation in stocks of FG and WP Supplies Other operating income Other operating cost. 2015. 2014. 2013. 2012. 2011. 11,15% -104,09% 11,30% -7,36% 6,20%. 15,82% -308,53% 13,24% 12,41% 21,99%. 6,34% -3,60% 6,98% 10,05% -6,36%. 20,55% -153,95% 19,43% -29,64% 5,18%. 8,28% -531,74% 14,72% 42,95% -7,64%. Source: Own elaboration. Chart 5: Evolution items significant Income Statement.. Source: Own elaboration.. Table 7: Significance on the amount of turnover.. Turnover Variation in stocks of FG and WP Supplies Other operating income Other operating cost. 2015. 2014. 2013. 2012. 2011. 100,00% -0,04% -76,51% 5,68% -19,11%. 100,00% 1,04% -76,41% 6,81% -20,00%. 100,00% -0,58% -78,15% 7,02% -18,99%. 100,00% -0,64% -77,68% 6,78% -21,56%. 100,00% 1,43% -78,41% 11,62% -24,71%. Source: Own elaboration.. 17.
(18) Chart 6: Significance on the amount of turnover.. Source: Own elaboration. As we have previously seen, items with more or less significance within the account are those that appear in both charts. Most significant developments can be found in the change in stocks of finished products and work in progress where it grows, but without getting to obtain positive percentages. However, it is the less significant in relation to the turnover and this is due to SEAT, S.A. avoiding to have products both completed and in progress in this, given the high costs of storage. The evolution of the other selected items is relatively constant, without major changes that will allow us to reach conclusions in its evolution more than the stability of the same. Now, we are going to discuss items of greater specific weight within the statement of income, which are those that consume most of the net amount of the turnover. The most significant item is the supplies, which represent the majority of the turnover with percentages that evolve from 78.4% in 2011 to 76.5% in 2015. This is due to the fact that the car company purchases the raw materials and the rest of the parts required for the construction of vehicles to third parties. Other operating expenses, representing around 20% of the turnover where the fundamental part of the same comes from the departure of foreign services. And finally, we have also called attention to the heading of other operating income, with less relevance than the previous ones but they help to override the expenses and that is represented with a percentage that ranges over 7.5% 18.
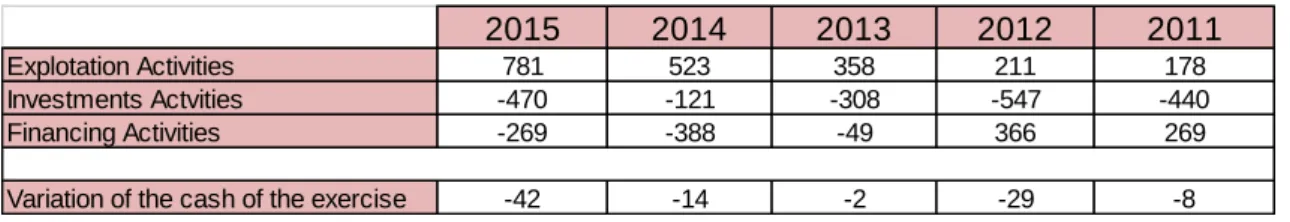
(19) 2.2.4 Cash Flow Statement. To finish the analysis of the company, we are going to perform the analysis of the cash flows statement of its three large masses, which are the treasury movements of exploitation activities, by investment activities and by financing activities. Thus, this analysis will provide us information on cash movements produced differently. Then we are going to offer a table detailing the three most important flows mentioned above during the period of five years also studied the variation of cash in the exercise of the same. Table 8: Summary Results of cash flows statement. 2015. 2014. 2013. 2012. 2011. Explotation Activities Investments Actvities Financing Activities. 781 -470 -269. 523 -121 -388. 358 -308 -49. 211 -547 366. 178 -440 269. Variation of the cash of the exercise. -42. -14. -2. -29. -8. Source: Own elaboration. Chart 7: Evolution of Results of cash flows statement.. Source: Own elaboration.. If we look first in the cash flows from operating activities we see as have been positive in all the exercises analyzed, where the growth of the same is continuous throughout the period. The figures of this flow have gone from 178 million euros in 2011 to 781 million in 2015. It is of great importance for the generality of the companies that the exploitation activities of these generate cash with which to be able to undertake investment operation and/or funding. 19.
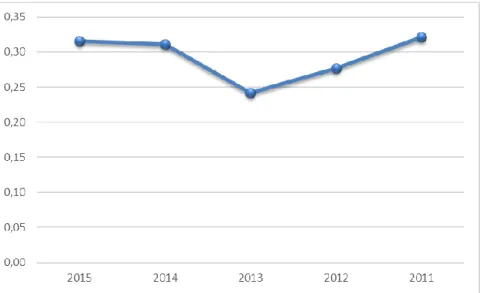
(20) The investment activities have been consumers of cash in all the exercises, with which we assure that the company continues to invest in productive assets and therefore betting on the continuation and improvement in productive activities. As for the fate of this cash, we can see that it was destined to the purchase of tangible and intangible assets. The years with more cash earmarked for investments have been 2013 and 2015. Financing activities in the years 2011 and 2012 we have large sources of funds coinciding with the periods over which the company has generated less cash with the exploitation activities. This gives us that, given the need for liquidity by the low contribution of exploitation activities, the company has decided to come to the external funding to achieve liquidity continue with its pace of investor. If we look at the origins of the financing we note that are the increase in debts with group and associated companies which have made this stream of liquidity. In the last 3 exercises analyzed, from 2013 until 2015, the activities of financing have become consumers of cash corresponding to returns of amounts owed to credit institutions and returns of debt with group and associated companies.. 2.3. Liquidity analysis. Then, we will calculate and develop the effects and essential findings of liquidity. To do this, we will calculate the main ratios of liquidity (short and long-term) according to the criterion of Llorente (2010) to later develop and draw conclusions.. 2.3.1 Short – Term Liquidity. Short-term liquidity ratio With the calculation of this ratio, it will be at our disposal the information of how many short-term assets we have in order to deal with the short-term debts. The value of this ratio should be greater than 1 as the higher this, is the better the liquidity of our company. On the contrary, if the value is less than 1 it will mean that the company has more short-term debts than current assets with which to cope.. 20.
(21) The calculation is performed using the following formula:. Overall Liquidity =. Current Assets Current Liabilities. Chart 8: Graphical representation of the liquidity ratio. Source: Own elaboration It is observed as in all the years, this ratio of liquidity of SEAT, S.A. is less than one. From 2011 to 2013, this ratio will fall to take the value of 0.25 in the latest year. From 2013 a progressive growth begins until the year 2015 it reaches 0.35, being this its greater scope during the studied period. Thus, as we have already quoted above, we checked how SEAT, S.A. is not able to meet their short-term debt because it has more debt than current assets with which to cope. This poses a problem for the company, that companies should have a sufficient liquidity to meet payments in the short term or unforeseen without difficulties.. Acid test ratio Acid test ratio corrects a previous defect of the ratio of liquidity. It is performed in the same way and we provide the same information, but the difference is that it does not take into account the stock levels. Its formula is:. Acid test ratio =. (Current Assets − Stocks) Current Liabilities. Seat, S.A. stocks represent about 30% of the active stream. 21.
(22) Chart 9: Graphic representation of the acid test ratio. Source: Own elaboration.. Again, this ratio provides us with a few lower values to one, which reaffirms what we pointed out above that SEAT, S.A. does not enough have current assets sufficient to deal with the short-term debts of the company. Thus, we conclude that thanks to this liquidity analysis we know that SEAT S.A. has short-term liquidity problems and that the management of the company must review this point to take measures in that regard.. 2.3.2 Long – Term Liquidity We are going to analyze the long-term liquidity, also called solvency, through three ratios: solvency of self-financing and coverage. Thus, when we speak of the liquidity in the long term we are referring to the ability that enterprises have to cope with their long-term debt.. Solvency Ratio This ratio compares all the assets of the company with the current liabilities (current and non-current) of the same (Llorente, 2010) .. 22.
(23) The solvency ratio is presented using:. Solvency =. Total Assets Total Liabilities. This ratio should be at least positive and greater than one. Otherwise, i.e. when the solvency ratio is less than one, it would mean that the company would not have sufficient assets to meet debts with third parties and this would be a confrontation of the company to bankruptcy.. Chart 10: Graphical representation of the solvency ratio. Source: Own elaboration In the first place, as we see all the ratios are higher than one, which means that Seat, S.A. has sufficient assets to meet their debts with third parties. The company had a fall in year 2013, obtaining this year the worst result of all the studied period. Despite this fall, the ratio is positive, specifically the 1.14, i.e. it did not have solvency problems. This was caused by a drop in assets accompanied by the maintenance of the total liabilities. In 2014 it went go back the next year to have another fall back but of less magnitude than 2013. Seat, S.A., in case of liquidating the company, still offers ability to pay its creditors.. Self-financing ratio. This ratio is complementary to the time of borrowing. According to Llorente (2010) selffinancing ratio will make us to know how many of the studied company assets are being financed with own resources. Greater self-financing, proportionally speaking, less debt. 23.
(24) Self − financing =. Equity Total Assets. Table 9: Evolution of the self-financing ratio. Equity Total Assets Autofinanciación. 2015. 2014. 2013. 2012. 2011. 536 4.000 13,40%. 533 3.831 13,92%. 492 4.059 12,11%. 643 4.342 14,80%. 672 4.131 16,26%. Source: Own elaboration In the table we can see the breakdown of the self-financing ratio of SEAT, S.A., where we note that both, the equity as the total assets have an irregular evolution during the period, which will also be self-financing. Below, it shows the evolution of this self-financing in percentages:. Chart 11: Graphical representation of the ratio of self-financing. Source: Own elaboration. The year that more assets were financed by own resources was in 2011 with a 16% and up to the most recent year, i.e. 2015 has not returned to reach this percentage, although it is not far behind with 13% of self-financing. Given that there are not many falls but if the percentages are low, not coming to a quarter, the company SEAT, S.A. should take redefinition in strategy direction to achieve a higher self-financing.. 24.
(25) Coverage ratio. The coverage ratio compares equity in the long term, to put it another way, puts in relation the permanent resources of a company with non-current assets financed by those. When the calculation of this ratio is less than 1, we would be dealing with a company with a revolving negative fund; therefore, it is desirable that its value is greater than 1. For its calculation, we will use the following formula:. Coverage Ratio =. Permanent Resources Non Current Assets. Graphic 12: Graphical representation of the coverage Ratio. Source: Own elaboration According to Llorente (2010) the relationship of this ratio with short-term liquidity lies in the fact that, to be greater than 1, part of permanent resources will be financing shortterm assets. The COMPANY SEAT, S.A. does not exceed the recommendation (coverage greater than 1) so that the company could have serious problems of financing the fixed assets with permanent resources acquired since this ratio so hardly exceeds the 33% coverage.. 25.
(26) 2.3.3 Average Period of Maturation Economic average period of maturation.. The economic average period of maturation will allow us to know the time that it takes the company to recover the invested amount in the purchase of its stock, in other words, this period measures the elapsed time since the company invests a euro in the cycle of exploitation until it regains it via billing of customers. As an industrial company, since SEAT, S.A. develops its own products will have period of storage of raw materials, manufacturing period and period of sale or storage of finished products. As we do not have access to the accounting analytical at SEAT, S.A. does not we can break down the activity of deadlines related to stocks. Thus, we will calculate a single period of storage-manufacturing-sale along with the period of recovery of customers to obtain average period. It should be noted that the economic average period of maturation is an inverse measure of liquidity, so a may term of storage and a longerterm recovery to customers could pose problems in the company at the time of confronting their payments in the short term. Table 10: Economic average period of maturation of SEAT, S.A.. Stock rotation Period of storage/manufacturing/sales Costumers rotation Term of payment to costumers. Economic average period of maturation. 2015. 2014. 2013. 2012. 2011. 17,502 20,855 21,51 16,97 37,82. 17,725 20,593 24,00 15,21 35,80. 16,547 22,059 22,74 16,05 38,11. 13,583 26,873 13,44 27,16 54,03. 10,933 33,384 15,70 23,25 56,64. Source: own elaboration. As we saw in the previous table, the economic average period of maturation of SEAT, S.A. has significantly declined in the last three years of the period, from 54.03 days in 2012 to reach 37.82 in 2015. This is due to the decrease in both on the part of the storage period as a period of recovery to customers. Thus, the company takes less time to recover the amount invested in stocks during these past three years and as we have seen previously, its liquidity is better but even so, 37 days is a number of days high, and although these decrease with the passage of time, the liquidity is not sufficient to cover the debts.. 26.
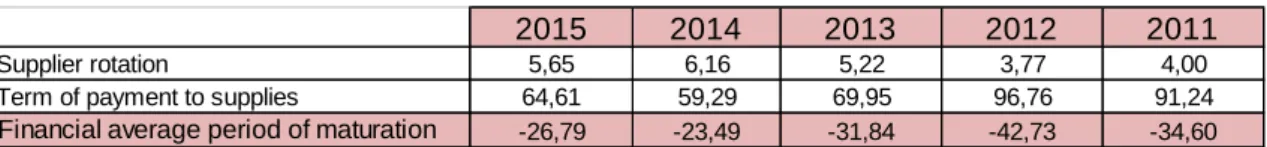
(27) Financial average period of maturation. The financial average period of maturation it is going to show us the days that elapse since the company pays for the purchase of goods until retrieves the investment for the charge to customers. Table 11: Financial average period of maturation of SEAT, S.A.. Supplier rotation Term of payment to supplies. Financial average period of maturation. 2015. 2014. 2013. 2012. 2011. 5,65 64,61 -26,79. 6,16 59,29 -23,49. 5,22 69,95 -31,84. 3,77 96,76 -42,73. 4,00 91,24 -34,60. Source: own elaboration. In the table above we note how the rotation of suppliers increased relative to 2011, standing at that year in 4 until arriving in 2015 to 5.65. This causes the period of payment to suppliers has decreased from 91.24 in 2011 to 64.61 in 2015. With these data, we can conclude that the number of days that elapse since the company pays the purchase of goods until the charged to its customers is in the whole period negative, this fact is relevant, and usually happens when customers pay at the time of receiving the purchase. The financial average period of maturation decreased from -34.60 in 2011 to 26.76 in 2015.. 2.4. Analysis of the profitability of company. Once the structure of the economic-financial states (patrimonial situation) and the liquidity of the company are analyzed, we will diagnose the state of the company by means of the profitability.. 2.4.1 Economic Profitability As a result of the calculation of the economic profitability or invested capital or total assets (ROA), we will obtain the needed information to determine the benefit they provide our company assets without taking into account how those assets are being financed. This profitability is calculated using the following formula:. ROA =. Profit before taxes and financial expenses Average Total Assets 27.
(28) Once applied the formula to the data of our company SEAT, S.A. we obtain the following data:. Table 12: Evolution of the ratio of economic profitability of the total assets. ROA. 2015. 2014. 2013. 2012. 2011. 1,12%. -12,82%. -26,23%. -4,50%. -11,47%. Source: Own elaboration. Since the higher the ROA of the company is, the better is taking advantage of the investment by the company, we realize by looking at the table above that Seat, S.A. does not take advantage of this named investment.. Chart 13: Graphical representation of the economic return on assets (ROA). Source: Own elaboration During the period studied (2011-2015) SEAT, S.A. has some very low ROA coming to be negative in several years. This aspect should be thoroughly analyzed by the direction of the company with the purpose of increasing the profitability in future years. In this analysis of economic profitability, we can further investigate to find out some aspects of the management of the company. Economic profitability can be segregated into its two components of multiplicative:. ROA = margin on sales * asset rotation 28.
(29) Thus, one of the measures that could take the address of the company to increase this profitability could be to raise prices of their products, in this case automobiles, making thus increase their profit margin and achieve a numerator higher. Another viable option could be increasing its rotation of assets.. Margin on sales This ratio indicates how efficient the company is in the management of its operations, i.e., represents what part of each sold unit remains in the company in the form of benefit.. Margin on Sales =. Profit before taxes and financial expenses Net Sales. In the following table, we detach the calculation of this ratio in its two components:. Table 13: Evolution of the margin of sales:. Profit before taxes and financial expenses Net Sales Margin on Sales. 2015. 2014. 2013. 2012. 2011. 18,39 8.805,30 0,21%. -54,22 8.007,40 -0,68%. -135,61 6.927,30 -1,96%. -14,9 6.499,80 -0,23%. -47,78 5.635,90 -0,85%. Source: Own elaboration. With this breakdown, the margin shows us the efficiency of managers to incur the necessary costs to generate sales of THE COMPANY SEAT, S.A. The logical thing for a company such as is the case of SEAT, S.A. would be to take a large margin, but it is not the case. As we have said before this would be one of the things that should correct the address of the company with its operators.. 29.
(30) Asset Rotation The rotation of assets will show us how many times during the year a volume equivalent to the assets financed with cost that the company provides, or to put it another way, this ratio compares the amount of sales with the assets used to generate them. Its calculation is performed as follows:. Asset Rotation =. Net Sales Invested Capital. Table 14: Evolution of the rotation of assets. Net Sales Invested Capital. Asset Rotation. 2015. 2014. 2013. 2012. 2011. 8805,30 3.915,30 2,25. 8007,40 3.945,05 2,03. 6927,30 4.200,60 1,65. 6499,80 4.236,70 1,53. 5635,90 3.999,60 1,41. Source: Own elaboration In the previous table, we observe how the clear sales are superior to the laid-down capital, but not the sufficient thing as to have strong economic profitability. So, since we have also previously said, this would be another point analysis, in less measurement, on the part of the direction to be able to change the weak position of the economic profitability. However, this ratio gives better results for the profitability that the sales margin, this means that managers and/or managers put more emphasis on this point because of its impact on the costs necessary to generate sales of the company.. 2.4.2 Financial Profitability According Contralapiedra (2014), "The ratio of financial profitability, which is also known by the English expression ROE (Return on Equity), measures the profitability that the owners of a company get, for which compares the result of the exercise (net profit) with own funds.". For its calculation, we use the following expression:. ROE =. Net Profit Equity means. 30.
(31) Then we find a table and chart which shows us the evolution of the economic profitability of the company SEAT, S.A.. Table 15: Evolution of the financial profitability ROE. 2015. 2014. 2013. 2012. 2011. 1,12%. -12,82%. -26,23%. -4,50%. -11,47%. Source: Own elaboration. Chart 14: Graphical representation of the financial profitability. Source: Own elaboration It is noted as the ROE has fluctuated during the period, increasing and decreasing over the years. In the studied period, from 2011 to 2015, the financial profitability has increased - 11.47% to 1.12%. As we observe, Seat, S.A. has several negative economic profitabilities, then these years has not obtained benefits, or said otherwise, it has obtained them but on negative form. This accompanies a few low quantities of clear patrimony to this. The increase of the last two years is due to the fact that the benefits have been increasing up to stop being negatives in 2015, as the clear patrimony has increased but in small movements.. Financial leverage The financial profitability depends on the profitability economy and of leverage. We will find it reflected in the following expression:. ROE=ROA + financial leverage. 31.
(32) The result of the financial leverage can be interpreted in the following manner:. - Positive, when the ROE is superior to ROA. This will occur when the average cost of debt is less than ROA (economic profitability). Thus, the funding of the asset with debt has permitted the growth of Roe (financial profitability). - Negative, when the ROE is less than ROA. In this case, its average cost of debt is greater than ROE. - Null, when both ratio match and we obtain a leverage equal to zero. This happens when the whole of the asset is financed with own funds, to put it another way, the company has no debt. However, we will get these results through the following formula: Financial leverage=e*(ROA-i) Once made the calculations of the financial leverage can be checked the previous expression where the financial profitability is equal to the greater economic leverage. And in the following table we find all this decomposition and check.. Table 16: Decomposition of the financial profitability (ROE). Average cost Indebtedness Leverage margin Financial Leverage ROA Comprobation: ROE = ROA+ FL. 2015. 2014. 2013. 2012. 2011. 0,37% 6,32 0,10% 0,65% 0,47% 1,12%. 0,33% 6,70 -1,71% -11,45% -1,37% -12,82%. 0,37% 5,45 -3,59% -19,58% -3,23% -22,81%. 0,42% 6,46 -0,78% -5,02% -0,35% -5,37%. 0,42% 6,18 -1,61% -9,96% -1,19% -11,15%. Source: Own elaboration Analyzing the previous table, we note that the single year with a positive leverage is in the year 2015 and with a low percentage of 0.65% and the same happens with both returns, economic and financial, are positive but with low rates. The other years have as a result negative levering and in the same way, the returns are also negative. If we look at the indebtedness, it is kept oscillating between 5 and 6. There are high amounts of indebtedness. The margin of leverage composed of economic profitability and the average cost of debt is also negative throughout the period with the exception of the year 2015.. 32.
(33) 3 COMPETITIVE ANALYSIS Finally, once analyzed the most important aspects of SEAT, S.A., we will move to SEAT, S.A. comparison with its main competitors. For the comparison, we have chosen those companies of the automotive industry that are at an equal to or similar level to company studied in Spanish territory. With this we are referring for example to those companies that provide a range of products or are defendants in a similar way. The selected companies are: AUTOMOVILES CITROEN, SA, PEUGEOT ESPAÑA, SA and FORD ESPAÑA, SL. For this comparison, for each competitor, the same procedure as the company SEAT, SA has been followed. So as, we will reflect then those aspects that we provide more information at the time of the comparison between the four companies. First, we will compare those items of equity to then compare the ratios. The first point to examine is the volume of the total assets of each company in the following table: Table 17: Comparison evolution total assets. SEAT, S.A. AUTOMOVILES CITROEN ESPAÑA , S.A. PEUGEOT ESPAÑA, S.A. FORD ESPAÑA, S.L.. 2015. 2014. 2013. 2012. 2011. 4.000 483 488 3.777. 3.831 434 380 3.326. 4.059 1.137 420 2.592. 4.342 1.275 434 1.873. 4.131 1.347 552 1.568. Source: Own elaboration. At first glance, we observed how the company with more assets (current assets and noncurrent asset) is SEAT, SA. The company that followed with more assets is FORD ESPAÑA, SL with half of assets during the first three years of the period, but with small differences in the last two years due to its continued growth. Finally, we have to AUTOMOVILES CITROEN ESPAÑA, SA and PEUGEOT ESPAÑA, SA where most of the total assets come from the departure of Active streams, in particular cash and other equivalent liquid assets. SEAT, SA differs from both in that, on the contrary, the departure of cash and equivalents is null. For a better view of this asset, we are going to see the evolution of the same in the different competing companies.. 33.
(34) Chart 15: Comparison evolution total assets.. Source: Own elaboration. As we can see, the more constant evolution of the asset is the SEAT, S.A. followed by the evolution of PEUGEOT ESPAÑA, S.A. The asset that more growths presents from 2011 is FORD, SL. With regard to the company cars AUTOMOVILES CITROEN ESPAÑA, SA we emphasize that its had a strong fall of assets in 2014 which was gradually recovering the following year. It should be noted that in the year 2015 all companies presented positive developments.. Another item of great importance would be the result of the exercise obtained during the entire period, but before that we are going to analyze the turnover. Table 18: Comparison net turnover. SEAT, S.A. AUTOMOVILES CITROEN ESPAÑA , S.A. PEUGEOT ESPAÑA, S.A. FORD ESPAÑA, S.L.. 2015. 2014. 2013. 2012. 2011. 8.332 1.307 1.453 8.883. 7.497 1.136 1.209 6.745. 6.473 1.042 1.017 5.561. 6.087 1.062 977 3.946. 5.049 1.336 1.242 4.760. Source: Own elaboration. In the same way that previously in the case of the asset, the companies with more revenues via sales are SEAT, SA and FORD ESPAÑA, SL. Both CITROEN S.A. and PEUGEOT ESPAÑA, SA have some figures more reduced respect to the previous two competitors and that are around the 1,700 million. This item of the profit and loss account is important to the company, since the majority of profits should come from sales. So, again, SEAT, SA is over its competitors but with a few differences compared to FORD ESPAÑA, SL since in 2015 came to exceed its total assets.. 34.
(35) Chart 16: Comparison net turnover evolution.. Source: Own elaboration. We emphasize the growth of sales in the last year of the period, where the four companies recorded positive developments with regard to 2014 with the exception of SEAT, SA that keeps its positive developments throughout the period. Specifically, in both the 2015 and 204 have positive developments, due in large part by the economic recovery, which causes the increase in consumption.. To finish with the comparison of the most important items property, we are going to compare the results of the exercise.. Table 19: Comparison result exercise. SEAT, S.A. AUTOMOVILES CITROEN ESPAÑA , S.A. PEUGEOT ESPAÑA, S.A. FORD ESPAÑA, S.L.. 2015. 2014. 2013. 2012. 2011. 6 10 -4 119. -66 5 1 82. -149 -7 -9 191. -30 -5 -13 10. -62 12 8 -43. Source: Own elaboration.. 35.
(36) Chart 17: Comparison result exercise evolution.. Source: Own elaboration.. The results of the four companies are very varied and irregular, since all have had both benefits and losses. As we have previously observed, the headings of SEAT, SA have some inferior figures to those of its competitors. For example, in 2015 it gets a benefit of 6 million euros, while FORD ESPAÑA, SL, a company with similar figures with regard to the other, gets a benefit of 119 million euros. It draws our attention that the company PEUGEOT ESPAÑA SA with a turnover figure in 2015 higher than the rest of the period, get in this year losses 4 million euros. This has been caused both by the increase in the reduction of finance for supplies increased income. The variations of the result do not have great peculiarities; however, we emphasize the high growth of FORD ESPAÑA, SL that has a growth very high in 2013, which recorded a few beneficial 191 million euros compared to the 10 million in the previous year.. The working capital, as we have already seen above, is given by the difference between the current assets and current liabilities. Then we find a chart together with the data table of the working capital of the four companies:. 36.
(37) Table 20: Working capital comparison. SEAT, S.A. AUTOMOVILES CITROEN ESPAÑA , S.A. PEUGEOT ESPAÑA, S.A. FORD ESPAÑA, S.L.. 2015. 2014. 2013. 2012. 2011. -2.012 -87 -170 -1.478. -2.032 -123 -179 -1.203. -2.465 522 -168 -855. -2.451 439 -239 -408. -2.101 438 -210 -290. Source: Own elaboration. Chart 18: Working capital comparison.. Source: Own elaboration. As the first point before entering in the field, we can observe as the quantities of the period of SEAT, SA are insignificant in comparison with those of competitors. The working capital has three possible interpretations. The first would be that the working capital was equal to zero. The result is that the current asset is funded with the current liabilities and that the asset is not current is financed with permanent resources. However, this first interpretation of the fund does not provide any of the competing companies. The second interpretation is that the working capital is greater than zero, which is only represented in the first two years of the period of the company AUTOMOVILES CITROEN ESPAÑA, SA. This case, the not current asset is funded by permanent resources and current assets financed in part by the current liabilities and on the other by the permanent resources. The interpretation that presents AUTOMOVILES CITROEN ESPAÑA, SA. the rest of the period together with SEAT, SA and the rest of the competitors is a working capital less than zero. In this abundant case, the current liabilities funded at current asset and also part of the asset are non-current, the other part of the non-current asset is financed with permanent resources. 37.
(38) The liquidity either short or long term, is another important factor to analyze the different companies. In this way we will know the availability of liquidity of the various competing companies in regard to SEAT, SA. Chart 19: Comparison ratio of overall liquidity.. Source: Own elaboration. As we said in the study of liquidity in the short term, it is recommended that the value obtained in this study is greater than 1. Thus, if we look at the chart, the only company that exceeds the unit is AUTOMOVILES CITROEN ESPAÑA, SA. in the years 2011, 2012 and 2013. The other competitors are placed below the unit, but with values higher than SEAT, SA. In relation to the last two years of the period (2015 - 2014) none of the 4 companies analyzed has sufficient liquidity to deal with short-term, however, PEUGEOT ESPAÑA, SA and FORD ESPAÑA, SL have values close to the unit and despite not having sufficient liquidity will have fewer problems than SEAT, SA and AUTOMOVIELS CITROEN ESPAÑA, SA to take charge of debts.. The same as in the short-term liquidity, in the solvency or liquidity in the long term, there is also a need to obtain a result greater than or equal to one and in any case positive. Unlike the short-term liquidity, here it is necessary to obtain higher values than one, because if the opposite happens, companies would have to face competition of creditors as at the time we said.. 38.
(39) Chart 20: Comparison solvency ratio.. Source: Own elaboration. All companies have a value greater than one during the period. In the case of PEUGEOT ESPAÑA, SA caresses values very close one, stood as the company with less the four solvency. It is followed by SEAT, SA with an average of 1.16 which is of equal value in the past two years to the company's AUTOMOVILES CITROEN ESPAÑA, SA. The company FORD ESPAÑA, S.L. is the most consistent, with a mean value of 1.71. Thus, neither SEAT, S.A. nor any of its major competitors have long term liquidity risk. Until now with the analysis made, SEAT, SA has very few liquidity both short term and long term and despite that has a high number of assets and sales as compared with the other companies, this is not sufficient for obtaining better results than those of its competitors. To continue with the study, we are going to carry out the comparison of yields economic and financial.. As we saw earlier, SEAT, SA has a very low economic profitability, this is negative up to the year 2015 that rises from the negative figures to position itself in a 0.47%.. 39.
(40) Table 21: Comparison economic profitability - ROA. SEAT, S.A. AUTOMOVILES CITROEN ESPAÑA , S.A. PEUGEOT ESPAÑA, S.A. FORD ESPAÑA, S.L.. 2015. 2014. 2013. 2012. 2011. 0,47% 2,14% -0,87% 3,64%. -1,37% 0,69% 0,19% 3,07%. -3,23% -0,57% -1,80% 8,82%. -0,35% -0,36% -2,62% 0,85%. -1,19% 0,35% 0,67% 0,84%. Source: Own elaboration. Chart 21: Comparison economic profitability - ROA.. Source: Own elaboration. Graphically we see how the company with more profitability and thus, it the one which has the best leverages in investment with respect to competition is FORD ESPAÑA, SL, which, although it begins with almost zero profitability, is growing year after year. Followed by AUTOMOVILES CITROEN ESPAÑA, SA, although we already find several negative returns in 2012 and 2013. Thus, together with PEUGEOT ESPAÑA, SA and SEAT, SA they fight to a more equal level regarding profitability, with negative returns in up to three and four times. The three companies should take specific decisions such as those referred to in the study of the economic profitability of SEAT, SA to improve this, and even FORD ESPAÑA, SL could be planned these measures to improve its profitability, although it gets positive values, which relatively low.. 40.
(41) The financial profitability of SEAT, S.A. as we have previously seen is dominated by its negative results, although in the last year it was recovered from these negative figures to reach 1.12%. Table 22: Comparison financial profitability. SEAT, S.A. AUTOMOVILES CITROEN ESPAÑA , S.A. PEUGEOT ESPAÑA, S.A. FORD ESPAÑA, S.L.. 2015. 2014. 2013. 2012. 2011. 1,12% 13,40% -24,22% 10,09%. -12,82% 1,37% 4,04% 7,63%. -26,23% -1,01% -40,73% 20,37%. -4,50% -0,72% -40,30% 1,19%. -11,47% 1,74% 19,09% -5,09%. Source: Own elaboration. Chart 22: Comparison financial profitability.. Source: Own elaboration. If we look at the chart we see visually who we have an evolution similar to the previous one. The most constant companies are AUTOMOVILES CITROEN ESPAÑA, SA and FORD ESPAÑA, SL, both with positive returns over the period. On the contrary, PEUGEOT ESPAÑA, SA joins SEAT, SA with its sudden changes, where they both have positive as well as negative returns. With regard to the last year, we can observe how SEAT, SA has obtained a better profitability than PEURGEOT ESPAÑA, SA we therefore conclude this ratio claiming that they are more profitable for their owners competing undertakings AUTOMOVILES CITROEN ESPAÑA, SA and FORD ESPAÑA, SL that the studied until now SEAT, SA. This is something that should be taken into account by the direction for future years, as it is given by the result of profits of that enterprise.. 41.
(42) To better understand the financial profitability, we will compare the analysis of one of its components of great importance such as the financial leverage or also called indebtedness. Table 23: Comparison leverage financial. SEAT, S.A. AUTOMOVILES CITROEN ESPAÑA , S.A. PEUGEOT ESPAÑA, S.A. FORD ESPAÑA, S.L.. 2015. 2014. 2013. 2012. 2011. 6,32 5,32 26,33 2,00. 6,70 1,03 21,97 1,75. 5,45 0,86 14,26 1,13. 6,46 5,50 33,84 2,03. 6,18 5,14 20,41 1,96. Source: Own elaboration. Chart 23: Comparison leverage financial.. Source: Own elaboration. In the above chart it is seen how the financial leverage in the 4 competing companies is positive throughout the period analyzed. The company with more debt is PEUGEOT, S.A. since if we note the financial profitability in the chart above, we see the relationship, because it is the company with the worst profitability. SEAT, S.A. despite a profitability not much better than PEUGEOT, S.A. which has a debt less than the latter. CITROEN, S.A. and Ford, S.L. are the companies that enjoy a better indebtedness since this does not exceed 6 per cent throughout the period. Thus, PEUGEOT, S.A. is the company with the highest risk.. 42.
(43) Once analyzed the different suitable aspects of the analysis, we find how SEAT, S.A. does not have advantage over their competitors. The most direct competitor that has the company is PEUGEOT, S.A. Since its results are more similar to the rest of the companies chosen for this analysis. Both have a low profitability and a low liquidity from the rest. But if talk about the theme of balance or income statement, both have a better position. With this we see that with a simple analysis of the equity is not enough to know the situation of the company, but that we must go further to know the situation both economic and financial and make a good economic -financial analysis.. 4 SECTOR ANALYSIS The importance of the automotive sector in Spain is given by the position the country occupies as a producer of vehicles at European and world level. In addition, this sector causes a wide auxiliary industry and components that in turn means a large number of convex industries as the steel industry, electronics, textiles or the crystal industry are among many others from the last century. It has a large weight in the industry, in exports and in employment. The automobile industry has therefore been a real driver of industrial development of Spain in the second half of the last century by both its powerful ability to drag from other industries as well as by its large multiplier effect on distribution and a wide variety of activities within the sector of services. The economic crisis and its effects have damaged negatively on the Spanish market and the automobile sector in general. However, the output of the crisis and the tax aid for obtaining vehicles are helping the recovery of sales and therefore to the improvement of the results of SEAT, SA, improvement that we can verify in the profit and loss account in the last year. The automotive sector has a turbulent and unstable environment with a high level of uncertainty and a lot of competition, which complicates the activity and decision-making. But for SEAT, SA and their expectations of business belong to the Volkswagen Group represents a fundamental backing. According to the International Organization of Car Manufacturers (OICA), Spain is ranked number 9 in the world ranking of countries producing vehicles.. 43.
(44) The current objectives of the industry of the automobile in Spain are to improve the productivity and the level of skilled labor in order to achieve the necessary competitiveness to deal with the emerging industries of Asian countries and Eastern Europe. To achieve this, it must adapt to consumer demands and continuous changes in the environment. And so, after these small strokes on the sector, we are going to realize an DAFO analysis of the sector of the motorcar.. OPPORTUNITIES o Low bargaining power of suppliers and intermediaries. THREATS o High competition o Buyer profile. o Tax benefits and labor. o substitute products. o Growing Demand. o Tax System. o Important market size. o Economic Crisis. o Technological Development. o Need to adapt to socio-cultural. o Bet of less polluting vehicles o Plans to boost consumption. changes o Heavy regulations on pollution o Regulations of clean energies. cars STRENGHTS o Good position in the European and world market o Brand Image o Auxiliary industry with good capacity o Decrease in staff costs o Broad product portfolio o Lesser financial need of current assets o Greater investment in fixed. WEAKNESSES o Negative accounting results o Lower revenue o Decline in the demand for high value-added products o Less advertising investment o Impairment of the shekel of life of the products o The. increase of the density of. the suppliers o Complex distribution channel. assets. 44.
(45) 5 DAFO We are going to do an internal and external analysis of the company SEAT S.A., where we will emphasize both strengths and opportunities and threats and weaknesses.. STRENGTHS: ➢ The company SEAT has in the market two car models that after many decades in the market they continue to be the flagship products of the company and the most sold. These are the Seat León and the Seat Ibiza. ➢ Seat has alliances with other companies in the sector of the automobile. We can highlight the company Volkswagen, which has possessed it almost 100 per cent. ➢ It has alliances with companies in the technology sector such as Samsung and SAP, where Seat, with the help of these alliances, develops new technologies for their cars. ➢ Service post - sale custom and it is affordable to everyone. ➢ Seat has a great brand reputation and quality product in Spain. ➢ It has a wide network of suppliers with which to operate.. WEAKNESSES: ➢ Seat, despite being a strong company in the sector of engine, continues dragging negative results from years ago. This changed during the year 2015, when it regained the benefits despite being low. ➢ The company has a large dependence on the Spanish market. ➢ Remoteness of a part of their technological suppliers because they come from Germany, a country where its largest shareholder Volkswagen is. ➢ Difficulties in China, where they are trying to manufacture. Even so, this country was reluctant to Seat and to its subsidiary Wolkswagen, which are looking for formulas of satisfactory manufacture.. 45.
(46) OPPORTUNITIES: ➢ Automotive mature industry, but not obsolete, as Ciriaco Hidalgo says, representative of Seat in several days of economy. ➢ Difficult entry of new competitors in the automobile sector. ➢ The substitute products are not a threat in this sector. ➢ The plan PIVE favors the automobile sector with its aid for the purchase of new vehicles.. THREATS: ➢ High level of unemployment caused by the economic crisis. This causes low level of income in the Spanish population. ➢ Reductions in public aid to I+D+i. ➢ Great intensity of competition in the automobile sector both nationally and internationally. ➢ Social unrest and instability of the Government.. 46.
(47) 6 CONCLUSIONS After the analysis of the company SEAT, S.A. in the period 2011-2015, we can determine that this company is relatively unstable. The company is weakened despite being a company of important brand name and being between the producers of the automotive sector in Spain with more sales. In 2015 the most requested model by the Spanish society was the Seat León and being the second consecutive year the bestselling car. Thus, we are going to remove all those conclusions that we have provided by this analysis and thus be able to make some recommendations for future years. The economic structure of the company has remained fairly stable over the years studied with small oscillations, both positive and negative, with regard to the exercises from without that variations in none of them has been remarkable. The company presents a high volume of long-term investments in Group companies and associated equivalent to the amount of their investment in plant and equipment in every analyzed year. SEAT, S.A. not only is a company manufacturer of motor vehicles, but it also provides financing of great importance to other companies of the group, in this case to the Volkswagen Group to which it belongs. With regard to the financial structure, the company reflects a progressive decrease in the equity as a result of the negative results of previous years studied with the exception of 2015 where the company is obtained a profit of 6 million Euros, being the lost accumulated during the last few years of 307 million euros. This situation has caused both the solvency as the ratios of self-financing of the company have been affected. Foreign funding received SEAT, S.A. throughout this period comes, in order of importance, commercial creditors and debts to group companies and associated short term. Commercial creditors finance absolutely the entire cycle of operation of the company and the latter come to complete the financing needed by the company as a result of the accumulation of several years of negative results. As far as Income statement, we have already highlighted the bulky and continued negative outcomes that can only be supported at the time when the company has support from shareholders or the rest of the companies of the group, and in any case, the company SEAT, SA belongs to one of the largest automakers in the world (Volkswagen Group) and therefore, we conclude that the German matrix bet on the viability of SEAT, SA.. 47.
(48) In the interior of the income statement, the amount of turnover has experienced a progressive increase in all the exercises, becoming in 2012 of 20%, being the 65% the cumulative increase in the period studied. Liquidity ratios exposes a situation with liquidity tensions since the results are below the desirable situation for any company; but perhaps not a situation as dramatic as they seem to point out the results since, as we have seen above, the support of the Group companies is manifest in the current financing of the company. During the period studied, there has been a continuous reduction of all periods for the cycle of exploitation: storage/manufacturing/selling, payment deadlines have been reduced to customers as well as payments to suppliers. However, the most remarkable feature of this part is that the company SEAT, SA gets to its suppliers finance quite throughout the cycle of exploitation such that providers achieved periods are, approximately, double the time required to manufacture, sell and collect products. Given that they only have positive results in the year 2015, both the ROE as the ROA, have been positive this year and negative in the previous four. Now, present great differences in the magnitude of the results, since while ROA has moved into negative results about 1%, the variability of the negative result of the ROE has been very important to becoming - 23% in 2013. The analysis of the cash flows of the company shows us that the activities of the exploitation represent the source of funds of greater importance of the company and also, we have seen that in the years in which the cash generation by the activities of the exploitation has been less, the company has obtained supplementary funds to undertake investments in fixed assets through loans from group and associated companies. Within its sector, the company SEAT, SA presents the worst results with regard to the liquidity and solvency, but as we have already commented prior to speak on the substance of maneuver of the company and of the generation of cash during the exercise, count with the support automobile to which it belongs guarantees you a seat, SA does not have problems to pay their debts in the short term.. 48.
(49) 7 REFERENCES Ansón Lapena ̃ , J. A. (1997). Valoración de empresas: análisis de los métodos utilizados en la práctica. Instituto de Auditores-Censores Jurados de Cuentas de Espana ̃ . Contralapiedra, M. (2014). Cómo interpretar el ratio de rentabilidad financiera o ROE | Gestores. de. Riesgo. y. Morosidad.. Retrieved. June. 15,. 2017,. from:. http://www.gestoresderiesgo.com/colaboradores/como-interpretar-el-ratio-derentabilidad-financiera-o-roe Cuervo, A., & Rivero, P. (1986). El analisis economico-financiero de la empresa. Revista Española de Financiación Y Contabilidad, XVI(84-89062-43–9), 15–33. Dominguez, J. & Seco, M. (2010). Análisis económico-fianancier. EOI. Guerras, L.A. & Navas, J. (2012). Dirección estratégica de la empresa. Teoría y aplicaciones. Navarra: Cívitas Ediciones. Hervás, F. (2013). Concepto y explicación del Estado de Flujos de Efectivo. Retrieved from:. https://www.ineaf.es/tribuna/concepto-y-explicacion-del-estado-de-flujos-de-. efectivo/ Llorente Olier, J. I., & Centro de Estudios Financieros. (2010). Manual de análisis de cuentas anuales. Centro de Estudios Financieros. Production Statistics | OICA. (n.d.) from http://www.oica.net/category/productionstatistics/ Rojo Ramiŕ ez, A. A. (2011). Análisis económico-financiero de la empresa: un análisis desde los datos contables. Garceta. Web Oficial SEAT - from http://www.seat.es/. 49.
Figure

+7


Documento similar
Core CSR policies are economic, legal, ethical and philanthropic actions directly associated with the core business of the firm and expected to enhance financial
From 2015, the two companies, but especially Repsol, began to involve and try to carry out large investment projects in renewable energies in their short, medium and long term
Models that tend to work well for short‐term projections based on, Support Vector Machines,
Note 1: LIL is liquidity liabilities, DCP is domestic credit to private sector, DCF is domestic credit provided by financial sector, DCB is domestic credit to private sector by
Assessment of small bowel mucosal healing by video capsule endoscopy for the prediction of short‐term and long‐term risk of Crohn's disease flare: a prospective cohort study..
To this end, TRADER takes advantage of the time series prediction capabilities of Long Short-Term Memory (LSTM) neural networks, by feeding them with traffic allocation information
This suggests the presence of short-term cycle strategy profits (short momentum) or long-term cycle strategy profits (long term reverse effect) in the Mexican stock exchange, an
“square-wave” [Ca 2+ ] c transients in young nuo-6 mutant worms was much smaller than that of controls, and their contribution to the mean peak width was marginal.. Figure S3
