Trabajo Fin de Máster
AVANZADAS PARA EL
DESARROLLO
AGROFORESTAL
Leovogildo Belarmino
TRABAJO FIN DE MASTER
“PROPOSING A SUSTAINABLE DEVELOPMENT MODEL IN
TIMOR-LESTE BASED ON FOOD SOVEREIGNTY”
“PROPOSING A SUSTAINABLE
DEVELOPMENT IN TIMOR- ON FOOD
SOVEREIGNTY”
Acknowledgements
Food Sovereignty is one of the current biggest issues that has been taken into account by many international government bodies, international organizations and agencies to develop the idea and concepts in order to determine each country's rights, ecologically and culturally appropriate, avoid dependency on international food policies for alleviating poverty and hunger.
As a new nation, it is necessary that Timor-Leste determines its own policies relying on the existence of natural resources and socio-cultural conditions. Hence, it is necessary for each entity to contribute and develop relevant development models suitable for the future. As part of my participation to the development of sciences, I would like to contribute this paper on“Proposing a Sustainable Development Model in Timor-Leste based on Food Sovereignty”.
This paper draws on my experience and the best of my knowledge during the master’s degree studies at Universidad de Valladolid (UVa), Spain. I am aware that there are a lot of limitations of ideas in this paper; however I hope that this paper would contribute to the development of insights and knowledge of academic students and those international organizations, Civil Society Organizations, Government institution and farmers, small scale producers, pastoralists, fisher-folks, peasants and cooperatives in every corner of the world.
Also many thanks for the international student's collaborations for support and ideas, my fellow students: Ramiro Gonzalez (Spain), Carmen Montero Santos (Spain), Laurentino (Spain), Amuji Felix (Nigeria), Ruth Karina (Honduras), Marian Montania (Paraguay), Michel Allogo (Gabon) and Iosody (Mexico)... I hope that you can visit Timor-Leste one day and we always welcome you, we are as brothers and sisters: one world - one life.
I also would like to thank for the people in Timor-Leste; Sr. Diogo Freitas and the member of GAC-UNTL, Rede HASATIL, Cooperativa LOUD and those who have been contributing their ideas through my questioners. I would also like to give my gratitude to Giacomo Mencari (Italy), Rena Molter (Germany), Merel Engellhoven (Holland), Nichola Hungerford (New Zealand), Deb Salvagno and Mr. Colin Corner (Australia) for their constructive ideas.
For all of you my brothers and sisters who are not mention here with your support and ideas I dedicate to all of you. I hope that this paper is useful for you!
I also would like to thanks some people in Timor-Leste; Sr. Diogo Freitas and the member of GAC-UNTL, Rede HASATIL, Cooperativa LOUD and those who have been contributing their ideas through my questioners. I would also like to give my gratitude to Giacomo Mencari (Italy), Rena Molter (Germany), Merel Engellhoven (Holland), Nichola Hungerford (Australia), Denis Tolkach, Deb Salvagno and Mr. Colin Corner (Austalia) for their constructive ideas.
I would love to dedicate my immense love and uncountable thanks to my ancestors spirit, my father and brother's souls for accompanying my life during my studies and stay in Spain, to my beloved wife Donela Joana Guterres and my children (Key-Loy and Noloitelo), my beloved mother Julieta dos Santos and stepfather Nicolao Santana, Juviana dos Santos and her family, Belita dos Santos and her family, my sister Lenny and brother No-Lesu who are always praying for my success in my study.
For all of you my brothers and sisters who are not mention here with your support and ideas I dedicate to all of you. I hope that this paper is useful for you!
Universidad de Valladolid, Spain
ABSTRACT
This paper aims to analyse the role of food sovereignty as an alternative to the current economic growth based on exploitation of oil. Proposing a sustainable development model based on food sovereignty is one of the solutions to alleviate poverty rates hunger and malnutrition due to the indicators by people engaged in agriculture, rich in natural resource, availability of local staple food, availability of organic food, diversity of genetic resources and ecological purities. The econometric methodology was used to value the different weight of socio-economic variables of the economic growth in the country, while the method of AHP was establish priorities strategies from the SWOT diagnosis. The result showed the dependency on petroleum revenue is currently dominating the whole Gross Domestic Product (GDP), while followed by the agriculture sector, tourism and other sectors tended to contribute to the GDP in the country. While strengthen in the strategies from the SWOT diagnosis to population rely on agriculture as their livelihood and the lowest criteria self-motivated farmers in agriculture activities. The most opportunity is to determine its own agriculture system based on food sovereignty and finally balancing social cohesion for people’s rights and justice. While the most problems are related to the water and irrigations and the lowest criteria is lack of agriculture inputs. Competitive local and global markets are most threats for smallholder farmers, peasants, fisher-folks and small producers while domination of imported foods also hampered local foods available in the country. Thus sustainable development based on food sovereignty potentially depends on current agriculture situation and self determination of food and agriculture while a big challenge is provision of agriculture inputs in order to balance local and global markets systems.
RESUMEN
Este trabajo tiene como objetivo analizar el papel de la soberanía alimentaria como una alternativa al actual crecimiento económico basado en la explotación del petróleo. La propuesta de un modelo de desarrollo sostenible basado en la soberanía alimentaria es una de las soluciones para paliar las tasas de pobreza, el hambre y la desnutrición debido a los indicadores de las personas dedicadas a la agricultura, rica en recursos naturales, la disponibilidad de alimentos locales de primera necesidad, la disponibilidad de los alimentos ecológicos, la diversidad genética de recursos y purezas ecológicos. La metodología econométrica se utilizó para valorar el diferente peso de las variables socio-económicas del crecimiento económico en el país, mientras que el método de AHP se utilizó establecer estrategias prioritarias del diagnóstico DAFO. El resultado mostró que la dependencia de los ingresos del petróleo actualmente domina todo el Producto Interno Bruto (PIB), seguido por el sector de la agricultura, el turismo y otros sectores contribuyen al PIB en el país. Mientras se fortalecen las estrategias de diagnóstico DAFO la población depende de la agricultura como su medio de vida y los criterios bajo los agricultores automotivados en actividades agrícolas. La mayor oportunidad es determinar su propio sistema de agricultura basada en la soberanía alimentaria y, finalmente, el equilibrio entre la cohesión social de los derechos y la justicia de las personas. Mientras que la mayoría de los problemas están relacionados con el agua y los riegos y los criterios más bajos es la falta de suministros agrícolas. Los mercados locales y globales competitivos son la mayor amenaza para los pequeños agricultores, campesinos, pescadores y pequeños productores. Mientras que la dominancia de los alimentos importados también obstaculiza los alimentos locales disponibles en el país. Por lo tanto el desarrollo sostenible basado en la soberanía alimentaria potencialmente depende de la actual situación de la agricultura y la autodeterminación de los alimentos y la agricultura, mientras que un gran reto es el suministro de insumos agrícolas para equilibrar los sistemas de mercado locales y globales.
Table of Contents
Acknowledgements...3
ABSTRACT...5
Table of Contents...7
List of Tables...8
Lists of Figures...8
List of Abbreviations...9
CHAPTER 1. INTRODUCTION AND JUSTIFICATION...10
1.1. General Objective ...15
1.2. Specific Objectives...15
CHAPTER 2. GENERAL DESCRIPTION, AGRICULTURE AND FOOD POLICY.16 2.1. Food Security vs. Food Sovereignty ...16
2.2. Food Sovereignty Implications in Timor-Leste ...17
CHAPTER 3. INDICATORS OF SOCIO-ECONOMIC AND HUMAN DEVELOPMENT IN TIMOR-LESTE...19
3.1. National Annual Gross Domestic Product (GDP) ...19
3.1.1. Petroleum Revenue ...19
3.1.2. Agriculture Value...20
3.1.3 Tourism sector ...20
3.2. Human Development Index (HDI) ...21
3.2.1. Poverty and malnutrition ...22
3.2.2. Literacy ...22
3.2.3. Water and Sanitation ...23
3.2.4. Employment ...23
CHAPTER 4. DEVELOPMENT POLICY IN TIMOR-LESTE...24
4.1. Future Development Approach with Petroleum...24
4.2. Alternative Approach in the Future...24
4.2.1. Agriculture and forestry areas ...24
4.2.2. Agriculture Production Index ...25
4.2.3. Land Utilization ...25
4.2.4. Investment in Agriculture ...26
4.2.5. Irrigation System ...27
CHAPTER 5. MATERIALS AND METHODOLOGY...29
5.1 Primary Source Data Collection ...29
5.2 Secondary Source Data Collection ...30
5.3 Data Analysis ...30
5.3.1. Analysis of Linear Regression Model...30
5.3.2. Analysis of Hierarchy Process (AHP)...32
CHAPTER 6. RESULTS AND DISCUSSION...35
6.1. Country Economy...35
6.1.1. Petroleum Revenue ...35
6.1.2. Agriculture Production Value ...36
6.1.3. Agriculture added value to GDP...37
6.1.4. Total Country GDP...38
6.2. SWOT Analysis ...40
6.2.1. Strengths ...40
6.2.2. Weaknesses ... 42 6.2.3. Opportunities ...42
6.2.4. Threats...43
7.1. Conclusion ...45
7.2. Recommendation ...45
REFERENCES...47
Annex 1. Analysis of Petroleum Revenue ...50
Annex 2. Analysis of Agriculture sector...55
Annex 3. Agriculture Value added to GDP ...59
Annex 4. Country GDG Growth ...63
Annex 5. Result of SWOT Analysis...67
Annex 6. Questioner (Interview data) ...68
Annex 7. List of Interviewers...76
List of Tables Table 1 Type of Tourism in Timor-Leste...21
Table 2 Agriculture and Forest area in Timor-Leste (FAOSTAT 2015) ...24
Table 3 Water and Irrigation Systems in Timor-Leste (ADB 2002)...28
Table 4 Analysis of Timor-Leste economy base on Petroleum...36
Table 5 Analysis of Agriculture Sector...37
Table 6 Analysis of Agriculture added value to GDP...38
Table 7 Analysis of Total Country GDP ...39
Table 8 Analytic Hierarchy Process (AHP) based on criteria of SWOT ...41
Lists of Figures Figure 1 Map of Timor-Leste (Presidenciarepublica.tl. 2015); ...10
Figure 2 Timor-Leste Annual Petroleum Revenues (Lao Hamutuk 2011) ...19
Figure 3 Timor-Leste Agriculture Production Index (FAOSTAT 2015); ...25
Figure 4 Land utilization in Timor-Leste (FAOSTAT 2015);...26
Figure 5 Government Funds Allocation per Sector in 2010 (PEDN 2011);...27
List of Abbreviations
ADB Asian Development Bank
AHP Analytic Hierarchy Process CIA Central Intelligence Agency
CPLP Community of Portuguese Language Speaking Countries CSO Civil Society Organizations
ETSIIAA Higher Technical School of Agricultural Engineering FAO Food and Agriculture Organization of the United Nations FAOSTAT Food and Agriculture Organization Statistics
GDP Gross Domestic Product
HDR Human Development Report
IAASTD International Assessment of Agricultural Science and Technology for Development
IMF International Monetary Fund
KONSSANTIL National Committee for Food Security, Sovereignty and Nutrition in Timor-Leste
MAF Ministry of Agriculture and Fishery
MDG Millennium Development Goals
NGOs Non Government Organizations
NSD National Statistic Data
OLS Ordinary Least Square
PEDN National Strategic Development Plan SPSS Statistical Product and Service Solution
SWOT/DAFO Strengths, Weaknesses, Opportunities and Threats
UN United Nations
UNDP United Nations Development Program
UNFPA United Nations Fund for Population Activities UNICEF United Nations Children's Fund
USAID United States Agency for International Development
WFS World Food Summit
CHAPTER 1. INTRODUTION AND JUSTIFICATION
Timor-Leste (or East Timor) is a small country in Southeast Asia with land
area of about 19,000 km2. It shares a border with West Timor, part of the
Indonesian province of Nusa Tenggara Timur (NTT). The local climate is tropical
and generally hot and humid, characterized by distinct rainy and dry seasons. The
population is estimated at 1 million with a growing rate of 2.9 percent annually. The
total agricultural land is estimated at about 240,000 ha out of which about 52,000 ha
are under irrigation for some part of the year. The per capita agricultural land is
therefore small and is estimated at about 0.39 hectares. Land ownership is not
always clear and there are different tenure systems. The Government is carrying on
a process to establish formal or legal land ownership rights.
The country is mountainous, largely deforested with poor soils and erratic
rainfalls. In view of the mountainous terrain and substantial deforestation of the
country the land is subject to substantial erosion. In spite of these severe
constraints the country is substantially agricultural with 80 percent of the population
being heavily dependent on agriculture, including forestry and fisheries, for its
livelihood.
However given the low productivity and expanding population, overall
Timor-Leste is not self-sufficient in terms of food production. According to the Food
and Agriculture Organization of the UN, 30-40 % of food consumed in the country
Timor-Leste declared its full independence in May 2002, as the newest
country in the 21st century. Timor-Leste lost about 70% of its infrastructures after
the Indonesian occupation in 1999 and the 2006 crisis (UNDP, 2011). The
government of Timor-Leste has prioritized to rebuild its infrastructures, laying the
foundations for democratic governance and the national delivery of essential
services. However poverty reduction remains the biggest issue to be tackled within
the sustainable development agenda (PEDN, 2010).
Timor-Leste is a low-middle-income country despite the large natural
resources. This is because the country main revenue originated from gas and oil
exploration in the Timor Sea (81.6%) while agriculture and services account
respectively for 2,6% and 15,8% of the total budget. This obvious imbalance makes
Timor-Leste the second country more heavily dependent on oil revenue in the
world. CIA Fact book (2015).
While, UNDP Human Development Report in (2011) stated that
Timor-Leste's annual population growth is high at a rate of 2.9% per annum and the
current population is 1.066 million. However, the Human Development Index (HDI)
showed that Timor-Leste is ranked 134th out of 187 countries, an increase in
poverty rate from 36.3% in 2001 to 49.9% in 2007 while an adult illiteracy is 50.6%
even an estimate income per capita is USD$ 5,446 (HDR, 2011). Furthermore,
about 41% of the population lives under 1 dollar per day, 58% of population are
suffered from chronic malnutrition while 19% is severe malnutrition. Moreover 70%
of the population unemployed in vulnerable employs and about 90% of citizen
between 15-35 years old are unable to find jobs (UNDP, 2011; World Bank 2013).
Agriculture and tourism are considered as the other potential resources to
add an advantage to the nation's economy (PEDN, 2010). Therefore, the
government of Timor-Leste should prioritize them through new policies and capital
investment in order to boost the creativity of farmers, cooperatives, peasants and
fishermen to increase production for family food and selling for family's income
generation.
Agriculture is the second most important resources since 80% of the
populations are dependent on agriculture as their potential livelihood. Therefore it is
crucial that the Government gives priority to the development of the agriculture
sector to achieve food self-sufficiency and promote a sustainable socioeconomic
Agriculture has widely changed from a traditional system to a semi modern.
A shift model of agriculture has been transforming the agricultural system based on
the food security aims to respond to the needs of the domestic and international
markets. This atmosphere gave way to the introduction of improved seeds from
Indonesia, the cultivation with advanced technology, the use of chemical fertilizers,
weed and pest eradication with chemicals that have been recommended by the
Indonesian government. This system has been eroding the local agricultural
traditions, increasing the reliance of farmers on advanced tools, chemical fertilizers
and pesticides that were harmful to human consumption and the environment. On
the other hand, this change has also resulted in the loss of many sources of
biodiversity (UNDP, 2011). One of the most prominent examples is the unavailability
of seeds during the planting season: all seed should come from Indonesia and the
seeds were only used for the monoculture system. Despite monoculture systems, a
threat of loss of germplasm and the diversity of natural resources existed, especially
local seed extinction due to less protection and conservation of biological resources,
seeds scarcity can also be due to low productivity and bad storage techniques, both
flora and fauna (Kammen, 2011).
Along with these issues, at the beginning of the transition period between
1999 up to 2012, under the auspices of the United Nations (UN) and the influence
of other nation’s agriculture systems such FAO promoted a “for a world without
hunger” and push the government to Promote agricultural growth and sustainable
food security (FAO, 2011). To ‘aggregate growth’ in the national economy, the
government consequently privileging large corporations and export industries, this
logic fails everywhere; but especially so in a country like other pacific nations, with
large rural populations, large subsistence sectors and large informal economies
(Anderson, 2015).
However, various problems, such as malnutrition, are faced by society, and
especially children and women under age at the time of conception, today. Children
are particularly vulnerable during the hungry season, where 58% of those under the
age of five suffer from chronic malnutrition and it weakens the immune system and
can lead to a heightened risk of illness and disease (UNICEF, 2013). In relation to
affects every year continuously the children under five years old, especially those
who live in rural areas.
One of the indicators showed that Timor-Leste has the highest burden
among 40 stunting countries. The percentage of malnutrition is expected
malnutrition around 55% and most of them are malnourished children under 5 years
old. Underweight and waste are increased in each family as well as the difficulties of
poor families in providing sufficient and healthy food for the growth and
development of the nation's children (Sarma, 2011).
The Government defined its objectives and tools to eradicate poverty and
contrast malnutrition through the establishment of the Comoro agreement in 2012
and an operational unit under the Ministry of Agriculture and Fishery (MAF), namely
the National Council for Food Security, Food Sovereignty and Malnutrition in
Timor-Leste (KONSSANTIL) (MAFP, 2014).
On the other hand, food imports and the need for basic materials from
abroad continuously improve people's dependence on food supplies from abroad
over the country's own productions. For example, farmers and small-scale rice
producers in Timor-Leste are no longer able to keep pace with the needs of
domestic rice. As a result, many of those feel disadvantaged in small-scale
business ventures of domestic rice (Kammen, 2011).
In addition, individual farmers and groups are unmotivated to compete with
foreign products, which are basically implementing dumping prices or predatory
prices, and as a result less domestic rice is sold at high prices. Mostly the rural
population in East Timor engages in subsistence agriculture divided between staple
crops, vegetable gardens, and animal husbandry while peasants and farmers have
shifted their mentality from being producers to consumers (Datt et al., 2014;
Kammen, 2011). While those who carry out domestic agricultural productions are
the elders, who approach the average age for unproductiveness (Anderson, 2015).
It should be noted that, food insecurity is also caused by lack of knowledge
of information and technology. Many rural farmers are engaging in subsistence
agriculture and less motivated by new innovations that are beyond their knowledge.
Overall, with the resources concentrated in the city, there are many people who
cannot get access to adequate information about sustainable agriculture that is in
Despite access to information and technology, one of the main obstacles is
that investment in the agricultural sector is very limited due to the human resources
and planning. Every year the government allocates a very small amount of money
to the agriculture sector, compared to investment in infrastructures that are two-fold
greater than the state budget. Furthermore, limited investment on agricultural
output that is seen as a function of inputs (land, capital and labor) and technology,
which in turn are influenced by the infrastructure and institutions of the economy
and by external factors which cannot be influenced by policy measures (Lundahl
and Sjöholm, 2012).
In addition, the soil conditions of Timor-Leste, which consists of rocky
areas and many mountains, also become a major impact in increasing domestic
food production. Aside from the rocky area there are also areas prone to landslides
and soil erosion as a result of climate change and human activity act by opening
new land, cutting down trees and burning forests.
Climate change resulted in many problems for the people and farmers,
namely much productive land that is not explored and abandoned, and crop failure.
Many people suffer from hunger during times of climate change because they
cannot adapt to the local environment.
Turning from existing agricultural issues, laws or regulations to the status of
land ownership is unclear among farmers in Timor-Leste. Some farmers are using
tribune land, but many farmers are using the land owned by private owners and
when the farmers want to plough that, they need to sign a contract with the
landowner, deciding on how they will divide the production for each harvest season.
Although there is still a lot of vacant land, it is rocky land, marginal to farmers to
grow and needs special skills to plough and grow the crops (UNDP, 2011).
The agricultural sector suffers from inadequate institutional support. At the
national level, the capacity to plan for sustainable agricultural and rural development
is limited. Although 80% of Timor-Leste’s population directly depends on agriculture
for their livelihood, the budget of the MAF account for more than four percent of the
total government budget. Agricultural research and extension training programmes
are weak, lack coordination and are often detached from field implementation.
Nevertheless, such initiatives must be sustained and further strengthened
in order to fulfil its obligations on right to food by implementing the food sovereignty
model to enable farmers and peasants to participate in the food system for their
sustainable life. Based on those problems a research has been undertaken to
propose a sustainable development model in Timor-Leste based on Food
Sovereignty.
1.1. General Objective
To analyse the role of food sovereignty as an alternative to the current economic
growth based on exploitation of oils. Proposing a sustainable development model
based on food sovereignty is one of the solutions to alleviate poverty rates hunger
and malnutrition due to the indicators by people engaged in agriculture, rich in
natural resource, availability of local staple food, availability of organic food,
diversity of genetic resources and ecological purities.
1.2. Specific Objectives
1. To analyse the current situation in Timor-Leste based on Human
..Development Index, poverty rates, malnutrition, literacy rate and ..employment
2. To perform a theoretical revision based on bibliography in the role
..of development model based on food sovereignty;
3. To identify which variables are available to explain more about the
..economic situation in Timor-Leste;
4. To analyze variables in relation to the situation of agriculture
..sector in Timor-Leste;
5. To establish a diagnosis of the economic structure in the country
CHAPTER 2. General Description, Food and Agriculture Policies 2.1. Food Security vs Food Sovereignty
Food Sovereignty arose from the evolution of experience from the farmers,
peasants, civil societies, community organizations, labourers and indigenous people
all over the world to claim their right to food and agriculture. They found the food
security gaps as the major impacts that logically used by the world neo-liberalism to
dominate in the world economic sector. The flexibility of market access through
export and import of agriculture products has been given more opportunity for the
free-market models designed by the World Trade Organization via World Bank and
International Monetary Fund (Lee, 2007; Chaifetz and Jagger, 2014).
The shifting definition of Food Sovereignty (SA) was first time raised in the
la Via Campesina in 1996 in Tlaxcala-Mexico. At the same year, the issue of food
sovereignty was raised at the World Food Summit in Rome.
Food Sovereignty was raised as cited bellow:
‘We, the Via Campesina, a growing movement of farm workers, peasant, farm and indigenous peoples’ organizations from all the regions of the world, know that food security cannot be achieved without taking full account of those who produce food. Any discussion that ignores our contribution will fail to eradicate poverty and hunger. Food is a basic human right. This right can only be realized in a system where Food Sovereignty is guaranteed.’ (Via Campesina, 1996b).
In 1996, Food sovereignty defined the right of each nation to maintain and
develop its own capacity to produce its basic foods and respecting cultural value of
all people (Via Campesina, 1996). While in 2002, Food sovereignty was the right of
people to define their own food and agriculture, to protect and regulate the domestic
agricultural production and trade in order to achieve sustainable development
objective to “determine the extent to which they want to be self-reliant” (Windfurh
and Jonsén, 2005). And in 2007, Food Sovereignty was defined as the right of
people to healthy and culturally appropriate food produced through ecologically
sound and sustainable methods and their rights to define their own food and
agricultural system (Nyéléni Declaration, 2007).
latter emphasises access to adequate nutrition for all, which may be provided by
food from one's own country or from global imports. In the name of efficiency and
enhanced productivity, it has therefore served to promote what has been termed the
“corporate food regime”: large-scale, industrialised corporate farming based on
specialised production, land concentration and trade liberalisation. Food security’s
inattention to the political economy of the corporate food regime blinds it to the
adverse effects of that regime, notably the widespread dispossession of small
producers and global agroecological degradation (Giménez, 2009).
Food sovereignty goes beyond the concept of food security.“Food security
means that everyone must have the certainty of having enough to eat each day but
says nothing about where that food comes from or how it is produced." Food
sovereignty includes support for smallholders and for collectively owned farms,
fisheries, etc., rather than industrializing these sectors in a minimally regulated
global economy. Food sovereignty also defined as "a platform for rural revitalization
at a global level based on equitable distribution of farmland and water, farmer
control over seeds, and productive small-scale farms supplying consumers with
healthy, locally grown food (Rosset, 2003).
2.2. Food Sovereignty Implication in Timor-Leste
In should be emphasis that Timor-Leste has been relying and leading
towards large-scale farming based on cash economy and at the same time the
majority of people in the farming communities have been steadily neglected by
ignoring the real condition as a country that the majority of people are from farming
communities
Agriculture has the potential of increasing both micro and macroeconomic
level and therefore it can be developed by the government to advance food
sovereignty; it should be based on a solid legal basis so that the goals in the
national strategic plan can be achieved.
Most of the Timorese people have known “food security” rather than “food
sovereignty” as good development model of agriculture in the country without
searching more detail about the impact of its benefit. Finally, it is difficult to exit from
the long-term unstable food status, who produce the food, how to produce and
The issue of food sovereignty was slightly no being included in the policy of
National Development Plan 2011-2030 as a model of the sustainable development
in the country. However the government have planned a green revolution as future
of agriculture in the country, where this model has failed in many countries like India
that green revolution technologies have blamed for the unintended consequences
such as income inequality, environmental degradation, and malnutrition. Similarly,
since the introduction of genetically engineered cotton in 2002, India witnessed an
unprecedented period of cotton productivity growth (Kolady, 2010).
The government through the Ministry of Agriculture and Fisheries (MAFF)
adopted the food security as one of the main objectives without analysing the
concept and the impact for the future. The agriculture sector itself cannot guarantee
the national food security hence the government through the Ministry of Tourism,
Commerce and Industry (MTCI) spent about $53 million per year ($660/Mt for
80,000 Mt6) and it would cost $160 million per year ($2,000/Mt) to grow the
equivalent tonnage under the current inefficient and unproductive rice production
systems (Young, 2013). The reality imposed that the food security models have
failed in this country and there continues to be food insecurity throughout the
country in more severe forms. Besides it, the food security model has not given
benefit for the farmers whilst giving profit to the companies, national and
international corporations (FAO, 2003). Farmers are continuously living with
insufficient of food, less access to markets, less productive land mainly in the land
where the chemical fertilizers were applied.
In order to eradicate hunger and poverty in Timor-Leste based on those
indicators; the government should shift its political models to food sovereignty as to
guarantee food self-sufficiency for people, increasing food production, market
CHAPTER 3. INDICATOR OF SOCIO-ECONOMIC AND HUMAN DEVELOPMENT IN TIMOR-LESTE
3.1. National Annual Gross Domestic Product (GDP) 3.1.1. Petroleum Revenue
CIA Fact book 2015 has noted that, Timor-Leste's source of
economic incomes are from different sectors; such as 2,6% from
agriculture sector, 81,6% from oil sector and other 15,8% from services.
The estimation of the total Gross Domestic Product (GDP) in 2013 has
collected about 14 billion USD. While annual GDP growth is 8.9%. The
major contribution is coming from the petroleum revenue while only a minor
part of the add value comes from the agriculture and tourism sectors.
Timor-Leste has abundance of natural resources in the maritime
zone and even the inland zones, such as oil and gases, minerals, gold,
agriculture, forestry and fisheries, however petroleum remains the main
source of economic income.
As the graphic shows, the petroleum revenue is gradually
decreasing every year. Estimations foresee that the only two oil fields,
Bayu-Undang and Elang Kakatua, will be drastically down until their lowest trough
in 2025. As in 2004 the income was estimated around 200 million dollars
and the highest peak were 2,500 million dollars in 2011 and going down in
the following years (Lao Hamutuk, 2011).
Given the great dominance of oil revenues within the national
budget, this situation is very alarming for Timor-Leste. It is vital to explore
and assess alternative productive sectors such as agriculture and tourism to
sustain the country economy.
3.1.2. Agriculture Value
The second source of income of the country is agriculture where it
has been added value to the GDP of the country. In 2014, it was estimated
around 2.6% from the agriculture sector. This percentage is very small
compared to the industries and services. The government of Timor-Leste
should invest in this area as source of family economic income and further
for the national income through export of agriculture products.
3.1.3 Tourism sector
Tourism is a potential sector after agriculture where it is important
to contribute in the development of micro-economy and macro-economy of
the country. The landscape of the country, historical places, sacred sites,
local living cultures and arts are unspoiled and well capable of attracting
tourism and people from abroad willing to come to visit.
Despite of its potential, it is important to preserve and protect in
order to have the purity in the long term days. It is essential for all the
Timorese people to take care and preserving this riches and the government
of Timor-Leste to invest in this viable sector as a local and national income
Table 1: Type of Tourism in Timor-Leste
Source: Tolkach, 2013
As a source of income, there are different types of tourism that
can be developed by the Leste government and people in
Timor-Leste such as: Eco-tourism, cultural/historic tourism, community-based
tourism, business tourism, volunteer tourism and mass tourisms in few
places like in Walu sere (Lautem), Baguia (Baucau) and Atauro (Dili). It has
been recorded that eco-tourism and cultural/historic tourism are most
potential in the country rather than the other type of tourism (Tolkach,
2013). It is necessary to invest in this sector as a source of income for the
community and the nation. In addition these types of tourism are more
important to the sustainable development of Timor-Leste in the future
beside agriculture and ecology.
3.2. Human Development Index (HDI)
The Human Development Report in (2011) stated that the Timor-Leste's
annual population growth is high every year at the rate of 2.9% and the current
population is 1.066 million. However, the Human Development Index (HDI) showed
that Timor-Leste is ranked of 134 out of 187 countries, an increase in poverty rate of
36.3% in 2001 to be 49.9% in 2007 while an adult illiteracy is 50.6% even an
estimate income percapita is USD$. 5,446 (HDR, 2011). In addition, about 41% of
the population live under 1 dollar per day, 58% of population are suffered from
population unemployed in vulnerable employs and about 90% of citizen between
15-35 years old are unable to find jobs (UNDP, 2011; World Bank 2013).
3.2.1. Poverty and malnutrition
In terms of tackling poverty there has been little improvement for
the poorest people of Timor-Leste, generally those who have little or no
education and work in agriculture. Also disadvantaged are widows and
orphans of the Resistance, as well as veterans and former child soldiers.
About half of the Timorese population lives below the basic needs poverty
line of $0.88 per person per day as compared with 36% in 2001. Given the
political transition in 2002 and the political crisis of 2006, this stasis is to
some extent understandable. However, this makes the task of achieving
the head count ratio of 14%, a target set in the 2004 MDG report, even
more challenging.
Sharma (2011) reported that Timor-Leste was included to the
country of Prevalence of Stunting in 40 Countries of High Burden
Regarding Malnutrition in the world and the highest one in Southeast Asia
that has more 40% malnutrition. This indicator reflects the poor social
conditions of the Timorese people, with 45% of children under five years
below their target weight in 2001. In 2007, 50% of all children were
underweight. In the longer term, poor nutrition in the early years of
childhood development impacts on physical and mental development,
causing poorer quality human resources for the country in future.
3.2.2. Literacy
Timor-Leste is a newly-created country in which the standard of
education is still poor. Approximately 38% of the population are students
and half of them are those who are enrolled in primary education and
pre-primary school. While adult literacy – the ability to speak, read and write a
simple sentence in any one language Tetun, Indonesian, Portuguese or
English - is 63.1% for men aged 15 years and above and 52.5% for
women. Literacy is much higher amongst youth, at 80 percent, for males
This is more in need of a comprehensive education both in rural and in
urban areas disregard to race and gender. (UNDP, 2009).
3.2.3. Water and Sanitation
The major problem faced by population in both rural and urban
areas is to access to water and sanitation. Improvements in sustainable
access to improved water sources were hampered by the political crisis in
2006, and this setback will make it difficult to reach the 2015 target of 78%.
In 2007 only 60% of the population had sustainable access to an improved
water source, and there was a sharp divide between urban and rural areas.
Regarding access to improved sanitation, there has been significant
improvement in both urban and rural areas and the country as a whole is
likely to achieve the 2015 target (UNDP, 2009)
In 2011, only 69.1% of population access of the improved drinking
water sources, and more severe was the population who live in the rural
area rather than the population in the urban area. In addition there were
only 38.7% of improved sanitation facilities where only 27.3% of rural
population could be accessed (UNICEF, 2013).
3.2.4. Employment
Timor-Leste with abundant natural resources with percapita
income of US $ 5.446 but the number of unemployment increases every
year. Approximately 41% of people living on less than 1 dollar per day.
According to reports from the UNDP that about 70% of the population
vulnerable or and 90% of them from the age of 15-35 years old who did not
get a job even though they are productive ages and average those who are
CHAPTER 4. DEVELOPMENT POLICY IN TIMOR-LESTE 4.1. Future Development Approach with the Petroleum
One of the most potential state revenue in the state of Timor-Leste is derived
from oil and gas production from two oil fields namely Elang-kakatua and
Bayu-Undang. Of which approximately 81.6% is the result of revenues from petroleum.
However, the results of this petroleum decreased drastically every year and these
two fields are expected to be exhausted in 2023 and the government of Timor-Leste
yet another alternative plan. In case this happens it will be a big threat to the
economy of Timor-Leste to the front. Therefore, the policy makers, politics and civil
society experts have argued that the only way to sustain the economy of
Timor-Leste is a massive investment in other productive sectors such as agriculture and
tourism.
4.2. Alternative Approach in the Future 4.2.1. Agriculture and forestry areas
Timor-Leste’s total country area is about 14.000 sq km that rich of
its natural resources, gases and mineral. It also potential for tourism,
agriculture and forestry sector that can be utilized as the income of the
country.
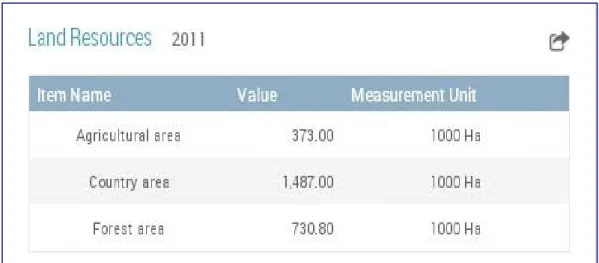
According to the FAOSTAT 2015 showed in the table of the land
resources in 2011 that major surface of Timor-Leste is forest area around
representing the Timor-Leste’s potential resources are agriculture and
forestry sector (FAOSTAT, 2015).
4.2.2. Agriculture Production Index
The index of agricultural production in Timor-Leste every year did
not show significant numbers and are always fluctuating. These results are
not conspicuous from data obtained from FAOSTAT (2015) that, the
agricultural index from the beginning of 2001 about 100 thousand dollars
and jumped about 120 thousand in 2009 but declined in 2011. The cereal
production figures which show significant results in 2009 and 2010 but the
results did not last long so the decline in 2011.
This means investing in agriculture sector is minimal and needs
government efforts, civil society organizations, international NGOs to plan
for an integrated long-term program in accordance with the National
Development Plan 2011-2030 (PEDN, 2011).
4.2.3. Land Utilization
The main constraints faced by the government of Timor-Leste are
on land ownership and land distribution. Where, most of the land into
private land, community land or customary land as well as land that have
been sold but the status are disputed and unclear. The country has not yet
provided a proper regulation planning to bind people's land rights and there
is limited vision to guide the land laws, regulations, services and bodies
necessary to address confusion over land ownership (Lao Hamutuk
Buletin, 2010).
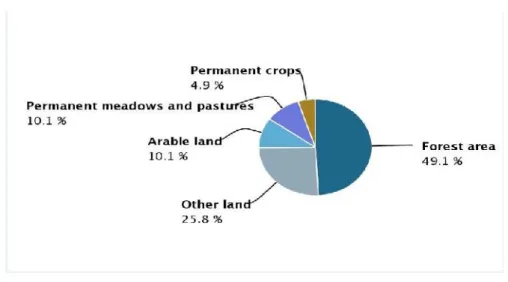
Nevertheless, Timor-Leste has a ground potential bias utilized for
agriculture and forestry. According to FAOSTAT (2015) that the use of land
around 49.1% is forest area, 4.9% permanent crops, 10.1% of permanent
meadows and pastures, 10.1% Arable land and 25.8% other land.
Even though it is necessary to resolve land disputes and uprights
the land justice that reflected the real conditions of people to access as a
key element for poor people as home to survive, culturally considered as
part of the body and the whole life system such as to grow food and
shelters.
4.2.4. Investment in Agriculture
Aside from petroleum, Timor-Leste also has a natural potential
that is suitable for agriculture. It is very promising self-sufficiency and food
sovereignty and is able to generate the economics of people where the
majority of the community's rely on farming.
Almost every year, the government of Timor-Leste has not put a
significant investment in order to boost the country's second greatest
economic sector. For example, it has been noted in 2010 only 7% of the
annual budget went into the agricultural sector through the Ministry of
Agriculture, Forestry and Fisheries. There were including the procurement
enough to fix the agricultural infrastructures such as irrigation systems,
demonstration sites in each municipality. The government needs to
increase the annual budget in order to boost farmers on producing foods in
the country.
However, the amount of funds invested in unbalanced agricultural
production is in line with the expectations. Approximately agricultural
production estimated for staple crops are unstable. Even more farmers are
reluctant to compete with foreign agricultural products, which are cheaper
compared to domestic agricultural products.
Therefore, it is very important for the government of Timor-Leste
to establish a farming system that involves all small farmers, cooperatives
and farmer groups to be able to produce the diversification of agricultural
production, for the continuation of life and can balance foreign products.
4.2.5. Irrigation System
Timor-Leste composed of 12 Hydrologic Units and has 29 main
river systems where 12 in north and 17 in the south. Total lenght of those
rivers is about 4.286 km with a total surface area of 18.342 ha, while the
renewable surface water is estimated about 8.129 km3 / year and 90%
return as base flow. (La’o Hamutuk, 2010).
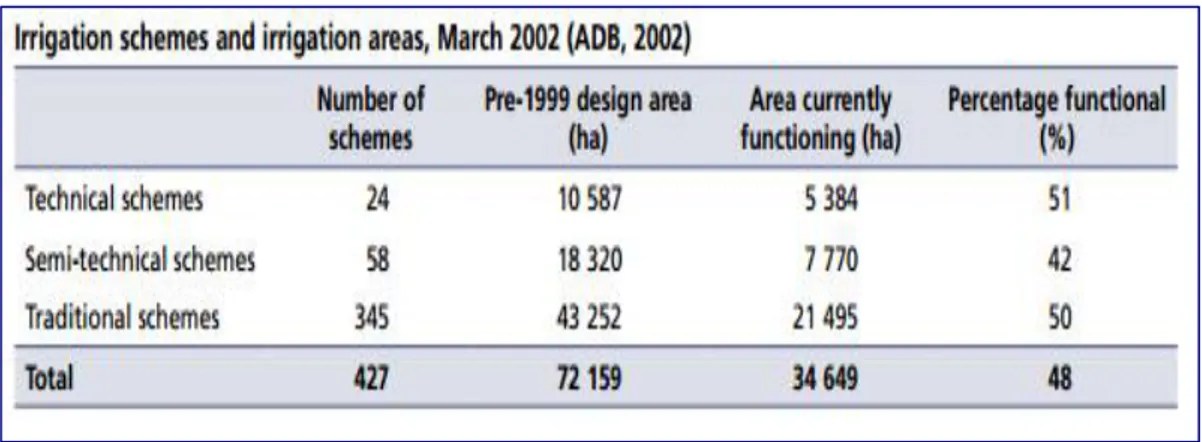
In 1999, before the withdrawal of the Indonesian government the
total design irrigation area in Timor-Leste was an estimated 72 159 ha
covering more than 427 schemes. However, in 2002 only 34 649 ha or 48
percent was left, of which 5 384 ha are technical schemes, 7 770 ha
semi-technical schemes and 21 495 ha traditional schemes (Table 2).
The current limited demand for water development lends weight to
the view that comprehensive and sophisticated policies are not warranted.
However, the water and sanitation and the irrigation agencies all perceive
the need for a water resources policy from their perspective (ADB, 2002).
CHAPTER 5. MATERIALS AND METHODOLOGY
The research uses a survey method designed to collect both quantitative
and qualitative data. Data was collected in Timor-Leste between April to June 2015
using the questioner prepared in two versions Tetum and English then sent to the
respondents (Annex 6).
Those questionnaires were primarily drafted by the researcher and sent to
the academic tutor and experienced community organizations and individuals who
have ample experience in data collection concepts.
A simple random sampling design was used to select 33 individuals or key
informants by selecting individuals from different positions and organizations, such
as: farmers, members of agriculture cooperative, university agriculture department
teachers, and university agriculture department students, local NGOs, Government
staff and normal citizens (Annex 7).
The questionnaire was sent to an experienced representative person in
Timor-Leste with explanations on how to use the questionnaire and what is required
from respondents through the questionnaire and direct non-formal conversation.
Each individual was given the freedom to provide ideas and preferences during the
interview session. This interview was given more opportunity to the female gender
participation as holds the key important persons in agriculture and food process in
Timor-Leste.
The interviews were confidential to each individual’s different organizations
and were conducted in Tetum, English and other local dialects when necessary.
The interview took place at home base or organization for 15 to 30 minutes for each
respondent including clarification and filling the questions.
5.1 Primary Source Data Collection
A representative person was chosen based on different sites from one to
another. There were given the whole questionnaire guidelines to use for
interviewing respondents.
For the general overview of the questioner comprises of general in
formations, major problem faced by Timor-Leste, proposing the solution and SWOT
Simple random method was used to interview individuals from different
organization and occupations. The list of respondents was prepared in order to
know the interested individuals were included and interviewed.
After all data were collected then a researcher representative scanned
them to the researcher for further analysis.
5.2 Secondary Source Data Collection
To fulfil the third objective of the study, secondary sources were also
collected from FAO database (FAOSTAT) which was accessed through online in
order to access the agriculture situation in Timor-Leste (www.faostat.org). Besides
it, a library research approach by using data from the previous documentations,
such as government reports, academic articles, statistical compilation and
manipulations, reference and abstract guides and content analysis (C.R. Kothari,
2004).
Broadening references, this research also used government institutions
and websites to obtain updated information on current policies related to food
sovereignty and agriculture. In addition to primary sources such as household and
agricultural census data and poverty assessment reports, government literature
focusing on current food security initiatives and agricultural development are also
referenced. Food and agricultural development reports were reviewed to gain an
understanding of the relative importance of gardening initiatives and the activities of
small subsistence and commercially oriented farmers in current policy agendas.
Scholarly journal articles analysing these topics are also used to contextualize the
study as they pertain to food and agricultural policy at different scales and historical
periods.
5.3 Data Analysis
5.3.1. Analysis of Linear Regression Model
Data from the FAOSTAT were tabulated in the Excel spreadsheet
then analysed by using the Statistical Product and Service Solutions
(SPSS) based on analysis of regression lineal and the result will be tested
to convince its confidential for supporting the primary data.
the goal of minimizing the differences between the observed responses in
some arbitrary dataset and the responses predicted by the linear
approximation of the data (visually this is seen as the sum of the vertical
distances between each data point in the set and the corresponding point
on the regression line - the smaller the differences, the better the model fits
the data). The resulting estimator can be expressed by a simple formula,
especially in the case of a single regressor on the right-hand side.
The analysis of Linear Regression Models supposes the data
consists ofnobservations { yµXi}ni=1. Each observation includes a scalar
responseyiand a vector ofppredictors (or regressors)xi. In a linear
regression model the response variable is a linear function of the
regressors:
whereβ is ap×1 vector of unknown parameters;εi's are unobserved scalar
random variables (error) which account for the discrepancy between the
actually observed responses yi and the "predicted outcomes" xiTβ; and T
denotes matrix transpose, so that xTβ is the dot product between the
vectorsxandβ. This model can also be written in matrix notation as
whereyand εaren×1 vectors, andX is ann×p matrix of regressors, which
is also sometimes called the design matrix.
As a rule, the constant term is always included in the set of
regressors X, say, by taking xi1 =1 for all i = 1, …,n. The coefficient β1
corresponding to this regressor is called theintercept.
There may be some relationship between the regressors. For
instance, the third regressor may be the square of the second regressor. In
this case (assuming that the first regressor is constant) we have a
quadratic model in the second regressor. But this is still considered a linear
model because it is linear in theβs.
This relationship is modeled through a disturbance term or error
relationship between the dependent variable and regressors. Thus the
model takes the form
where T denotes the transpose, so that xiTβ is the inner product between
vectorsxiandβ.
Often thesenequations are stacked together and written in vector form as
where
Some remarks on terminology and general use:
is called the regressand, endogenous variable, response variable,
measured variable,criterion variable, or dependent variable(see dependent
and independent variables.) The decision as to which variable in a data set
is modeled as the dependent variable and which are modeled as the
independent variables may be based on a presumption that the value of
one of the variables is caused by, or directly influenced by the other
variables. Alternatively, there may be an operational reason to model one of
the variables in terms of the others, in which case there need be no
presumption of causality.
are called regressors, exogenous variables,
explanatory variables, covariates, input variables, predictor variables, or
independent variables (see dependent and independent variables, but not
to be confused with independent random variables). The matrix X is
sometimes called the design matrix.
5.3.2. Analysis of Hierarchy Process (AHP)
This analysis was done with the data from the questionnaires;
Analysis of Hierarchy Process (AHP) to compare each statements from the
SWOT analysis.
The contribution to the strategic planning process comes in the
form of numerical values for the factors. New goals may be set, strategies
defined and such implementations planned as take into close consideration
the foremost factors.
The matrix of pairwise comparisons (Eq. (1)) is constructed in Step
2. In this matrix, the elementaij=1/aji and thus, wheni=j, aij=1. The value of
wi may vary from 1 to 9, and 1/1 indicates equal importance while 9/1
indicates extreme or absolute importance.
Equation(1)
In the comparisons, some inconsistencies can be expected and
accepted. When Acontains inconsistencies, the estimated priorities can be obtained by using the matrix [ Eq. (1)] as the input using the eigenvalue
technique [ Eq. (2)].
Equation(2)
where λmaxis the largest eigenfactor of matrixA;qis its correct eigenfactor; andIis the identity matrix. The correct eigenfactor, q, constitutes the estimation of relative priorities. It is the first principal
component of the matrix of pairwise comparisons. If the matrix does not
include any inconsistencies, i.e. the judgments made by a decision maker
have been consistent,qis the exact estimate of the priority vector. Each eigenfactor is scaled to sum up to one to obtain the priorities.
Saaty (1977) has shown that λmax of a reciprocal matrix A is always greater or equal to n (=number of rows=number of columns). If the
pairwise comparisons do not include any inconsistencies, λmax=n. The
more consistent the comparisons are, the closer the value of computed
λmax is to n. Based on this property, a consistency index, CI, has been
Equation(3)
CI estimates the level of consistency with respect to a comparison
matrix. Then, because CI is dependent onn, a consistency ratio CR is
calculated, which is independent ofn( Eq. (4)). It measures the coherence
of the pairwise comparisons. To estimate CR, the average consistency
index of randomly generated comparisons, ACI, has to be calculated. ACI
varies functionally, according to the size of the matrix (e.g.Saaty, 1980).
Equation(4)
As a rule of thumb, a CR value of 10% or less is considered to be
acceptable. Otherwise, all or some of the comparisons must be repeated in
order to resolve the inconsistencies of the pairwise comparisons.
Thus, the results of the comparisons are quantitative values
expressing the priorities of the factors included in SWOT analysis.
Thereby, persons formulating strategies gain access to new quantitative
information about the environment surrounding their firm to support their
decision making. They can concentrate on connecting the most important
and compatible opportunities and strengths in the strategy-building process
or see if the firm is facing some critical threats or weaknesses that must be
CHAPTER 6. RESULTS AND DISCUSSION 6.1. Country Economy
Timor-Leste as a newly-constituted country which relies on its natural
resources as a primary income of country economy, the Gross Domestic Product
(GDP) comes from diverse sources of income such as Petroleum, Agriculture,
Tourism and Taxes. Here are a few variables that should be analyzed, such as the
country economy, Analysis of the agriculture sector, GDP in agriculture sector and
GDP total. Details of the result of the analysis are provided in the next parameters
to be discussed more and further recommendations would be based on the analysis
result.
6.1.1. Petroleum Revenue
The petroleum revenue is the major income of the country’s
economy. The analysis of linear regression or Ordinary Least Square (OLS)
showed that the function of Petroleum Revenue is significant when compared
to annual population and agriculture production values. Where the overall R
corrected square is 67% with the Durbin Watson is 1,807, this is viable to
analyze by using linear regression to indicate interrelation between variables.
As indicated in the Table 1, between variables that annual
population and agriculture values are not influenced by the petroleum
revenue. The annual petroleum revenue is more influenced significantly.
Each coefficient of annual population is -0,506 or non significant to the
petroleum revenue of 4,732 (P<00,5). While agriculture production value
(0,638) is lower when compared with petroleum revenue (5,354). Although
the growth of annual population is increased the petroleum revenue is still
enough to sustain where agriculture production is also contribute to the
Table 4: Analysis of country economy base on Petroleum
Source: Own elaboration
From the result, it can be concluded that the major income of
Timor-Leste is coming from the petroleum revenue which is a significantly
influence on other sources of income in the country such as agriculture
values. Although the agriculture sector is lower however it contributes
positively to the economy of the country (Lopes, 2013).
Asian Development Bank reported that the strong economic
growth continued in 2012, with non-oil GDP expanding by 10.6%. However
high inflation is consistent with the economy’s high rate of growth. Inflation
is projected to remain high at 9.0% in 2013, but this is lower than in 2012,
reflecting some success in the government’s efforts to stem inflation (ADB,
2013).
6.1.2. Agriculture Production Value
The function of Agriculture Value includes the agriculture land
area, forest area, total equipment for irrigations, females active in
agriculture and export value of crops and livestock products. Where the
overall R corrected square is 99% with the Durbin Watson is 1,115. This is
viable to analyze by using linear regression to indicate interrelation
between variables.
significant. Table 5 shows that the following indicators: Female Active in
Agriculture (0.548), Export Value (Crops and livestock products) (0.111),
Agriculture Value added to GDP (0.653) and Forest area (0.156) are not
significant. While agriculture area (0.009) showed significant although the
total equipped irrigation (0.075) tends to be significant.
Table 5: Analysis of Agriculture Sector
Source: Own elaboration
From these results, it can be concluded that Timor-Leste has a
potential for agriculture area, while total equipment for irrigation is not
sufficient even though it tends to be available throughout the country. In
addition to these influences forest area in comparison to the other
indicators is also significantly diminished in each model.
6.1.3. Agriculture added value to GDP
The functions of the explanatory variables include export value,
female active in agriculture, rural populations and agriculture production
values.
The model of linear regression analysis indicated that almost all
variables are significant or close to (0.05) only the variable of export value
is not significant (0.545). The R square corrected is 99.7% and F value is
0.000 and Durbin-Watson is 2.685. This means that there is independence
between variables. The females active in agriculture (0.050) is significant,
rural population (0.000) is very significant and an agriculture production
value (0.052) is also significant. While the export value, female active in
means that, those variable are generally significant however their
contributions are very low to added value to the GDP in the country. While
rural populations have significantly contributed to the agriculture.
Table 6: Analysis of Agriculture added value to GDP
Source: Own elaboration
From the result on this table it can be concluded that, every year
Female active in agriculture and adult literacy are reduced significantly.
While rural population and the employment population ratio has increased
every year.
The second potential income source of the country is agriculture
which has added value to the (%GDP) in the country. There are referenced
by the International Standard Industrial Classification (ISIC), divisions 1-5,
and including forestry, hunting, and fishing, as well as cultivation of crops
and livestock production. Value added is the net output of a sector after
adding up all outputs and subtracting intermediate inputs. It is calculated
without making deductions for depreciation of fabricated assets or
depletion and degradation of natural resources (World Bank, 2015).
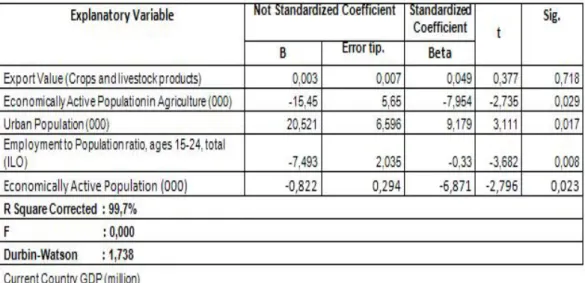
6.1.4. Total Country GDP
The functions of the explanatory variables referred the export
value, economically active population in agriculture, urban populations, and
employment to population ratio ages 15-24 and economically active
populations.
as close to 1, while the value of F is significant (0.000) and Durbin-Watson
is 1,738. In general economically active populations in agriculture and
employment to population ratio ages 15-24, urban populations are
significant whilst export value both crops and livestock products are not
significant.
The mortality economically active populations in agriculture shows
negative values (-2,735) that means that the current GDP is significant but
economically active population and agriculture have not shown their
contribution into the country GDP. While it also similar to the employment
of population ratio ages 15-24 that did not fully contributed to the country
GDP. This can be explained that participation of the population in the
country is not bringing the positive impact to the GDP. Agriculture added
value to the GDP mostly comes from other private companies or individual
farming. For instance in Timor-Leste the exportation of coffee and other
industrial plants are the major contribution to the GDP.
While the export value (0.377) is positive to the GDP however in
small amounts, urban population (3.111) are showing positive impact to the
GDP due to the accessibility of jobs centered in the urban and the
contribution of services cost to the GDP.
Table 7: Analysis of Total GDP
Source: Own elaboration
The country’s economic structure involving Industry’s and
economy relies too strongly on low-productivity agriculture for sustenance.
Contribution of non-petroleum economy appears to be contrary to the rapid
economic acceleration and transformation needed for post conflict
recovery. This recovery was related to the return of internal conflict in early
and mid-2006 and a period of severe droughts, economic activity
throughout Timor-Leste ground once more to a halt, both in Dili and in the
countryside, where agriculture and transportation were severely disrupted
(e.g., coffee production, the main non-petroleum export commodity,
declined by 20 percent11) and real non-petroleum GDP dropped by 2.9
percent for the year (USAID, 2008).
6.2. SWOT Analysis
One of the important analysis is by structuring the Strengths, Weaknesses,
Opportunities and Threats (SWOT) where this is intentionally analyzed the
possibility of sustainable development model can helps to define the future. Analytic
Hierarchy Process (AHP) is very a common tool utilized in designing this type of
model and to lead us to performing decisions. While this analysis is referred to the
sustainable development model based food sovereignty, then SWOT analysis is
also a qualitative decision to determine future agriculture development model in
Timor-Leste.
Each proposal is designed in the results of analysis by AHP alternative models are
presented in each criteria bellow:
6.2.1. Strengths
The results Analytic of Hierarchy Process is shown in the table 7
indicate that 33.13% of respondents recommended the best strength was
that 80% of population engage in agriculture as their livelihood. This means
the current population are relying on farming activities as a source of