Encouraging environmental projects in the Colombian affiliate of a chemical company
25
0
0
Texto completo
(2) Table of Contents Introduction: ................................................................................................................................................. 3 Project development: ................................................................................................................................... 4 Water recycling project: milestone for upcoming sustainability projects .................................................... 5 The necessity of information ........................................................................................................................ 8 Scope adjustment ......................................................................................................................................... 9 Methodology to be used in the carbon footprint measurement: .............................................................. 10 Scopes: .................................................................................................................................................... 11 Approach: ................................................................................................................................................ 12 General Process Mapping: .......................................................................................................................... 14 OBJECTIVE ............................................................................................................................................... 14 REACH ..................................................................................................................................................... 15 RESPONSIBILITY DEFINITION ................................................................................................................... 15 Support Areas ......................................................................................................................................... 16 DESCRIPTION OF THE PROCESS............................................................................................................... 18 Conclusions ................................................................................................................................................. 23 Literature review:........................................................................................................................................ 24. Table of Figures Figure 1 Photographs of the infrastructure installed for the recycling process. ........................................... 5 Figure 2 Estimated water savings per month after implementation of water recycling in liters. ................ 6 Figure 3 Schematic representation of the components of a water footprint. It shows that the nonconsumptive part of ...................................................................................................................................... 7 Figure 4 IFC reference diagram of the Scopes of Carbon footprint calculation ........................................ 12 Figure 5 Flow diagram of the general process of the company ................................................................. 15 Figure 6 Flow diagram of the Production Process ...................................................................................... 19 Figure 7 Flow diagram of the procurement and planning subprocess ....................................................... 19 Figure 8 Simple supply chain diagram of the company .............................................................................. 20 Figure 9 Table results of emissions given by IFC tool ................................................................................. 22. 2.
(3) Introduction:. This project seeks to study the current methodology to measure carbon emissions and the carbon footprint for a company and apply it for the affiliate in Colombia. This transnational company is based on Switzerland dedicated to the manufacture of chemical based fragrances and artificial flavors. The company, of the chemical sector, has over 125 years of experience in the production of perfumery and artificial flavors in the world. Given the nature of the production of the company, chemical extractions, the responsibility of its stakeholders is to protect not only the environment which provides the raw materials for the production but also to have an integrated sustainability strategy in order to withstand in time. Therefore, the company has its best interests to develop and continue environmentally friendly projects which will not only benefit the company itself but the environment and the community. The world business council for sustainable development3 defines sustainable development as forms of progress that meet the needs of the present without compromising the ability of future generations to meet their needs. And the company, being a member of the council, has a strong desire and will to contribute to this development by the development of various projects around the globe.. 3. 5 September 2010 [last update]. http://www.wbcsd.org/templates/TemplateWBCSD1/layout.asp?type=p&MenuId=Mjk0&doOpen=1&ClickMenu=L eftMenu#2. 3.
(4) Project development:. From a personal perspective, trying to get local management to buy into the measurement project was a difficult and challenging endeavor. Local management was not buying the idea from the beginning; they were not very much convinced of the benefits of having environmental alternatives as a way of earning money or saving money spending. As of now, the government is not addressing this important matter in terms of generating regulation that obliges companies to have actual information about carbon emissions in a strong matter. Even so, the amount of emissions of some contaminant gasses is being monitored in the city of Bogota, and there exists regulation on the matter such as protocols4 and resolutions5 which in some way are starting to regulate the environmental issue in the country. Going through all the roadblocks that this represented with the local management of the company, the idea of showing that having an economical retribution for environmental projects is possible became a necessity to be converted into reality. Then an idea with just the right characteristics occurred to the maintenance engineer in the company; and consisted of a very simple assembly of an air compressor, chemical filters, a tank and a simple pipeline. This composed a project that with a simple inversion of money and a great retribution not only economical but also environmental.. 4. Protocolo para el control y vigilancia de la contaminación atmosférica generada por fuentes fijas, Abril de 2010. Gobierno de la republica de Colombia. 5 Departamento Técnico Administrativo del Medio Ambiente (DAMA) Resolution number 1908. August 29, 2006. Resolution number 1208. September 5, 2003.. 4.
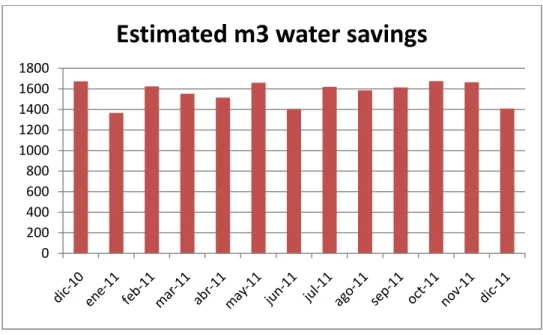
(5) Water recycling project: milestone for upcoming sustainability projects The project simply consisted on installing an air compressor to push clean water up and down the pipeline of the machinery. Such process of water recycling was easier for management to sponsor because of the immediate profitability and also because it required low investment. The venture was an easy task due to the low costing implied in the project and the great benefit in savings that its implementation represented. A small investment was necessary to roll out this initial milestone on the quest to developing projects that promote more environmentally friendly production on the company. The cost of the initiative amounted approximately USD$15,000.00 and the expected returns in savings of water expenses and reduction in the payment to the local aqueduct, of around USD$55,000.00 in one year with normal levels of consumption.. Figure 1 Photographs of the infrastructure installed for the recycling process.. The result of setting up the simple water filtering and recycling process in the company brought great benefits: environmentally speaking, the average water savings per month of approximately 1600 liters, which represent not only reduction in costs, but also a decline in the water consumption of the company.. 5.
(6) Estimated m3 water savings 1800 1600 1400 1200 1000 800 600 400 200 0. Figure 2 Estimated water savings per month after implementation of water recycling in liters.. Such savings in the process that consumes the most water shall have a strong impact when calculating the water footprint of the company. But a new challenge rose from this hypothesis: there was not a water footprint calculation before to compare and digitalize the impact. A previous analysis should have taken place in order to calculate and compare really how much the impact this recycling would have, not only on money saving, but also on the water footprint. Water usage should have been classified, and differentiated according to the type of water involved in the process. Since the water output of the machine is contaminated, and it has to be treated chemically through some filters and purification before it comes back again inside the process, these phases must be quantified and examined more thoroughly.. 6.
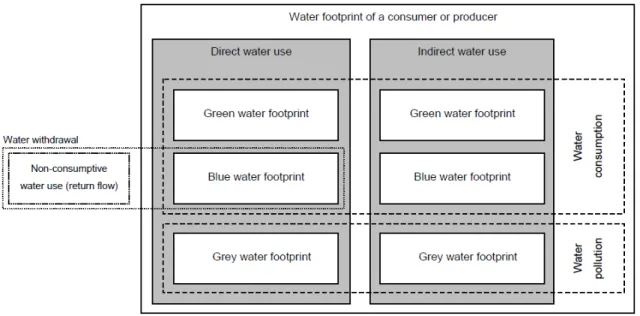
(7) Figure 3 Schematic representation of the components of a water footprint. It shows that the non-consumptive part of water withdrawals (the return flow) is not part of the water footprint. It also shows that, contrary to the measure of ‘water withdrawal’, the ‘water footprint’ includes green and grey water and the indirect water-use component.6. The results of implementing such a project changed management’s point of view almost immediately. Management now wanted the affiliate to start new projects and start thinking of new profitable and environmentally friendly solutions that might mitigate the production impact of the company. But also they became aware of the importance of information. Using this great result as an example, convincing local management in the company of believing on profitable sustainability projects became a reality.. 6. Water Footprint “Water Footprint Manual” 3 August 2010 [Last Update] P.10 http://www.waterfootprint.org/downloads/WaterFootprintManual2009.pdf. 7.
(8) The necessity of information. The next step on the long journey towards a cleaner and more economical production is obvious: gathering information. Information is the key to develop any project and to take decisions on strategic matters. On day to day life, there are numerous examples of wrong decisions taken due to lack of information and end up driving into a pitfall great and otherwise successful companies loose a great deal of their business and respect, or even enter in bankruptcy states after a badly informed decision. Such is one of the cases that companies like Kodak7 and Fuji had when the new digital camera era arrived. The companies were convinced that no other competition would arrive, and due to lack of information, they did not react on time to maintain the leadership in their sector. Key information about the overall consumption of CO2 must be gathered in order to decide and take action on further environmental developments. The company assumed as an adopted policy, to start a global deployment of sustainable projects and also to mitigate the impact on the local community where the affiliates are settled. Taking advantage of this strong interest in sustainability, each affiliate of the company has started its own sustainability projects such as the installation of solar panels on a United States facility in order to use solar energy to supply the production plant. This solar panels produce 1.2 million kilowatt hours of electricity, enough to power up the 13% of the production plant. For the affiliate in Bogota, Colombia the project is to start measuring the actual carbon footprint of the plant, and suggest solutions or reductions that may also imply cost reduction opportunities. Given that the company has recently joined the Carbon Disclosure Project 8 this project will strongly benefit the company on achieving its sustainability goals as well as improve the 7 8. Fine, Charles H., Clock Speed, 1998, P.36 5 September 2010 [Last Update] https://www.cdproject.net/en-US/Pages/HomePage.aspx. 8.
(9) advances on these fields for Colombia. The goal is to achieve knowledge of the carbon emissions through a year of production actually and to suggest ways or projects to reduce these emissions. Given the new strategy placed to achieve by 2015, the company has committed to reduce CO2 emissions globally by 15% in absolute terms. In order to accomplish this goal, the company first requires having certainty on the actual emissions on each manufacturing site. In order to perform this measurement for the Colombian affiliate, the first step is to define the scope of the measurement. For the purpose of performing a first calculation, the measurement follows the methodology proposed by the Green House Gas (GHG) protocol and the International Finance Corporation (IFC)9.. Scope adjustment Due to timing and resource availability local management decided not to give the first priority to the measurement project. Unfortunately at the same time that the project should have taken place, the Latin American affiliates started off with a much bigger project in terms of resource allocation and time consumption of all employees: a new ERP program deployment. This represented a huge challenge for the ongoing sustainability project and had a negative impact on the speed and outcome of it. Even so, the project kept going on parallel, not with the speed required or the attention, but it firmly stood by. Because of this change in the conditions to develop the project of measurement, such as their request to dedicate the most of the resources to the ERP implementation, the scope of this particular delivery will not cover the measurement to fulfillment at the extent that it was initially. 9. 15 October 2010 [Last Update] http://www.ifc.org/climatechange. 9.
(10) pretended. This does not imply it will not be developed in the future, since the most difficult part has been overcome: the convincing of management to believe and sponsor sustainable oriented projects. Information is still needed in order to start projects on a mid and long term period. However, advances in the project are not disregarded, since they will be the stepping stone for future measurements of greater scopes, after the ERP go live. Even so, the early stages of information gathering, documentation and also methodology were started and serve as the guidance for the future culmination of the assignment in deeper scopes. Also, a great achievement was to manage the alignment for all Latin American affiliates on using the same methodology which will then make it easier for comparisons and to replicate possible solutions to the same problem on different countries.. Methodology to be used in the carbon footprint measurement:. The most widely-used carbon accounting methodology by private business is the GHG Protocol, established by the World Business Council for Sustainable Development (WBCSD) and the World Resources Institute (WRI)10. The IFC-Carbon Emissions Estimator Tool (CEET) is based on the GHG Protocol. In order to cover most IFC business and investment sectors, the IFCCEET complements the GHG Protocol with additional Intergovernmental Panel on Climate Change (IPCC) data, emission data and methods already employed and tested by the Agence Française de Développement (AFD), and internal IFC sectored carbon accounting already in place. The result is a tool with the benefits of: 10. Encompassing most IFC business sectors in one tool. www.ghgprotocol.org/. 10.
(11) . User-friendly, without the need to navigate complicated sector-specific tools. . Requiring input data likely available to appraisal officers. . Capable of calculating alternate emission scenarios for process improvements. . Establishing a carbon coefficient for estimating emissions over a project’s life. . Standardizing IFC carbon accounting data across sectors. Scopes: Accepted international practice classifies carbon emissions into scopes:. . Scope 1: Direct GHG emissions occur from sources that are owned or controlled by the company, for example, emissions from combustion in owned or controlled boilers, furnaces, vehicles, etc.; emissions from chemical production in owned or controlled process equipment.. . Scope 2: Accounts for GHG emissions from the generation of purchased electricity, heat, and steam consumed by the company. Purchased electricity, heat, or steam is defined as that purchased or otherwise brought into the organizational boundary of the company but emissions physically occur at the facility where electricity, heat, or steam is generated.. . Scope 3: An optional reporting category that allows for the treatment of all other indirect emissions. Scope 3 emissions are a consequence of the activities of the company, but occur from sources not owned or controlled by the company. Some examples of scope 3 are the indirect emissions from a company’s upstream and downstream activities, such as. 11.
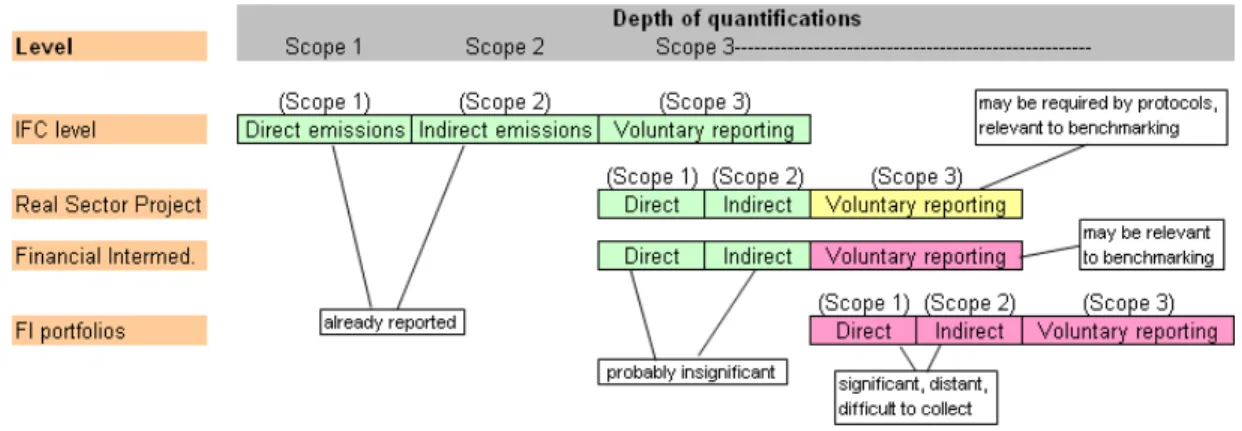
(12) emissions associated with outsourced/contract manufacturing, leases, or franchises or the use of sold products and services. The accepted international standard requires measuring and reporting on Scopes 1 and 2, while reporting on Scope 3 is for the most part optional. For IFC, Scope 1 emissions are limited to any fuels burned directly in the various IFC offices. Scope 2 emissions cover any electricity or purchased heating consumed in those same offices. IFC’s Scope 3 emissions include business travel related emissions, emissions related to the commuting of its employees, and the emissions associated with the activities that it finances, i.e. its portfolio. IFC currently only reports on Scope 3 emissions arising from its business travel. By measuring the footprint of its portfolio, IFC is enhancing the measure of its own Scope 3 emissions. The following diagram illustrates the breakdown of IFC’s three scopes:. Figure 4 IFC reference diagram of the Scopes of Carbon footprint calculation. Approach: IFC will limit footprint measurement to Scopes 1 and 2 of its investment portfolio as illustrated above (at least in a first phase), although diverse departments of the company are encouraged to also estimate Scope 3 impacts to the extent possible and relevant. A model should be developed. 12.
(13) at appraisal for each project that the company is undergoing, based on a simple carbon coefficient measurement. This carbon coefficient is calculated as the tons of CO2 -equivalent emitted per unit of production. Annual updates would occur through the supervision process by updating the relevant measurement units relative to increases in production and revenue, proportional to resource usage. Updates of the coefficient would not normally be required unless process changes that have significant impact on GHG production (e.g. fuel or technology switch) have taken place. In order to accommodate multiple product lines in a given project, revenues (rather than physical output) could be taken as the measurement unit. This methodology is to be applied starting July 1, 2008 for the operational processes of the Colombian affiliate up until June 30 2009. For financial intermediary and similar projects, reporting on Scopes 1 and 2 is likely to be of limited significance (and limited operational use to IFC). An Excel11 file downloaded from the IFC website will be used to calculate the emissions based on the methodology proposed by the IFC. This tool may be modified to fit the purposes of the measurement specifically for the company. The first step is to define briefly the processes that take place on the company to be able to identify which ones will be measured and how this will impact the overall measurement. The methodology that will be used to measure the carbon footprint for the Colombian affiliate will be based on a broad gathering of information from Fiscal Year 2009 which comprehends July 2008 through June 2009. This information will be then analyzed using the. 11. www.microsoft.com. 13.
(14) current methodology explained by the Green House Gas Protocol Organization 12 which explains the standards to use in order to measure correctly the carbon footprint of a company. The first step for the measurement will be done by extracting the data of fiscal year 2009, developing interviews with the maintenance Chief, the Manufacturing Manager and the Logistics Manager in order to obtain all necessary information to measure the carbon footprint. Once the carbon footprint is calculated, the idea is to provide suggestions in order to reduce the emissions of the company and also reduce costing on the supply chain. First of all, process mapping must take place to identify the steps which represent most of the carbon emissions of the company.. General Process Mapping: Colombian Affiliate. OBJECTIVE. The general organizational process describes the activities related to the design, production distribution and commercialization of the finished goods sold based on the requirements of the customer or the identification of market opportunities, up until the delivery of the finished good on time; and at the same time reflecting the interaction of the support areas with the management review process.. 12. http://www.ghgprotocol.org/. 14.
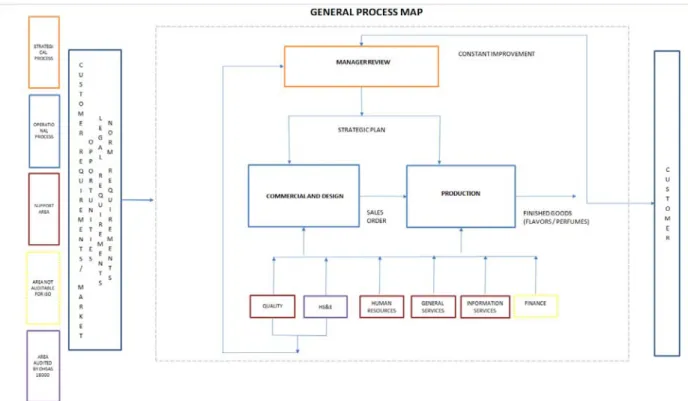
(15) REACH. The process applies to the design, manufacturing and sales of flavors and fragrances in Firmenich Colombia.. Figure 5 Flow diagram of the general process of the company. RESPONSIBILITY DEFINITION. The owner of the process is the direction committee which is composed by the General Manager, Commercial Directors and the Plant Manager, who ensure that the process is well defined and managed by those involved, according to the company's strategic guidelines. The processes 15.
(16) referred to in this map are usually evaluated with specific indicators, which are managed by the Commercial Director and Plant Manager, who are responsible for taking the actions required to improve each process where necessary. The Perfumes and Flavors divisions are responsible for the design and product selection, market research and customer management.. The supply chain is responsible for planning, material procurement, production, storage, shipping and timely delivery of finished product.. Everyone in the organization must comply with regulations related to health, safety, quality and safety (where applicable) set.. Support Areas. Concerned with providing support to facilitate the effectiveness of organizational processes, in order to deliver timely within the customer’s requirements, the finished product with quality and other conditions.. - Human Resources: It functions by providing appropriate staff and support during the life cycle of staff working in the organization.. 16.
(17) - Information Systems: Managing the implementation and maintenance of software and hardware, and provides technical assistance to all users.. - Quality: Comprises the following divisions:. - Quality Control: It is in charge of analyzing features and release raw materials and finished products. Also provide support for handling non-compliant products.. - Quality Assurance: The main function is to lead and work for the establishment of a culture of identity with the quality system by the organization. It is also responsible for implementing, managing and improving quality management systems and safety.. - General Services: is responsible for the management of physical resources of the company. It is the leader in the cleaning and disinfection programs in all non-productive areas, as well as pest control program, and handling and disposal of all waste.. - HS & E (Health, Safety and Environment): The main function is to lead and work for the establishment of a culture of identity with the health management system, safety and environmental protection. Also must ensure compliance with environmental regulation and occupational health in the operation of the organization.. 17.
(18) DESCRIPTION OF THE PROCESS. The general process describes the sequence of steps to design, manufacture and commercialize flavors and fragrances. It begins with customer requirements or market opportunities, which are entered into the system as a project, and culminates with the delivery of the finished product.. A brief description of each of the processes and areas that make up this general map:. Management Review: The steering committee is responsible for the viability, vitality and effectiveness of integrated management system. Hence, this committee defines and leads the management policy, provides resources and ensures that the effectiveness is evaluated through the indicators of each of the processes.. Commercial and Design (Perfumes and flavors): This process involves two main activities. The first is business management that includes regular orders from customers. The second is in charge of projects, which starts with customer requirements, market opportunities or internal applications, and are developed to create a new product or select an existing one to be submitted and approved by the customer.. Production: The process begins from planning and procurement to manufacturing and delivery of finished product back to the client. I make threads and Manufacturing Planning and Purchasing, Warehouse and Offices. 18.
(19) Figure 6 Flow diagram of the Production Process. Figure 7 Flow diagram of the procurement and planning subprocess. 19.
(20) In order to proceed with the calculation of the carbon footprint an inventory of the facilities should be started in order to evaluate emissions depending on the equipment used, and the amount of general usage of energy and resources for a specific product. This requires that the measurement takes places throughout the supply chain of the company and also that a specific process type is defined for each product type, so that the right amount of emissions is calculated and assigned to a specific product.. Figure 8 Simple supply chain diagram of the company. A boundary should be set in order to consider the emissions in the carbon footprint of the supply chain. Since subcontracting takes place in the transportation nodes of the supply chain, these emissions are considered out of the first stage of the measurement scope. For an initial purpose, the company wants to focus on the manufacturing stage of the emissions.. 20.
(21) . Gas and electricity usage in production. . Alternative fuel usage. . Emissions from employees administrative facilities. . Waste disposal and Obsolete inventories. Information gathering for the mentioned points must take place and be used within the tool provided by the IFC. For the first approach of the measurement, given the information provided by the different interviews of the local management the results are:. 21.
(22) Section 4. CEET Calculations and Results IFC Project Name: IFC Contacts:. COLOMBIAN AFFILIATE CALCULATIONS DIEGO ALEJANDRO BONILLA. IFC#: Total Production (tonnes). Date CEET Completed: 1,000. January 0, 1900. $30,000,000. Total Revenue (US$) IFC Share of Financing. Gross Project Emissions Construction. 0. Alternate Project Emissions Construction. 0. Clearing Infrastructure. 0 0. Clearing Infrastructure. 0 0. Materials. 0. Materials. 0. Fuel. 0. Fuel. Operations Sc ope 1 (total). 123,374 123,340. 0. Operations Sc ope 1 (total). 0 0. Fuel Consumption. 10,593. Fuel Consumption. 0. Geothermal Gases Waste. 0 239. Geothermal Gases Waste. 0 0. Wastewater. 0 0. Wastewater. 56 0. Other Emissions Gas Flaring. 0. Other Emissions Gas Flaring. Cement Prod.. 0. Cement Prod.. 0. Metal Prod. Reservoirs. 0 0. Metal Prod. Reservoirs. 0 0. 0. Forestry. -141,000. Forestry. 0. Land Use Livestock. 253,273 0. Land Use Livestock. 0 0. Chemicals Prod.. 0. Chemicals Prod.. 179. Glass Prod.. 0. Glass Prod.. 0. Lime Prod. Oil and Mining. 0 0. Lime Prod. Oil and Mining. 0 0. Electronics. 0. Electronics. 0. Refrigeration/AC. 0. Refrigeration/AC. 0. Sc ope 2 (total). 34 34. Electricity Other Emissions Other Calculations. Sc ope 3 (total). 0 0. 0. Absolute Project Emissions (t CO2-eq). Sc ope 2 (total). 0. Electricity. 0. Other Emissions Other Calculations. 0 0. Sc ope 3 (total). 0. Emission Scenario Comparison. Scope 2, 0.0%. Scope 1, 100.0%. 100.0%. 0.0%. Gross. Alternative. Figure 9 Table results of emissions given by IFC tool. At first glance, when the data is analyzed, the results were more than evident. Land use generates the most carbon emissions (95% of all the emissions of the affiliate). This is given due to the great land extension used for the chemical extraction and production. The strong flavor production in Latin America is the citrus family, and for perfumery the patchouli plant extraction. 22.
(23) is one of the most used ingredients for the company’s production. This raw material extraction uses up a great extension of the land. To mitigate the impact of land usage emissions, foresting should be implemented so that the crop replacement on the area previously used for chemical raw material production. New crops that equilibrate the minerals on the soil, and produce oxygen, help diminish the emission total because they count as a negative carbon emission. The process that generates the following high amount of carbon emissions is the pulverization of liquid flavors inside the spray dryer machine. Fuel consumption, necessary to generate enough heat and pressure to pulverize a liquid flavor and merge the flavor with the starch based powder, is the greatest source of the emissions produced inside the company in production.. Conclusions . The intension of the present project is not only to gather important information about the carbon footprint of the company but also to change the mentality of management towards sustainable and profitable efforts.. . Thanks to the results obtained in the water recycling project implementation, now local management is eager to develop projects involving the environment impact mitigation and also that have an economical return in the process.. . Results were considered to provide the Company with more clues about the effectiveness that can be reached by dropping carbon emission over its supply chain. Using this. 23.
(24) information, the company now can look for more efficient sources of energy for its production processes and also reduce the emission impact by land substitution.. Literature review:. The following sources have been checked in order to extract the necessary information for the project.. . “ABC. of. Awareness”. Rohrer,. Jürg. 5. September. 2010. [Last. Update]http://timeforchange.org/sites/timeforchange.org/files/ABC%20of%20Awareness %20A4_0.pdf . “CDP. Cities. Report. 2008”. 25. September. 2010. [Last. Update]https://www.cdproject.net/CDPResults/65_329_216_CDP-CitiesReport.pdf . “CDP. Global. 500. Report. 2009”. 25. September. 2010. [Last. Update]https://www.cdproject.net/CDPResults/CDP_2009_Global_500_Report_with_In dustry_Snapshots.pdf . “CDP. Supply. Chain. Report. 2010”. 25. September. 2010. [Last. Update]https://www.cdproject.net/CDPResults/CDP-Supply-Chain-Report_2010.pdf . “Literature Review on carbon footprint collection and analysis”, Robert Brewer 2008 [Last Update] http://csdl.ics.hawaii.edu/techreports/09-05/09-05.pdf. . Fine, Charles H., “Clock Speed”, 1998. 24.
(25) . Green. House. Gas. Emissions. for. Colombia. 5. September. 2010. [Last. Update]http://unfccc.int/files/ghg_data/ghg_data_unfccc/ghg_profiles/application/pdf/col _ghg_profile.pdf . Kyoto. Protocol. 5. September. 2010. [Last. Update]http://unfccc.int/resource/docs/convkp/kpeng.pdf . Personal Interviews with Colombia employees of the analyzed company (Maintenance Chief, Manufacturing Manager, Logistics Manager). . United Nations World Water Development Report 25 September 2010 [Last Update]http://www.unesco.org/water/wwap/wwdr/wwdr3/. . Water. Footprint. “Water. Footprint. Manual”. 3. August. 2010. [Last. Update]http://www.waterfootprint.org/downloads/WaterFootprintManual2009.pdf. 25.
(26)
Figure

+5


Documento similar
In the “big picture” perspective of the recent years that we have described in Brazil, Spain, Portugal and Puerto Rico there are some similarities and important differences,
The characteristics of these projects allow us to conclude that by comparing the same number of prices in Building and Civil Works, a bigger amount of the budget is validated
Astrometric and photometric star cata- logues derived from the ESA HIPPARCOS Space Astrometry Mission.
In addition to traffic and noise exposure data, the calculation method requires the following inputs: noise costs per day per person exposed to road traffic
Professional construction management refers to a project management team consisting of a professional construction manager and other participants who will carry out the tasks
Government policy varies between nations and this guidance sets out the need for balanced decision-making about ways of working, and the ongoing safety considerations
No obstante, como esta enfermedad afecta a cada persona de manera diferente, no todas las opciones de cuidado y tratamiento pueden ser apropiadas para cada individuo.. La forma
The expansionary monetary policy measures have had a negative impact on net interest margins both via the reduction in interest rates and –less powerfully- the flattening of the
