injuries in Spain focusing on type of involved vehicle and driver culpability
Susana García-Herrero
Ingeniería Civil, Escuela Politécnica Superior, Universidad de Burgos, Spain. E-mail: [email protected] School of Architecture and Cities, University of Westminster, UK. E-mail: [email protected] Rachel Aldred
School of Architecture and Cities, University of Westminster, UK. E-mail: [email protected]
Esther Anaya-Boig
Centre for Environmental Policy (CEP), Imperial College London, UK. E-mail: [email protected]
Miguel. A. Mariscal
Ingeniería Civil, Universidad de Burgos, Spain. E-mail: [email protected]
The goal of this research is to explore the role of the collision partner – vehicle type and driver culpability – in incidents involving injuries to people cycling. Previous research has explored a range of factors affecting cyclist injury severity, but were more frequently focused on cyclist behaviour and/or road conditions.
The database for our study includes a total of 12,318 drivers or riders of any vehicles involved in traffic injuries with victims in Spain in 2016, of which 7,488 are injured bicycle riders. The database used in our research was provided by Spain’s National Traffic Department (Dirección General de Tráfico - DGT).
This research uses Bayesian machine learning techniques. These have been recently used to study the severity of traffic injuries, since they provide a sound methodology for analyzing their causes and risks and predicting the probability of traffic injuries with serious injuries or fatalities.
We have found proof that involvement of heavy vehicles substantially increases the likelihood of cyclists being killed or seriously injured, and that drivers are more likely than cyclists to be held responsible for the injury.
Keywords: road injuries, driver behaviour, Bayesian network, cyclists, vehicle type, culpability.
1. Introduction
Policy-makers across Europe seek to increase cycling levels, for reasons ranging from health, to air pollution and congestion reduction. However, traditionally cycling has been viewed as a risky mode and fear of road injury is a major disincentive to cycling (Horton, 2007). Thus, despite the substantial net health benefit of a growth in cycling in almost all settings (Mueller et al, 2015), a reduction in injury risk remains important, as does a reduction in the likelihood of cyclists experiencing the most severe injuries.
Cyclists’ safety remains largely unexplored in Spain, with the exception of a study of mortality risks by age and sex (Martínez-Ruiz et al, 2015). Cycle safety in this country, though, has not improved over the last years. While the number of cycling casualties has remained stable, injured cyclists who required hospitalisation almost doubled and those who did not require
hospitalisation, more than tripled from 2007 to 2016 (Dirección General de Tráfico, 2017).
While previous research explores cyclist behaviour, road conditions, and safety perceptions, this paper moves the focus away from the cyclist to the ‘collision partner’ involved in the incident, examining both the type of vehicle involved and the attribution of culpability (note that this is the opinion of the investigating police officer, and does not necessarily involve any proven traffic infractions). We ask (i) what relationship does the collision partner have with the risk of a more severe injury or death? (ii) where culpability is attributed to the cyclist and/or the collision partner, how does this vary? These questions have implications for policy ranging from engineering measures to which road users should be the focus of enforcement and the design and targets of education programmes.
Proceedings of the 29th European Safety and Reliability Conference. Edited byMichael Beer and Enrico Zio
Copyright c 2019 European Safety and Reliability Association. Published byResearch Publishing, Singapore.
2. Cyclist injuries: severity and culpability
Previous research has examined factors predicting cyclist injury severity, using police injury data from a range of settings. For instance, a study from the Czech Republic (Bíl et al, 2010) identifies demographic factors leading to increased vulnerability to serious injury, specifically male gender and older ages. The heightened risks experienced by men and by older people is something that has been found across road user groups and when controlling for exposure (Feleke et al, 2018, Scholes et al, 2018). Along similar lines, the above-mentioned Spanish study (Martínez-Ruiz et al, 2015) found that contributions of exposure, risk of crash and fatality to cyclist death rates were strongly associated with age and sex. In particular, death rates increased with age, the main component of this increase was fatality (around 70%), and males had higher death rates than females in every age group.
Morgan et al (2010) found that, as in a previous study, HGVs (trucks) were substantially over-represented among cycling fatalities in London. Specifically, between 1992 and 2006 freight vehicles were involved in 43% of all incidents and the vehicle was making a left turn (=right turn in other European countries) in over half of these. Moore et al (2011) found that the involvement of a truck or a van in the State of Ohio, US, was associated with a higher risk of cyclist injury severity, and that this was substantially greater than the increased injury severity risk associated with the cyclist not wearing a helmet. In another US study, Kim et al (2007) found that truck involvement more than doubled the probability of a cyclist experiencing a fatal injury. In Denmark, Kaplan et al (2014) found heavy vehicle involvement to be an aggravating factor, while cycle infrastructure reduced injury severity.
Existing research examines the role of safety clothing in cyclist injury severity, with many studies on helmet use (Bíl et al 2018), in particular. However, research has less frequently analysed fault or culpability attributed to different road users involved in collisions. Bíl et al (2010) found that in the case of fatalities involving cyclists and motor vehicles, police more often attributed fault to the driver than to the cyclist. Similarly, a study from the UK (Knowles et al 2009) found that drivers were more often held by police to have contributed to an injury collision than cyclists, although this finding differed for adult and child cyclists, with children much more likely than adults to be held responsible for incidents in which they were injured.
While studies are few, these findings are interesting as in the popular imagination in many country contexts (e.g. the UK: Aldred 2013)
cyclists are often perceived to be incompetent road users because (unlike motorists, but like pedestrians) they are not required to pass any test to use the roads. In this paper we do not just compare assigned culpability for drivers and cyclists, but also compare different groups of drivers by vehicle type. This allows us to explore the extent to which driver culpability might aggravate or mitigate inherent risks associated with vehicle size and design, and to compare buses and heavy goods vehicles.
3. Methodology.
In this section, we firstly explain the methodology used in this work. The data used in this study are shown and explained below. Finally, the variables used in the proposed Bayesian network model are defined.
3.1 Bayesian Network.
Discrete Bayesian network is the methodology used for the elaboration of the model of this research work. Bayesian network concept is defined by Castillo, Gutiérrez et al. (1997) as a probabilistic model defined by a Directed Acyclic Graph (DAG) and a set of conditional probability functions, so that the structure of dependence / independence showed by the DAG can be expressed in terms of the joint of the probability function by the product of several conditional
First, the model is defined by a DAG Graphic and the Joint probability function. Second, the probability of one node showing an evidence in one or several variables is calculated using Bayesian networks inference. For example, in this study, one aim is to determine the impact of the type of vehicle in the severity of injury experienced by the cyclist e.g.
(ܫ݆݊ݑݎݕݏ݁ݒ݁ݎ݅ݐݕݎ݅ݏ݇|ܶݕ݂݁ݒ݄݈݁݅ܿ݁) (2)
a probability, obtaining the corresponding ratio of true (HIR: Hit Rate) and false (FAR: False Rate Alarms) positives leading to the ROC curve. As a summary of the information given by the ROC curve, and for the sake of the inter-comparability between classifiers, the Area under the curve (AUC) is considered as a measure of the skill of the model obtained. This measure ranges between 0 and 1, corresponding to a perfectly opposite
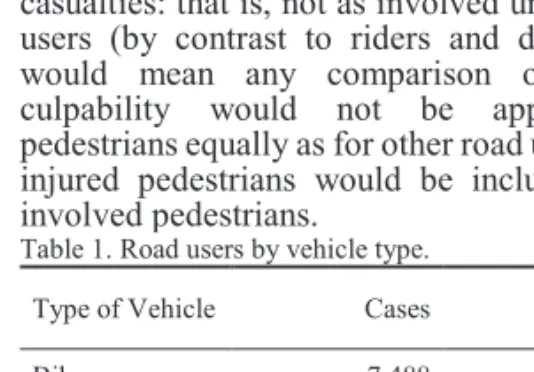
The dataset used in this study comes from the official database of traffic injuries that occurred in Spain during the year 2016. The dataset was provided by Spain’s National Traffic Department (DGT 2019). The original dataset consists of a total of 102,362 collisions with 174,679 drivers. This study uses a subset comprising all drivers and riders of any vehicle involved in a collision in which a cyclist was injured, that is 12,318 drivers, cyclists, and motorcyclists (see table 1).
Note that pedestrians are not included in this dataset. While bicycle-pedestrian collisions are present in the wider dataset, they make up a relatively small proportion of cases. Further, pedestrians would only be present in the data as casualties: that is, not as involved uninjured road users (by contrast to riders and drivers). This would mean any comparison of attributed culpability would not be applicable for pedestrians equally as for other road users, as only injured pedestrians would be included, not all involved pedestrians.
Table 1. Road users by vehicle type.
Type of Vehicle Cases % Cases
Bike 7,488 60,8%
Source:Data from the DGT (Spain)
3.3Variables.
The variables used in this study are: Type of vehicle (see table 2), place-bike (if the collision happened in a location with cycle infrastructure or not), zone (if the collision has taken place in a local street or not), zone 30 (the speed limit in the area of the collision), node (if it was in an intersection or not), weather condition (meteorological condition the day of the collision), road condition (the surface of the road), light (day or night), visibility (good or not), age, gender, driving-licence (updated or not), seat-belt (yes or not), helmet (yes or not), infringement (yes or not), speed infringement (yes or not), other infringement (yes or not), responsibility (whether or not the police officer has identified the driver responsible of the accident), driver distraction (yes or not), driver errors (yes or not), driver-severity (whether a driver/rider was seriously injured in the collision) and max-severity-bike (our principal dependent variable, indicating the highest severity level for a cyclist in each collision; note that in a minority of collisions more than one cyclist was injured).
The variables driver-severity and max-severity-bike have two values: firstly, a ‘light’ injury, and secondly a death or serious injury (‘KSI’). The article examines the factors associated with an injury to a cyclist being a KSI rather than a slight injury.
4. Results
4.1 Probability of cyclist death or serious injury by type of vehicle.
We examine the probability of a cyclist being killed or seriously injured by the type of vehicle involved (collision partner). We identified the collision partner for each cyclist as being the largest vehicle involved in the incident (in most cases, only one or no other vehicle was involved). Where more than one vehicle of the same type was involved (e.g. two cars) we randomly selected one as being the ‘collision partner’.
4 S.García-Herrero et al.
Source:Compiled by the authors (AUC=0.908-0.954).
The highest injury severity risk for cyclists is associated with the involvement of larger vehicles. In particular, trucks (HGVs) are associated with death or serious injury to the cyclist with a 24% of probability. By contrast, where the collision partner is another bicycle (11%), a bus (13%), a car (10%), or a motorcycle (6%) the risk of serious injury to the cyclist is lower. Note that the risk where cars are involved (10%) is similar to the risk for all cases, as in most cases a car is the collision partner.
4.2 Driver Injury severity by mode for collisions involving cyclists
Table 3 below illustrates the probability of other road users being seriously injured, for our dataset of collisions involving a cyclist injury. It has been calculated using Bayesian inference, with driver-severity as a target variable and the type of vehicle variable as evidence. Unsurprisingly, cyclists had the highest probability of being killed or seriously injured (10.3%), followed by motorcyclists (4.8%). By contrast, the drivers of cars, trucks and buses have a lower probability of a serious injury, at 0.1%, 0.001 % y 0.001% respectively.
Table 3. Probability of serious injury or death by road user type, all collisions in which a cyclist was injured.
Type of Vehicle Probability
Source:Compiled by the authors (AUC = 0.704-0.746)
4.3 Probability of culpability by type of vehicle.
Next we examine the extent to which different vehicle users are held responsible for an incident. This data is subjective in that it is the opinion of the investigating officer recorded at the scene; this is the data available to us and it does represent an expert opinion. However, it could be affected by institutional biases within police services.
The results shown in table 4 have been obtained by using Bayesian inference. Responsibility has been considered as the target variable, being the type of vehicle variable the evidence.
Table 4. Probability of being identified as responsible, all cases involving injury to a cyclist.
Type of Vehicle No Yes Unknown
Bike 0,29 0,33 0,38
Source:Compiled by the authors (AUC=0.882-0.921).
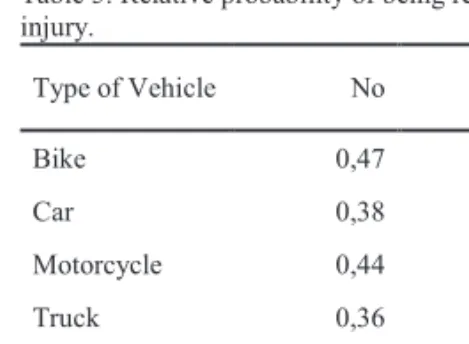
Relative probabilities are shown in table 5. Table 5 excludes cases where culpability was not clearly identified in relation to the road user in question (i.e. the investigating officer decided that it could not be known whether the road user was or was not culpable). In 53% of the cases the cyclist was held to bear some culpability for the injury, whereas in 47% of cases the cyclist was seen to have had no responsibility. The figures for motorcyclists were slightly higher, with 56% of motorcyclists being held culpable (again, for cases where the officer felt they could clearly identify whether the road user was culpable).
5 Table 5. Relative probability of being responsible in case of
injury.
Type of Vehicle No Yes
Bike 0,47 0,53
This analysis highlights the importance of looking not only at the cyclist involved in an injury collision, but also at the collision partners/other road users involved. For incidents in which a cyclist is involved, the likelihood of serious injury to other vehicle users involved in the incident is extremely low. This confirms the traditional perception of cycling as a vulnerable (albeit healthy) mode.
When we explore the involvement of other vehicles, the picture becomes more complex. Firstly, the elevated risk posed to cyclists by large vehicles is revealed. Once a cyclist is involved in an incident with a bus or a truck, the likelihood of them being killed or seriously injured rises substantially, approximately doubling the likelihood of death or serious injury where a car is involved.
These findings are similar to those obtained in other studies of HGV (truck) involvement and cyclist injury severity. Even at relatively low speeds, larger vehicles are associated with higher injury severity when involved in crashes with cyclists. This implies the need for interventions that can reduce the risk of collisions in the first place; which could include: urban logistics management, restrictions to HGV access to (some of) the road network, infrastructural changes to physically separate people cycling from large vehicles, and ‘direct vision’ standards that increase the ability of the driver to see a cyclist where interaction does occur.
We further explored culpability of different road users in relation to collisions injuring cyclists. While caution should be applied in interpreting these findings due to the subjective element of the culpability judgements (including that where a road user has died or been seriously injured, his or her explanation of the incident
cannot be obtained at roadside) they are still important as representing an immediate expert opinion on an incident. One might expect that professional drivers trained to drive for a living (representing all those driving trucks and buses, for instance) would be responsible in fewer collisions than non-professional drivers (the majority of car drivers, motorcyclists, and cyclists). However, we did not find this, which for HGVs might be related to issues linked to vehicle size, such as the blind spot effect.
We discovered that injured cyclists were only recorded as bearing some culpability in around half of the cases, exactly 53% (culpability does not imply an infraction but might be related for instance to failing to look properly when negotiating a junction). In 47% of cases where a cyclist’s responsibility was identified, they were found to have borne no responsibility for the crash that injured them. This is an important policy finding in a context where many cities and countries are seeking to encourage active travel modes, for reasons ranging from health benefits due to increased physical activity, to air pollution benefits from decreased levels of car use.
In cases involving injury to a cyclist (and remembering the very low risks of serious injury to other vehicle users) most types of other vehicle users were held more likely to be culpable. The exceptions were motorcyclists (also usually identified as ‘vulnerable road users’ and involved in a relatively low proportion of cases).
For car, bus and HGV drivers, levels of identified culpability are higher than for cyclists (62%, 62% and 64% respectively). Most car drivers are not professional drivers, but in order to drive it is compulsory to have passed a driving test as an adult. Despite this, levels of attributed culpability are higher than for cyclists, in these incidents. Bus drivers are more likely to be held culpable than cyclists (who in most cases have more likely in many urban contexts to be involved in injury collisions with vulnerable road users, per km (Russell and Comi 2017).
centres (TfL 2018). Further research into circumstances surrounding injury collisions would allow some of these factors to be teased apart, exploring the contrasting and related roles of vehicle design, infrastructure, and social factors such as the organisation of freight and logistic services. Similar analysis should also be conducted for pedestrian injuries, which also make up a high percentage of casualties in many urban areas
.
Acknowledgement
This work presents part of the results of the research project “Modelización mediante técnicas de machine learning de la influencia de las distracciones del conductor en la seguridad vial. Ref. BU300P18”, supported by funds from FEDER (Fondo Europeo de Desarrollo Regional) from Junta de Castilla y León.
References
Aldred, R. (2013
),
Incompetent or Too Competent? Negotiating Everyday Cycling Identities in a Motor Dominated Society, Mobilities 8, pp. 252-271Bil, M., Bílová, M. and Müller, I. (2010) Critical factors in fatal collisions of adult cyclists with automobiles, et alAccident Analysis & Prevention, 42(6), pp. 1632-1636
Bíl, M., Dobiáš, M., Andrášika, R., Bílová, M. and Hejna, P. (2018) Cycling fatalities: When a helmet is useless and when it might save your life, Safety Science, 105, pp. 71-76
Castillo, E., J. M. Gutiérrez and A. S. Hadi (1997). Expert systems and probabilistic network models, Springer Verlag.
DGT. (2019). "Subdirección Adjunta de Investigación e Intervención de la Dirección General de Tráfico." from
http://www.dgt.es/es/seguridad-vial/investigacion/.
Dirección General de Tráfico, 2017. Las principales cifras de la siniestralidad vial. España 2016 (Main Figures on Road Safety Data. Spain 2016). Dirección General de Tráfico, Madrid.
Elerua, N., Bhat, C.R. and Hensher, D.A. (2008), A mixed generalized ordered response model for examining pedestrian and bicyclist injury severity level in traffic crashes, Accident Analysis & Prevention 40(3), pp. 1033-1054
Feleke, R., Scholes, S., Wardlaw, M.W. and Mindell, J.S. (2018) Comparative fatality risk for different travel modes by age, sex, and deprivation, Journal of Transport & Health, 8, pp. 307-320
Horton, D. (2007), Fear of cycling, D. Horton, P. Rosen, P. Cox (Eds.), Cycling in Society, Ashgate, Aldershot (2007), pp. 134-152
Kaplan, S., Vavatsoulas, K. and Prato, C.G. (2014) Aggravating and mitigating factors associated with cyclist injury severity in Denmark, et al 2014Journal of Safety Research 50, pp. 75-82
Kim Kim, J-K., Kim, S., Ulfarsson, G.F., Porrello, L.A. (2007) Bicyclist injury severities in bicycle–motor vehicle accidents, et al 2007Accident Analysis & Prevention, 39(2), pp. 238-251
Knowles, J., Adams, S., Cuerden, R., Savill, T., Reid, S. and Tight, M. (2009) Collisions involving cyclists on Britain’s roads: establishing the causes (PPR445), Transport Research Laboratory, Berkshire.
Moore, D.N., Schneider, W.H., Savolainen, P/T/. Farzaneh, M. (2011) Mixed logit analysis of bicyclist injury severity resulting from motor vehicle crashes at intersection and non-intersection locations, Accident Analysis & Prevention 43(3), pp. 621-630et al 2011
Morgan, A.S., Dale, H.B., Lee, W.E. and Edwards, P.J. et al( 2010)Deaths of cyclists in london: trends from 1992 to 2006, BMC Public Health 2010 10:699
Mueller N., Rojas-Rueda, D., Cole-Hunter, T., de Nazelle, A., Dons, E., Gerike, R., Götschi, T., Int Panis, L., Kahlmeier, S. and
Nieuwenhuijsen, M. (2015)Mueller, N. et al – systematic review health impact models. Health impact assessment of active transportation: A systematic review. Preventive Medicine 76, pp. 103-14.
Russo, F. and Comi, A. (2017) From the analysis of European accident data to safety
assessment for planning: the role of good vehicles in urban area, European Transport Research Review, 9:9.
2005–2013, Journal of Transport & Health, 8, pp. 321-333