When product diversi
fication influences life cycle impact assessment: A
case study of canned anchovy
Jara Laso
a,⁎
, María Margallo
a, Pére Fullana
b, Alba Bala
b, Cristina Gazulla
c, Ángel Irabien
a, Rubén Aldaco
aa
Departamento de Ingenierías Química y Biomolecular, Universidad de Cantabria, Avda. de los Castros, s.n, 39005 Santander, Spain bUNESCO Chair in Life Cycle and Climate Change, Escola Superior de Comerç Internacional (ESCI-UPF), Pg. Pujades 1, 08003 Barcelona, Spain c
Lavola Cosostenibilidad Rbla, Catalunya 6 08007, Spain
H I G H L I G H T S
• Companies aim introducing their di-verse products in new green markets. • Anchovy origin, type of oil and
packag-ing material are the main product variables.
• The life cycle assessment of the canned anchovy are performed from cradle to grave.
• Imported anchovies, sunflower oil and aluminum are the worst environmental option.
• System expansion, mass and economic allocation are compared.
G R A P H I C A L A B S T R A C T
a b s t r a c t
a r t i c l e i n f o
Article history:
Received 19 September 2016
Received in revised form 23 December 2016 Accepted 27 December 2016
Available online 3 January 2017 Editor: D. Barcelo
The anchovy canning industry is one of the most important economic resources of the Cantabria region in Spain. However, environmental, economic and social problems over the past years have forced companies to apply mar-keting strategies, develop product diversification, create new products and introduce them in new “green mar-kets”. Launching Cantabrian canned anchovies into more sustainable markets requires measuring the environmental performance using Product Category Rules (PCRs) and Environmental Product Declarations (EPDs). EPDs and PCRS include the environmental profile of a range of similar products, such as all of the available canned anchovy products. The great variety of anchovy canned products depends on three process variables: the origin of the anchovy (Cantabria, Argentina and Chile or Peru), the type of oil (refined olive oil, extra virgin olive oil and sunflower oil) and the packaging (aluminum, tinplate, glass and plastic).
This work aims to assess the environmental impact from cradle to grave of canned anchovies in oil using the life cycle assessment methodology (LCA). Moreover, the paper evaluates the influence of the above-mentioned three product variables in the LCA results. The results show that out of all of the alternatives, Chilean and Peruvian anchovies have the highest environmental burdens due to the transportation by ship. The production of anchovies in sunflower oil is a less environmentally friendly oil process due to the low yield per hectare of sunflower cultiva-tion. Finally, the use of aluminum as the packaging material has the largest environmental impact out of almost all of the impact categories. Moreover, because the LCA results can be significantly affected by the allocation proce-dure, a sensitivity analysis comparing system expansion, mass and economic allocation is performed. In this case, the system expansion approach presents the highest environmental impacts followed by the mass allocation. © 2017 The Authors. Published by Elsevier B.V. This is an open access article under the CC BY-NC-ND license (http://creativecommons.org/licenses/by-nc-nd/4.0/).
Keywords: Life cycle assessment Canning industry Allocations Industrial ecology Product variables
⁎ Corresponding author at: Department of Chemical and Biomolecular Engineering, University of Cantabria, Avda. de lo Castros s/n, 39005 Santander, Spain. E-mail address:[email protected](J. Laso).
http://dx.doi.org/10.1016/j.scitotenv.2016.12.173
0048-9697/© 2017 The Authors. Published by Elsevier B.V. This is an open access article under the CC BY-NC-ND license (http://creativecommons.org/licenses/by-nc-nd/4.0/).
Contents lists available atScienceDirect
Science of the Total Environment
j o u r n a l h o m e p a g e :w w w . e l s e v i e r . c o m / l o c a t e / s c i t o t e n v1. Introduction
The food production system as a whole is recognized as one of the major contributors to environmental impacts since it is a great consum-er of both enconsum-ergy and natural resources (Iribarren et al., 2010b). In par-ticular, the quality and prestige of canned anchovies are of particular relevance in the Cantabria region in North Spain. Nevertheless, there are several environmental, economic and social problems in this sector. From an environmental point of view, the manufacturing process gen-erates large amounts of effluents (mainly water and oils), fish residues and packaging wastes. Moreover, in recent years, the stock level of the Cantabrian anchovy (Engraulis encrasicolus) has been in a critical situa-tion whereas the costly distribusitua-tion to new markets has hindered the growth of the sector. The main economic and social problems of the sec-tor were the closing of the anchovyfishery in 2005. The capture de-creased from 982,000 kg in 2004 to 12,000 kg in 2005, causing the loss of a significant number of jobs in the canning sector of Cantabria Re-gion. (ICANE 2016). Consequently, the sector needs to develop local strategies to reach global development. The anchovy canning industry has considerable product diversification due to the high worldwide competitiveness and demand, which makes the development of mar-keting strategies to reach and maintain a leading position in the market necessary. From the entire range of products, the key one is the so-called “octavillo”, which is formed by 30 g of Cantabrian anchovy fillets in 20 g of extra virgin olive oil (total 50 g) contained in an aluminum can. Con-sumers around the world see this canned food as a gourmet product. However, the sector has developed a wide range of new products com-bining the main variables of the process as a diversification strategy. That is, the canning plants were forced to import fresh and salted ancho-vies from other countries due to the depleted stock level in the Canta-bria Sea. Anchovies may come from CantaCanta-bria (Engraulis encrasicolus), Argentina (Engraulis anchoita), Chile and/or Peru (Engraulis ringens) ac-cording to the market demand. Regarding the consumers' preferences, the anchovies may be preserved in sunflower oil, olive oil or extra virgin olive oil, and the primary packaging is available in aluminum cans, tin-plate or glass jars; all of them are shipped inside cardboard boxes. More-over, the size of the packaging varies from 50 g to 1 kg.
These products employ the same materials, namely, anchovies, salt, brine, oil and the packaging; however, the combination of these three
product variables (anchovy origin, type of oil and packaging) generates new canned products with different environmental impacts.
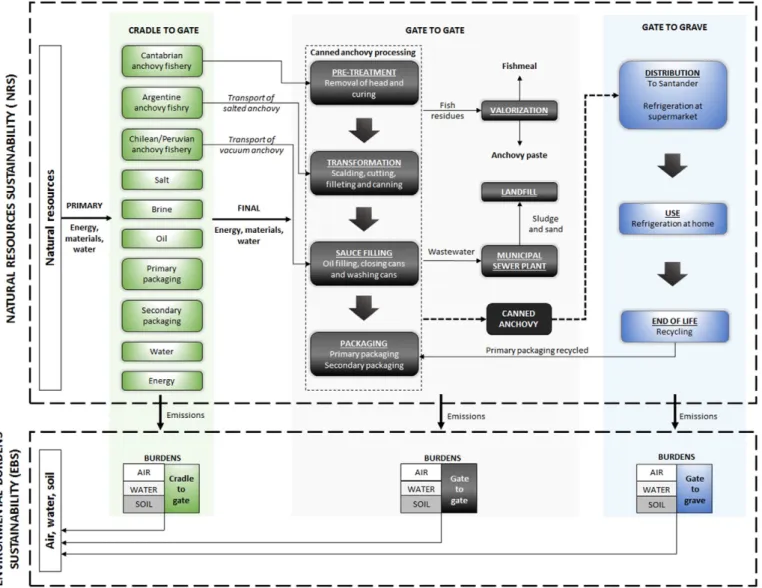
Launching Cantabrian canned anchovy products onto new“green markets” using Environmental Product Declarations (EPDs) and Prod-uct Category Rules (PCRs) (Haprowine, 2010) stated by the European policy“Building the Single Market for Green Products” (European Commission, 2013) will contribute to the development, recognition and expansion of this food sector. The PCRs define the rules and require-ments for the EPDs of a certain product category. EPDs (ISO, 2006a) communicate quantitative information about a specific product both to manufacturers and distributors and to thefinal consumer using the Life Cycle Assessment (LCA) methodology (ISO, 2006b, 2006c) (Ibañez-Forés et al., 2013). Similar products from the same company can be included in the same EPD if the differences between the manda-tory impact indicators are lower than 10% (Environdec, 2016). LCA is a standardized methodology for analyzing the potential environmental impacts of a product or service throughout its life cycle (Pirlo et al., 2016). Therefore, determining the environmental performance and an-alyzing the influence of the three variables in the life cycle of each canned anchovy product are required. This is thefirst step in the devel-opment of PCRs for this product category.Fig. 1shows the procedure for defining the PCRs and EPDs of the canned anchovy category based on product diversification in the canning anchovy sector.
In addition to the product variables, there are other aspects of the LCA methodology, such as allocations, that have large influences on the results, and it is convenient to carry out a sensitivity analysis (Guo and Murphy, 2012).
This work aims tofill in the gap of LCA studies of canned anchovies from cradle to grave, which is thefirst step in developing the PCRs of this gourmet product. Concerning Peruvian anchovies, several studies have been published about the anchovetafishery (Fréon et al., 2014a, 2014b; Avadí et al., 2014a) and the anchoveta production and consump-tion (Avadí et al., 2014b; Avadí and Fréon, 2015).
There have been no previous LCA studies on European anchovies (Engraulis encrasicolus). The authors published the twofirst papers re-garding this species. In particular,Laso et al., 2016aevaluated the man-agement of the anchovy residues generated during the canning process, andLaso et al., 2016bassessed the environmental performance of the production of one can of anchovies in olive oil (from gate to grave),
proposing several improvements to reduce its impact. However, there are several process variables that still need to be evaluated. For that rea-son, this paper analyses the origin of the anchovy (Cantabria, Argentine, Peru and Chile), the type of oil employed (extra virgin olive oil, refined olive oil and sunflower oil) and the different packaging materials. More-over, this work considers the consumption of fuel for the anchovy fish-eries in Cantabria, Peru and Argentine, and the transport of the anchovies by container ship from Peru and Argentine. In this way, the entire life cycle, from cradle to grave, of the anchovy is considered. Nev-ertheless, the authors believe that it is necessary to carry out a more in depth analysis of the anchovyfishery in Cantabria, taking into account the construction, maintenance and end of life of the vessels, as well as the consumption of diesel, ice, antifouling agents, and lubricant oil. The paper is divided into two parts: (i) the LCA of the canned anchovy products considering the influences of the main process variables (the anchovy origin, type of oil used and packaging material) and (ii) a sen-sitivity analysis of the co-product allocation of the Cantabrian canned anchovy processing. The paper is structured as follows;Section 2 pre-sents the life cycle methodology including the goal of this study, the sys-tem description and boundaries, the scenarios under study and the allocations;Section 3depicts the data acquisition and the life cycle in-ventory;Section 4shows the environmental categories used in this study. Finally,Sections 5 and 6provide the results and the main conclu-sions of the work.
2. Methodology 2.1. Goal and scope
The principal aim of this paper is to evaluate the environmental im-pacts of canned anchovy products as afirst approach in the evaluation of the Cantabrian canning sector from an environmental point of view. To achieve this goal, a representative canning company from Santoña (Cantabria) with three canning plants that produced 160 tonnes in total of canned anchovy in oil in 2014 was selected. These three plants were considered to be representative due to their high production and product diversity. Moreover, these plants were mainly exporting com-panies interested in the development of PRCs and EPDs in order to intro-duce the anchovy products in green markets. This plant was analyzed from a cradle-to-grave perspective, that is to say, from the production and transportation of raw materials to the disposal of the wastes gener-ated during the consumption stage. This factory produces several an-chovy products, processes different species of anchovies and uses different types of oils and packaging sizes and materials. Therefore, three scenarios were defined in order to analyze the influences of these three variables: anchovy origin, type of oil and packaging material. To carry out this analysis under a life cycle approach, it was neces-sary to define a functional unit (FU). In this case, the FU selected was 1 kg of raw anchovy entering the factory, according toHospido et al. (2006). The use of kg of raw fresh anchovy entering the canning plant allows comparing the efficiency of the different scenarios.
The system under study included the capture of the anchovy, the production stages of the different ingredients (raw materials), their transport to the canning factory in Santoña, the processing and packag-ing of the anchovies at the plant, andfinally, their distribution, con-sumption and EoL. The anchovy capture was considered in this study based on the consumption of diesel by vessels. This was because the production, transportation and use of diesel were the main contributors to global warming in thefishery stage (Ziegler et al., 2016). Because data on the consumption of diesel in the Argentinefishery are not available, the data from the Peruvianfishery were considered due to the similarity between the Peruvian and Argentine vessels (Garciarena and Buratti, 2013). The Cantabrianfishery used 340 g of diesel per kg of fresh ancho-vy (based on data from Cantabrian vessels), and the Peruvianfishery used 15.6 g of diesel per kg of fresh anchovy (Fréon et al., 2014a).
Moreover, capital goods for the canning plants were not considered due to the long estimated lifespan.
The considered product system is represented inFig. 2, and it is di-vided into cradle to gate (Cr-Ga), gate to gate (Ga-Ga) and gate to grave (Ga-Gr) stages.
• Cr-Ga: this stage included the anchovy capture; the production of en-ergy, water, and fuels; the raw materials (salt, brine and oil); and the packaging (aluminum can, tinplate, glass jar, cardboard box, carton box and low-density polyethylene (LDPE)film). The transportation of the raw materials and the packaging were also included. The trucks were considered to be Euro 4 trucks with a maximum total capacity of 28 t. The transportation distances were estimated by means of road guides: salt from Torrevieja (Alicante) (900 km), brine from Villarcayo (Burgos) (80 km), oil from Córdoba (850 km) and packaging from Labatut (France) (270 km). The Argentine, Peruvian and Chilean an-chovies were transported to Cantabria by an ocean container ship with a pay load capacity of 27,500 dead weight tons (dwt). The manufacturing and EoL of the vessel were not included. The distance from Argentina was considered to be 10,900 km, and an average of the distance from Chile and Peru was used (13,800 km). The transpor-tation models were chosen based on the most similar options among those available from the databasePE International (2014).
• Ga-Ga: this stage comprised the manufacture of canned anchovies and the management of wastewater andfish residues. First, the an-chovies are beheaded and placed in layers with a bed of salt between each layer offish for 6 months. After curing, the skin is removed by cold and hot water (scalding), and each anchovy is cut andfilleted by hand. The anchovyfillets are packed in cans that are filled with oil (refined olive oil, extra virgin olive oil and sunflower oil). Finally, the cans are sealed, washed, codified and packed. The primary packag-ing is composed of aluminum or tinplate cans or glass jars packed in cardboard boxes. Secondary packaging for the transportation of the final product consists of corrugated cardboard boxes and LDPE film to wrap the packs. The anchovy processing generates considerable solid and liquid wastes. On the one hand,fish residues (heads, spines and remaining anchovies) are valorized to obtain marketable prod-ucts and avoid their disposal in a landfill. The heads and spines are converted intofishmeal and fish oil in a fishmeal plant, whereas the anchovy remnants are used to produce anchovy paste in the canning plant. On the other hand, the liquid effluents are sent to a municipal wastewater treatment plant (WWTP), and the sludge and sand from the WWTP are disposed of in a landfill.
• Ga-Gr: this stage included the distribution of the final product to wholesale and retail markets, its use and EoL. In this work, it was con-sidered that the canned anchovies were transported from the canning factory to a logistic hub that was located 40 km from the plant and to a supermarket that was located 10 km from the hub in the city center. The semi-preserved product was stored in a refrigerator of the small supermarket in the city center. It is assumed that the transport of the consumers to the point of retail is made by car if the purchase is made at superstores or large supermarkets and by foot to nearby mar-kets and small shops (Vázquez-Rowe et al., 2013). In this case, con-sumers living in the city center frequent the small supermarket, and therefore, they go on foot. At home, the product must be stored in a household fridge at a temperature between 5 and 12 °C. Regarding the consumption pattern, canned anchovies are ready-to-eat prod-ucts, they do not require any cooking, and therefore, the environmen-tal impact of this stage is null. Finally, the EoL of the can and the cardboard box is recycling.
2.2. Scenarios under study
• Anchovy origin. Canning plants from Cantabria process anchovies from the Bay of Biscay (Engraulis encrasicolus) but also from Argentina (Engraulis anchoita) and from Chile and Peru (Engraulis ringens).Fig. 2
shows theflow of each anchovy origin. Cantabrian anchovies are land-ed in the Santoña harbor and transportland-ed to the factory to be manufactured. Argentine anchovies captured in the Southwest Atlantic Sea are pretreated (beheaded and cured) in factories in Argentina. Subsequently, the cured anchovy is transported to the can-ning plant in Santoña where thefinal product is obtained. Finally, Chilean and Peruvian anchovies caught in the Northwest Pacific Sea are pretreated and transformed (beheaded, cured, scalded, cut and filleted) by Chilean and Peruvian companies. Anchovies are vacuum-packed and transported to the canning plant in Santoña to befilled with oil and canned. After a process review, it was considered that the operational conditions and raw materials of the pretreatment and transformation steps in the canning plants from Argentina, Chile and Peru were similar to those of the Cantabrian canning plants. • Type of oil. To obtain canned anchovy products, different types of oil
are used depending on the anchovy origin and the geographical distri-bution of the product. Cantabrian anchovies are usuallyfilled with re-fined olive oil (ROO), whereas Argentine, Chilean and Peruvian anchovies employ extra virgin olive oil (EVOO) and sunflower oil (SO). Previous results (Laso et al., 2016b) indicated that the oil pro-duction step had great environmental impacts. Therefore, it was con-sidered to be a relevant variable of the study.
• Packaging material. The anchovy canning industry uses several kinds of packaging: aluminum cans, tinplate cans and glass jars. Moreover, a Danish company (Almeida et al., 2015) already markets the use of
plastic packaging with the usual can appearance for canned mackerel in tomato sauce. Therefore, it has also been included in this analysis.
2.3. Allocations
The anchovy canning manufacture is a multi-output process in which the production of canned anchovies is the main function of the system and the generation of by-products due to the valorization of the anchovy residues is an additional function (Bala et al., 2015). This system generates several products, and the environmental burdens must be distributed among the different products and processes (Finnveden et al., 2009). In this work, the input and output data of the inventory corresponded to the processing of 1 kg of raw anchovy enter-ing the factory. To determine the environmental impacts of the canned anchovy products, the use of system expansion or allocations is required.
The valorization of the anchovy residues involves the waste treat-ment and the generation of a new product, providing the following extra functions to the system: the generation offishmeal from heads and spines, and the production of anchovy paste from the remaining an-chovies. The International Organization for Standardization (ISO) estab-lishes a specific procedure for allocation in which system expansion is thefirst option to handle this problem. However, the identification of a replaceable process is difficult and sometimes impossible.Weidema
and Schmidt (2010)emphasize the importance of avoiding allocation, considering that, in general, all allocation criteria are less effective than substitution and system expansion, following the ISO require-ments (ISO, 2006b). In this work, system expansion was applied consid-ering the production offishmeal from fresh anchovy (including fishing activities) as the technology that replaces the valorization system for heads and spines and the production of tuna pâté as the process re-placed in the anchovy meat valorization (Laso et al., 2016a).
With respect to the EoL, recycling serves as a waste treatment pro-cess for the discarded products and, at the same time, produces a new material to be used in a new product (Van der Harst et al., 2015). An at-tributional perspective based on those proposed byBala et al. (2015)
was chosen. The attributional approach assumes that the analyzed sys-tem does not modify its environment, and thus, each additional unit of material recycled would displace an equivalent quantity of the current mix of virgin + recycled material being used as raw material by the market. In this case, the avoided burdens are calculated using the actual mix of virgin and recycled materials in the market. Then, the lence between virgin and recycled material is determined. This equiva-lence is based on the efficiency of the recovery process and the substitution factor (information about the efficiency factors as well as the average European market mixes are in Table S1 in the supporting in-formation available on the Journal's website).
3. Life cycle inventory and data acquisition
The primary data contained the main inputs and outputs of the can-ning factory in 2014: the consumption of electricity, fuels, water, salt, brine, oil and packaging materials, as well as the generation of solid and liquid wastes. These data were obtained from the canning plant under study.
The secondary data regarding the production of the SO, aluminum and tinplate cans, glass jars, cardboard, corrugated cardboard, and LDPE, as well as the transportation and landfilling were taken from thePE International (2014)and Ecoinvent® 3.1 (Frischknecht et al., 2007) databases. These databases are the most robust life cycle invento-ries on the market with representative data for Europe conditions. The transportation of raw materials was performed considering a Euro 4 truck with a maximum total capacity of 28 t, which drives on motor-ways over long distances. The emissions that are associated with the use of diesel were calculated using generic data from the PE database. The landfill disposal based on generic data from the PE database in-cludes the construction and maintenance stages and biogas recovery.
The production of ROO and EVOO were obtained from the OiLCA Tool1(SUDOE, 2011), while the salt (Goetfried et al., 2012) and brine
production (NYSDEC, 2015), the specifications of the WWTP ( Lorenzo-Toja et al., 2015) and the data on distribution and refrigeration (Büsser and Jungbluth, 2009) were collected from the literature. To im-prove the data quality and consider the local idiosyncrasies, the electric-ity mix provided by the PE database was adapted to the characteristics of the Spanish electricity mix of 2014. Table S2 in the supporting infor-mation shows the distribution of the Spanish electricity mix in 2014.
Regarding the valorization of the anchovy residues, the production offishmeal (consumption of energy, water and fuel oil) was taken from FAO (FAO, 1986) and belong belongs to afishmeal plant with a production of more than 500 t/day. The data on anchovy paste produc-tion were collected from the anchovy canning factory. (SeeTable 1.)
In relation to the processes used in the system expansion, the data on anchovyfishing were taken fromFréon et al. (2014), whereas tuna
fishing and pâté processing came fromHospido and Tyedmers (2005)
andIribarren et al. (2010a), respectively. Finally, the data on the recycling of aluminum (Leroy, 2009), tinplate (Yellishetty et al., 2011), glass (Edwards and Schelling, 1999), cardboard (Wang et al., 2012) and plastic (Rigamonti et al., 2014) were also collected from the litera-ture.Table 2shows the inputs and outputs of the manufacture of 1 kg of raw anchovy entering the canning plant in 2014.
4. Life cycle impact assessment
Impact assessment in LCA involves calculating the contributions made by the energy, material and water inputs and outputs tabulated
1
The OiLCA Tool is a free tool that allows quantifying the carbon footprints and costs as-sociated with the production of different types of olive oil for human consumption. This tool was developed in the framework of the OiLCA Project,“Improving the competitive-ness and reducing the carbon footprint of the olive oil sector through the waste manage-ment optimization”. The participating countries were Spain, Portugal and South France (SUDOE zone).
Table 1
Life cycle inventory for the processing of 1 kg of fresh raw Cantabrian, Argentine, Chilean and Peruvian anchovies.
Input/output data Unit Cantabria Argentine Chile/Peru Pre-treatment
Inputs Fresh anchovy kg 1.00 1.00 1.00 Salt kg 5.51∙10−1 5.51∙10−1 5.52∙10−1 Brine m3 8.23∙10−5 8.23∙10−5 8.23∙10−5 Energy MJ 7.00∙10−3 7.00∙10−3 7.00∙10−3 Outputs Anchovy to transformation kg 8.14∙10−1 8.14∙10−1 8.14∙10−1 Solidfish residues
(heads and guts)
kg 1.86∙10−1 1.86∙10−1 1.86∙10−1
Transformation Inputs Anchovy from
pretreatment kg 8.14∙10−1 8.14∙10−1 8.14∙10−1 Brine m3 4.85∙10−4 4.23∙10−4 4.25∙10−4 Energy MJ 3.51∙10−1 3.03∙10−1 3.01∙10−1 Water (scalding) m3 9.69∙10−4 9.12∙10−4 9.15∙10−4 Outputs Anchovy to saucefilling kg 3.14∙10−1 2.60∙10−1 2.61∙10−1
Solidfish residues (cutting and spines)
kg 5.00∙10−1 5.54∙10−1 5.55∙10−1 Wastewater
(from scalding)
m3 9.69∙10−4 9.12∙10−4 9.15∙10−4
Saucefilling
Inputs Anchovy from transformation
kg 3.14∙10−1 2.60∙10−1 2.61∙10−1 Oil kg 3.03∙10−1 1.84∙10−1 1.86∙10−1 Energy MJ 1.89∙10−1 1.57∙10−1 1.57∙10−1 Water (washing cans) m3
5.92∙10−5 4.90∙10−5 4.92∙10−5 Outputs Anchovy to packaging kg 3.14∙10−1 2.60∙10−1 2.61∙10−1
Wastewater (from washing cans)
kg 5.92∙10−5 4.90∙10−5 4.92∙10−5 Oil kg 9.40∙10−2 3.90∙10−2 5.50∙10−2 Packaging
Inputs Anchovy from saucefilling kg 3.14∙10−1 2.60∙10−1 2.61∙10−1 Aluminum kg 4.40∙10−2 3.60∙10−2 3.60∙10−2 Tinplate kg 1.02∙10−1 8.50∙10−2 8.50∙10−2 Glass kg 6.17∙10−1 5.11∙10−1 5.13∙10−1 Plastic kg 3.80∙10−2 3.20∙10−2 3.20∙10−2 Cardboard kg 5.20∙10−2 4.30∙10−2 4.40∙10−2 Corrugated board kg 2.10∙10−2 1.70∙10−2 1.70∙10−2 Plastic (LDPE) kg 1.26∙10−3 1.04∙10−3 1.04∙10−3 Energy MJ 7.54∙10−3 6.24∙10−3 6.26∙10−3 General consumptions
Inputs Water (for general cleaning)
m3 41.78∙10+1 34.65∙10+1 34.61∙10+1 Energy (for plant
illumination)
MJ 6.49∙10−1 5.38∙10−1 5.38∙10−1 Natural gas m3 1.50∙10−2 1.30∙10−2 1.30∙10−2 Outputs Wastewater (from
general cleaning) m3 41.78∙10+1 34.65∙10+1 34.61∙10+1 Distribution Inputs Energy MJ 7.91∙10−1 6.55∙10−1 6.58∙10−1 Use Inputs Energy MJ 8.92∙10−1 7.38∙10−1 7.41∙10−1
in the inventory phase to a specific suite of environmental impact cate-gories (Pelletier and Tyedmers, 2010). In this work, the LCA was modeled in GaBi 6.0 software, whereas the LCIA was conducted with the environmental sustainability assessment (ESA) methodology using the metrics developed by the Institution of Chemical Engineers (IChemE, 2002). These metrics can be used to measure the environmen-tal sustainability performance of an operating unit or product, providing a balanced view of the environmental impact of inputs (resource usage) and outputs (emissions, effluents and waste) (García et al., 2013).
The results were divided into natural resources (NR) and environ-mental burdens (EB). On the one hand, NR include the consumption of energy (X1,1) [MJ], materials (X1,2) [kg] and water (X1,3) [kg] for the
considered process and/or product; thus, they can be described by a di-mensionless NR index X1. On the other hand, the EB were grouped into
environmental compartments consisting of the air (X2,1) and water
(X2,2), and they can be described by a dimensionless EB index X2. The
following impact categories were considered in X2,1 and X2,2:
atmospheric acidification (AA), global warming (GW), human health (carcinogenic) effects (HHE), stratospheric ozone depletion (SOD), photochemical ozone (smog) formation (POF), aquatic acidification (AqA), aquatic oxygen demand (AOD), ecotoxicity to aquatic life (metals to seawater) (MEco), ecotoxicity to aquatic life (other sub-stances) (NMEco) and eutrophication (EU).
Both NR and EB are subjected to a normalization and weighting pro-cedure. In this work, the normalization procedure developed by
Margallo et al. (2014)was applied. Specifically, an internal normaliza-tion was proposed for NR, whereas an external procedure was applied for EB. In the internal normalization, the normalized values were ob-tained by dividing the characterized environmental impacts by a maxi-mum characterized environmental impact of alternatives. On the other hand, external normalized results were calculated by dividing the char-acterized environmental impact category by the reference value of the
same impact category (Ji and Hong, 2016). In this case, the reference values considered for EB were the threshold values included in the European Pollutant and Transfer Register (E-PRTR) regulation (European Commission, 2006). The threshold values (seeTable 2) of these pollutants can be used as an important aid in the normalization process because they provide an overview of the environmental perfor-mance of the installation at a European level (Margallo et al., 2014). 5. Results and discussion
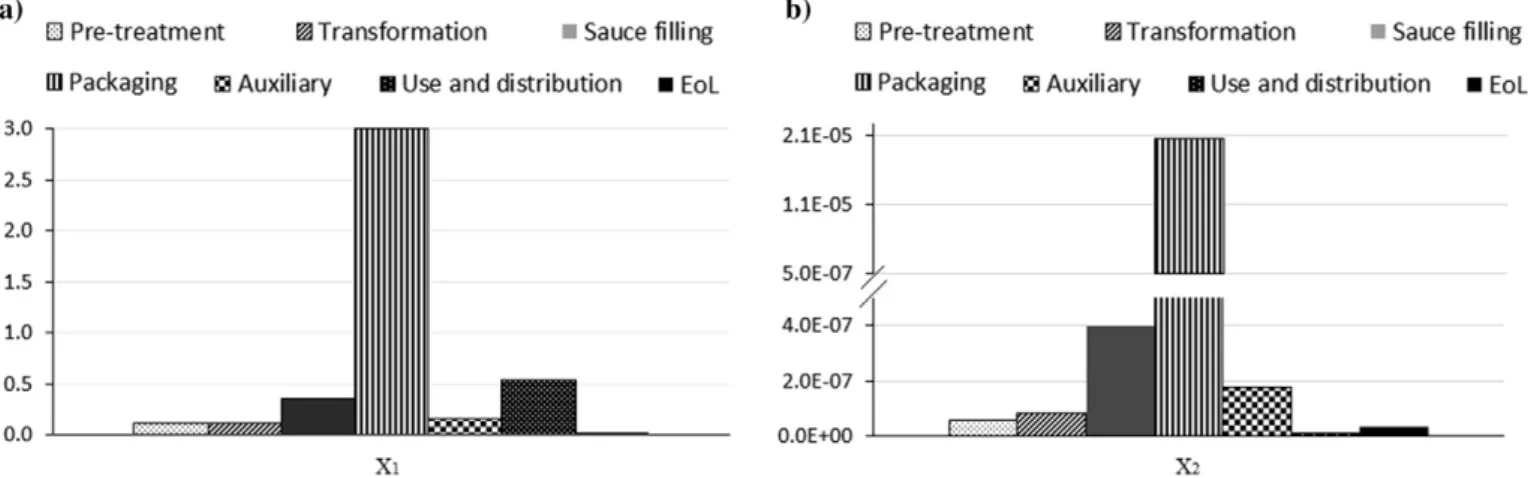
The LCA of one can of Cantabrian canned anchovies in EVOO using aluminum as the packaging material (“octavillo”) was performed in previous works (Laso et al., 2016b). The results indicated that the pack-aging step, which includes the production of the aluminum can, card-board box, corrugated card-board and LDPE, as well as the energy consumed in this stage, presented the highest NR consumption and the greatest EB. In particular, the NR demand in the packaging step was 6 times higher than the use and distribution step and 8 time greater than the saucefilling step (Fig. 3). Similarly, the packaging step polluted 50 times more than the saucefilling step. The production of aluminum cans and, to a lesser extent, the production of the EVOO were the main hot spots of the life cycle of canned anchovy. The production of 4.40∙10−2 kg of aluminum requires 1.81 MJ of primary energy,
3.6∙103kg of water and 0.21 kg of bauxite. Moreover, the production
of EVOO demands high amounts of water for the irrigation of the olive plants.
These results highlight the need to improve the packaging and sauce filling steps. A measure that could make the environmental perfor-mance of the canned anchovies better is the substitution of the type of oil. Concerning the packaging, canned anchovies in tinplate cans and glass jars are also available on the market. Other authors also reported studies of Spanish canned products in which the packaging step and
Table 2
Environmental burdens and reference value for normalization.
Environmental burdens (EB) Units Threshold value (kg/year) (EC, 2006)
X2,1 EB to air
X2,1,1 Atmospheric acidification (AA) kg SO2eq. 150,000
X2,1,2 Global warming (GW) kg CO2eq. 100,000,000
X2,1,3 Human health (HHE) kg benzene eq. 1000
X2,1,4 Photochemical ozone formation (POF) kg ethylene eq. 1000
X2,1,5 Stratospheric ozone depletion (SOF) kg CFC-11 eq. 1
X2,2 EB to water
X2,2,1 Aquatic oxygen demand (AOD) kg O2eq. 50,000
X2,2,2 Aquatic acidification (AqA) kg H+eq. 100
X2,2,3,1 Ecotoxicity to aquatic life (organics) (MEco) kg Cu eq. 50
X2,2,3,2 Ecotoxicity to aquatic life (metals) (NMEco) kg formaldehyde eq. 50
X2,2,4 Eutrophication (EU) kg phosphate eq. 5000
the production of oil were the most significant contributors, i.e., canned tuna (Hospido and Tyedmers, 2005), canned sardines (Vázquez-Rowe et al., 2014) and canned mussels (Iribarren et al., 2010b).
5.1. Analysis of the anchovy origin
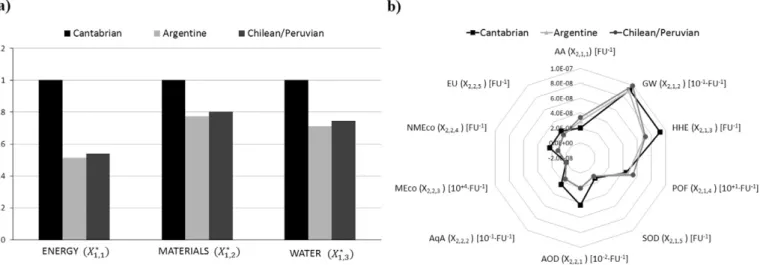
Similar anchovy processing is conducted in Cantabria, Argentina, Chile and Peru; however, the quality of the raw anchovies varies from species to species. During the manufacture of the Cantabrian anchovy, approximately 68% of the fresh anchovy was wasted (0.68 kg offish res-idues from 1 kg of raw anchovy). Nevertheless, the manufacture of Ar-gentine, Chilean or Peruvian anchovy generated approximately 75% fish residues (0.75 kg of fish waste from 1 kg of raw anchovy). As a re-sult, the Cantabrian anchovies required more NR due to the greater quantity of anchovy processed per kg of fresh anchovy and the greater consumption of diesel in thefishery stage (Fig. 4). In this sense, the pro-cessing of Cantabrian anchovy consumed 1.9 times more energy and ap-proximately 1.3 times more materials and water than the Argentine, Chilean and Peruvian anchovies. The production of fuel oil for the trans-port of anchovies, which represented 10% of the total energy, reduced the difference between the Cantabrian and the Argentine, Chilean and Peruvian anchovies. Moreover, the NR consumptions of canned ancho-vies from Chilean and Peruvian anchoancho-vies were slightly higher than that from Argentine anchovies due to the shorter distance between Can-tabria and Argentina.
With regard to the EB, before the normalization, GW displayed the highest air impact in all of the cases (0.91–1.0 kg CO2eq.) due to the
emissions of greenhouse gases (CO2, CO, NOx, and CH4) in the
genera-tion of energy, the producgenera-tion of fuel oil (CO2; Volatile Organic
Com-pounds, VOCs; and CH4) and its use in the fishery stage and the
transportation by ship (CO2, CO, and NOx). The EU presented the highest
contribution to water impact in all of the cases due to the emissions of ammonia, nitrogen, phosphate and chemical oxygen demand (COD) in the production of energy and fuel oil. After the normalization, POF had the greatest contribution in the air impact, whereas EU was the highest contributor to the water impact. The main reason was that although GW had the highest air impact, when it was referenced to its threshold value (100,000,000 kg CO2eq.) the normalized results were reduced by 8
or-ders of magnitude. However, a lower threshold for POF was used as the reference value (1000). For water impacts, there were no significant dif-ferences after the normalization due to the fact that the threshold values are lower than those in the air categories.
The comparison of the three anchovy origins showed that the use of Cantabrian anchovy had the greatest impacts in the categories of HHE (9.2∙10−8FU−1), SOD (1.3∙10−8FU−1) and AOD (4.3∙10−10FU−1).
This was due to the emissions of heavy metals (antimony, arsenic, cad-mium, and nickel) and halogenated organic compounds in the produc-tion of aluminum for the packaging. Cantabria produced more processed anchovies and, consequently, required more packaging mate-rial per FU due to the fact that the Cantabrian anchovy edible content was higher than those of the other ones. Moreover, the use of Cantabrian anchovy also presented the highest impacts in AqA (2.4∙10−9FU−1) and EU (2.4∙10−8FU−1) due to the emissions of
H2SO4, HCl, HF and acetic acid, and the emissions of ammonia, nitrogen,
phosphate, phosphorus and COD.
On the other hand, the use of Chilean and Peruvian anchovy had the greatest value in AA (3.4∙10−8FU−1) and GW (9.9∙10−9FU−1) due to
the emission of greenhouse gases (CO2, CO, and NOx), acids (HCL, HF,
and ammonia) and organic compounds in the production of fuel oil used to the transport by ship. In the water compartment, the highest values were the AOD (2.1∙10−10FU−1) and NMEco (1.2∙10−8FU−1) owing to the emission of heavy metals (arsenic, cadmium, lead, and manganese) and other substances, such as chloride, into water during the production of fuel oil. This was because the distance from Chile or Peru is higher than that from Argentine, and consequently, the con-sumption of fuel oil was higher. The negative value of the MEco indica-tor (−4.8∙10−7FU−1) was a consequence of the avoided burdens in the
valorization of the anchovy residues. The use of Argentine anchovy had lower impacts than all of the other environmental impacts.
The normalized results were grouped into two impacts for compar-ison, EB to air and EB to water. The use of Chilean or Peruvian anchovies presented an impact to air 1.2 times higher than the use of Cantabrian anchovies and 1.1 times higher than the use of Argentine anchovies. This was due to the transportation of anchovy by ship and the fuel oil consumption. In the water compartment, the value of the dimensionless index was similar in the three cases because the transportation by ship of the anchovy had less influence on the EB to water.
5.2. Influence of the type of oil
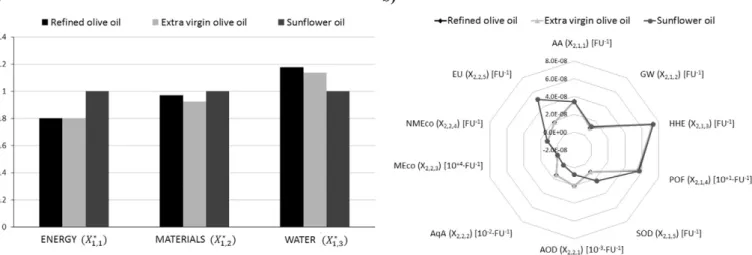
The procedure to obtain olive and sunflower oils is divided into the same two stages: cultivation and oil extraction. However, the manufac-ture of SO required more energy, 1.25 times higher than ROO and EVOO (Fig. 5). This was because the cultivation stage was the main contributor to energy consumption, representing approximately 60–70%, and sun-flower oil had a relatively low yield per hectare compared to olive oil, which results in higher land use, more fertilizers and pesticides per ton of oil produced, and greater energy demand. Moreover, the energy required for the extraction of SO was higher than for olive oil because an additional step to remove the seed peels is necessary.
With respect to olive oils, the EVOO is the highest-quality oil because it is extracted directly from olives using only pressure, while ROO followed the same procedure, but a refining stage is required. Therefore, ROO had an NR consumption that is slightly higher than that of EVOO. Furthermore, as in energy analysis, the cultivation stage accounted for approximately 80% of the total water of the process due to the irrigation. In this sense, ROO and EVOO consumed 1.15 times more water than SO due the higher water demand of olive trees. Furthermore, the sunflower plants are more resistant to drought conditions. The material resource consumptions were similar in the three cases.
As in the previous case, before normalization, GW displayed the highest air impact in all of the cases (0.98–1.2 kg CO2eq.) due to the
emission of greenhouse gases in the production and use of pesticides and herbicides (CO2, CO, VOCs, and CH4), the production and use of
so-dium hydroxide in the refining, the consumption of diesel in the cultiva-tion stage (CO2, NO, and NOx) and the energy consumption in the oil
production (CO2, CO, NOx, and CH4). EU presented the highest
contribu-tion to the water impact in all of the cases due to the emissions of nitro-gen, phosphorus, PO43−and COD in the production of pesticides and
herbicides. After the normalization, the POF had the largest contribution to the air impact, whereas the EU had the largest contribution to the water impact.
The SO had the highest impacts to air and water. In the air compart-ment, the highest impacts were POF (5.7∙10−7 FU−1), HHE
(7.3∙10−8FU−1) and SOD (2.3∙10−8FU−1) due to the emission of
sev-eral organic compounds in the production of pesticides and herbicides. In the water compartment, the greatest impacts were the EU (5.1∙10−8FU−1) and MEco (1.2∙10−8FU−1) caused by the pesticides
and herbicides.
The EB to air and EB to water dimensionless indices were calculated. The greatest air and water EB were observed when the SO was used. The EB to air was 1.2 times higher than the ROO and EVOO, and the EB to water was negative due to the avoided burdens and similar in both cases. As mentioned above, the main reason for these results is the rel-atively low yield per hectare of the sunflower oil, which implies more fertilizers and pesticides per ton of oil produced.
5.3. Influence of the packaging material
This analysis was made based on the assumption that the packaging contained the same amount of product (0.261 kg of anchovy and 0.131 kg of oil) and that the type of transport of the packaging and dis-tances to the canning plant were identical in all the cases.
The production of aluminum and glass had the greatest energy de-mands (5.5 and 5.8 MJ per FU, respectively), while the tinplate showed
the highest consumption of material and water resources (0.65 kg of material and 95.2 kg of water per FU). However, the avoided burden of the recycling made up for the consumption of virgin resources.
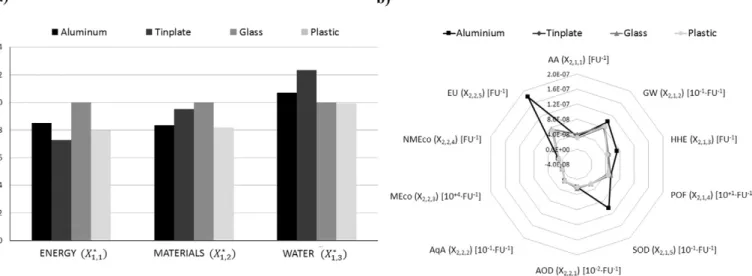
Fig. 6shows the normalized values of the NR and EB variables of the life cycle of canned anchovy using aluminum, tinplate, glass and plastic as the packaging materials. Moreover, it was assumed that these mate-rials were recycled after the use phase.
The use of glass as the packaging material had the highest energy and material consumptions, whereas the tinplate had the greatest water demand. This was due to the fact that the glass packaging more material per FU (0.5 kg) than the others materials. Moreover, the recycling of glass had a low recovery efficiency (21%), and only 45% of the total glass recycled is present in the market. Therefore, the produc-tion of more virgin glass. The consumpproduc-tion of water resource was simi-lar in the four cases, however, in the case of tinplate it was slightly higher. As mentioned above, the production of tinplate demanded large amounts of water, however, the avoided burdens of the recycling compensated the consumption of this resource.
Regarding the material resource consumption, glass presented the highest value due to the consumption of non-renewables resources such as dolomite, feldspar and limestone.
As in previous analysis, GW displayed the highest air impact in all of the cases (8.1∙10−1–9.8∙10−1kg CO
2eq.) due to the greenhouse gases
emissions (CO2, CO, NOxand CH4) produced by the consumption of
en-ergy in the production of these materials. In the water compartment, the EU presented the greatest values in all cases due to the emissions of ammonia, nitrogen, phosphorus, PO43−and COD during the
produc-tion of these packaging materials. After normalizaproduc-tion, the POF had the highest contribution in the air categories, whereas the EU continued as the highest contributor to water categories for the aluminum and NMEco for the tinplate, glass and plastic.
Aluminum presented the highest impacts in all of the categories ex-cept AA and AOD. In these impacts, glass packaging was the main con-tributor due to the emissions of ammonia, HCl, HF and SO2during its
production. The normalized impact for aluminum varied from HHE (6.9∙10−8FU−1) to AqA (1.6∙10−8FU−11). These environmental
im-pacts were caused by the consumption of energy in the aluminum pro-duction. The production of aluminum is an energy-intensive process: the production of 1 kg of aluminum consumed 65 MJ with 30% used in the alumina extraction and 65% used in the electrolysis step.
Plastic as a packaging material seems to improve the environmental performance of the life cycle of canned anchovy. However, the use of plastic can generate the non-acceptance of the product because it could decrease the quality of the canned anchovy. Two years ago, a na-tional company from the region of Castellón (Spain) introduced a new
plastic packaging for the canned anchovies to the market. This initiative emerged as a consequence of the increase in the price of steel. The new packaging, presented in a triple-pack, seemed to conserve the sanitary conditions, and the reception of the product by the consumers was pos-itive due to the price reduction. However, performing market research and a quality study is necessary when products are high-quality and “gourmet” products.
5.4. Sensitivity analysis: mass and economic allocations
The environmental impact of canned anchovies depends on the selection of the process variables studied in the previous sections.
However, some hypotheses are assumed in the life cycle methodology that could influence the results. The choice of the allocation procedure in the goal and scope definition is the most significant one.
By-products offish processing are often used as protein sources in other production systems and frequently represent a significant portion of the massflow. As a result, it is generally necessary to allocate the en-vironmental burdens offish processing between the primary product and one or more by-products (Ayer et al., 2007). The selection of the al-location procedure is one of the most controversial methodological is-sues in LCA. In this sense,Pelletier and Tyedmers (2011)proposed that LCA models should exclude market information whenever possible and rely instead on best-fit biophysical parameters. In particular, in
Fig. 6. Comparison of normalized a) NR and b) EB variables of canned anchovy using aluminum, tinplate, glass and plastic as packaging materials.
seafood production, some authors, such asThrane (2006), employed system expansion to handle the co-product allocation in the LCA of Danishfish products. Other authors, such asZiegler et al. (2003), used economic allocation because the by-products represented over 50% of the massflow, and they reasoned that mass allocation would have greatly reduced the share of environmental burdens attributed to the codfillets.Ziegler et al. (2012)applied mass allocation because they considered that the pricefluctuations avoided the economic allocation. In the previous sections of this paper, a system expansion was ap-plied to include the additional functions related to the valorization of fish residues. This section conducted a sensitivity analysis to evaluate the influences of the mass and economic allocations on the results.
The economic and mass allocations consider the market price and mass of the primary canned anchovy product– octavillo-and its by-products, i.e.,fishmeal, fish oil and anchovy paste. Applying mass alloca-tion attributes 73% of the environmental burden to the canned ancho-vies, while applying economic allocation attributes 56% to the primary product.Fig. 7displays the environmental impacts of the system expan-sion and mass and economic allocations for anchovies from Cantabria in extra virgin olive oil and aluminum packaging. System expansion pre-sented the highest EB in all of the impact categories except in AOD, which had a negative value due to the subtraction of the environmental burdens of the alternative system from the system under study. On the other hand, the use of economic allocation presented the lowest envi-ronmental impacts. System expansion likely gives the most reliable pic-ture of the current scenario because external changes do not influence the results. The mass and economic allocations may change due to the quality of thefish and the market value fluctuations, respectively. 6. Conclusions
The use of product diversification as a marketing strategy in the an-chovy canning industry promoted the generation of many new products based on the main variables of the anchovy canning processing: the or-igin of the anchovy, the type of oil and the packaging. The introduction of these products in new“green markets” makes defining the PCRs of the canned anchovy product category and, subsequently, creating the EPDs of each product necessary. This requires determining the environ-mental impacts under a life cycle approach of each variable and its in flu-ence on the life cycle of canned anchovies.
The origin of the fresh anchovy, the type of oil and the packaging had strong influences on the environmental performance of the product. The increase in the consumption of out-of-season products caused high consumption of energy and resources due to its transportation. Moreover, sometimes these imported products are lower quality and have higher prices. The manufacture of Argentine, Chilean and Peruvian anchovy generated approximately 10% morefish residues and present-ed higher GWP than Cantabrian anchovy due to the emission of green-house gases from the use of fuel.
The use of sunflower oil consumed more energy than olive oil and extra virgin olive oil and presented the highest value in all environmen-tal categories due to the relatively low yield per hectare and the use of pesticides and herbicides.
The packaging presented the highest environmental impact in the life cycle of the canned anchovy, although the recycling of packaging materials decreases this impact. The use of aluminum presented the greatest impact in almost all categories. Plastic could improve the envi-ronmental profile of canned anchovy. In fact, there are companies that currently market this packaging. However, it could result in the non-ac-ceptance of the product by consumers because they could be considered lower quality products.
This work shows that there are several differences between the en-vironmental impacts of the different canned anchovy products. It could be thefirst step to define the PCRs of the canned anchovy products. In further works, the use of the ILCD method to perform an environmental analysis of European anchovies will be considered.
Acknowledgements
The authors thank the Ministry of Economy and Competitiveness of the Spanish Government for thefinancial support through the project called GeSAC-Conserva: Sustainable Management of the Cantabrian Anchovies (CTM2013-43539-R) and Julia Celaya for technical support. Jara Laso also thanks the Ministry of Economy and Competitiveness of the Spanish Government for thefinancial support through the research fellowship BES-2014-069368.
Appendix A. Supplementary data
Supplementary data to this article can be found online athttp://dx. doi.org/10.1016/j.scitotenv.2016.12.173.
References
Almeida, A., Vaz, S., Ziegler, F., 2015.Environmental life cycle assessment of a canned sar-dine product from Portugal. J. Ind. Ecol. 19 (4), 607–617.
Ayer, N.W., Tyedmers, P.H., Pelletier, N.L., Sonesson, U., Scholz, A., 2007.Co-product allo-cation in life cycle assessment of seafood production systems: review of problems and strategies. Int. J. Life Cycle Assess. 12 (7), 480–487.
Avadí, A., Fréon, P., 2015.A set of sustainability performance indicators for seafood: Direct human consumption products from Peruvian anchovetafisheries and freshwater aquaculture. Ecol. Ind. 48, 518–532.
Avadí, A., Vázquez-Rowe, I., Fréon, P., 2014a.Eco-efficiency assessment of the Peruvian anchoveta steel and woodenfleets using the LCA+DEA framework. J. Clean. Prod. 70, 118–131.
Avadí, A., Fréon, P., Quispe, I., 2014b.Environmental assessment of Peruvian anchoveta food products: is less refined better? Int. J. Life Cycle Assess. 19, 1276–1293.
Bala, A., Raugei, M., Fullana-i-Palmer, P., 2015.Introducing a new method for calculating the environmental credits of end-of-life material recovery in attributional LCA. Int. J. Life Cycle Assess. 20 (1), 645–654.
Büsser, S., Jungbluth, N., 2009.The role offlexible packaging in the life cycle of coffee and butter. Int. J. Life Cycle Assess. 14 (1), S80–S91.
Edwards, D.W., Schelling, J., 1999.Municipal waste life cycle assessment. Part 2: transport analysis and glass case study. Inst. Chem. Eng. 77 (part B).
Environdec, 2016. The International EPD System.http://www.environdec.com/en/
(Accessed July 2016).
European Commission, 2006.E-PRTR Regulation no. 166/2006 of the European Parlia-ment and of the Council Concerning the EstablishParlia-ment of a European Pollutant Re-lease and Transfer Register.
European Commission, 2013.Building the Single Market for Green Products: Facilitating Better Information on the Environmental Performance of Products and Organisations.
FAO, 1986. The production offishmeal and oil. Technical paper 142.http://www.fao.org/ docrep/003/x6899e/x6899e00.htm(Accessed December 2015).
Finnveden, G., Hauschild, M.Z., Ekvall, T., Guinée, J., Heijungs, R., Hellweg, S., Koehler, A., Pennington, D., Suh, S., 2009.Recent developments in life cycle assessment. J. Environ. Manag. 91 (1), 1–21.
Fréon, P., Avadí, A., Vinatea-Chavez, R.A., Iriarte, A.F., 2014a.Life cycle assessment of the Peruvian industrial anchovetafleet: boundary setting in life cycle inventory analyses of complex and plural means of production. Int. J. Life Cycle Assess. 19 (1), 1068–1086.
Fréon, P., Avadí, A., Soto, W.M., Negrón, R., 2014b.Environmentally extended comparison table of large- versus small- and medium-scalefisheries: the case of the Peruvian an-chovetafleet. Can. J. Fish. Aquat. Sci. 71, 1459–1474.
Frischknecht, R., Jungbluth, N., Althaus, H.J., Doka, G., Heck, T., Hellweg, S., Hischier, R., Nemecek, T., Rebitzer, G., Spielmann, M., Wernet, G., 2007.Overview and Methodol-ogy. Ecoinvent Report No.1. Swiss Centre for Life Cycle Inventories, Dübendorf, Switzerland.
Garciarena, D., Buratti, C., 2013.Pesca commercial de anchoita bonaerense (Engraulis anchoita) entre 1993 y 2001. Rev. Invest. Desarr. Pesq. 23, 87–106.
García, V., Margallo, M., Aldaco, R., Urtiaga, A., Irabien, A., 2013.Environmental sustain-ability assessment of an innovative Cr (III) passivation process. ACS Sustain. Chem. Eng. 1 (1), 481–487.
Goetfried, F., Stratmann, B., Quack, D., 2012.Life Cycle Assessment of Sodium Chloride Production and Transport. International Conference on Biodiversity, Sustainability and Solar Salt Proceedings pp. 59–63.
Guo, M., Murphy, R.J., 2012.LCA data quality: sensitivity and uncertainty analysis. Sci. Total Environ. 435-436, 230–243.
Haprowine, 2010. Gestión integral de residuos y análisis del ciclo de vida del sector vinícola. De residuos a productos de alto valor añadido.http://www.haprowine.eu/ introduccion.php(Accessed July 2016).
Hospido, A., Tyedmers, P., 2005.Life cycle environmental impacts of Spanish tuna fisher-ies. Fish. Res. 76 (1), 174–186.
Hospido, A., Vazquez, M.E., Cuevas, A., Feijoo, G., Moreira, M.T., 2006.Enviromental assess-ment of canned tuna manufacture with a life-cycle perspective. Resour. Conserv. Recycl. 47, 56–72.
Ibañez-Forés, V., Bovea, M.D., Azapagic, A., 2013.Assessing the sustainability of best avail-able techniques (BAT): methodology and application in the ceramic tiles industry. J. Clean. Prod. 51, 162–176.
IChemE, 2002.The Sustainability Metrics. Sustainable Development Progress Metrics Rec-ommended for Use in the Process Industries. The Institution of Chemical Engineers.
Iribarren, D., Moreira, M.T., Feijoo, G., 2010a.Implementing by-product management into the life cycle assessment of the mussel sector. Resour. Conserv. Recycl. 54 (12), 1219–1230.
Iribarren, D., Vázquez-Rowe, I., Hospido, A., Moreira, M.T., Feijoo, G., 2010b.Estimation of the carbon footprint of the Galicianfishing activity (NW Spain). Sci. Total Environ. 408 (22), 5284–5294.
ISO, 2006a.ISO 14025: Environmental Labels and Declarations-Type III Environmen-tal Declarations-Principles and Procedures. International Organization for Standardization.
ISO, 2006b.ISO 14044: Environmental Management, Life Cycle Assessment, Require-ments and Guidelines. International Organization for Standardization.
ISO, 2006c.ISO 14040: Environmental Management, Life Cycle Assessment, Principles and framework. International Organization for Standardization.
Ji, C., Hong, T., 2016.Comparative analysis of methods for integrating various environ-mental impacts as a single index in life cycle assessment. Environ. Impact Assess. Rev. 57 (1), 123–133.
Laso, J., Margallo, M., Celaya, J., Fullana, P., Bala, A., Gazulla, C., Irabien, A., Aldaco, R., 2016a.
Waste management under a life cycle approach as a tool for a circular economy in the canned anchovy industry. Waste Manag. Res. 34 (8), 724–733.
Laso, J., Margallo, M., Fullana, P., Bala, A., Gazulla, C., Irabien, A., Aldaco, R., 2016b. Introduc-ing life cycle thinkIntroduc-ing to define best available techniques for products: application to the anchovy canning industry. J. Clean. Prod. (in press).10.1016/j.jclepro.2016.08.040. Leroy, C., 2009.Provision of LCI data in the European aluminium industry. Methods and
examples. Int. J. Life Cycle Assess. 14 (1), S10–S44.
Lorenzo-Toja, Y., Vázquez-Rowe, I., Chenel, S., Marín-Navarro, D., Moreira, M.T., Feijoo, G., 2015.Eco-efficiency analysis of Spanish WWTPs using the LCA + DEA method. Water Res. 68, 651–666.
Margallo, M., Dominguez-Ramos, A., Aldaco, R., Bala, A., Fullana, P., Irabien, A., 2014. Envi-ronmental sustainability assessment in the process industry: a case study of waste-to-energy- plants in Spain. Resour. Conserv. Recycl. 93 (1), 144–155.
NYSDEC, 2015.Solution Salt Mining Summary. New York State Department of environ-mental Conservation.
PE International, 2014.GaBi 6 Software and Database on Life Cycle Assessment. Leinfelden-Echterdingen (Germany).
Pelletier, N., Tyedmers, P., 2010.Life cycle assessment of frozen tilapiafillets from Indone-sia lake-based and pond-based intensive aquaculture systems. J. Ind. Ecol. 14 (3), 467–481.
Pelletier, N., Tyedmers, P., 2011.An ecological economic critique of the use of market in-formation in life cycle assessment research. J. Ind. Ecol. 15 (3), 342–354.
Pirlo, G., Carè, S., Della Casa, G., Marchetti, R., Ponzoni, G., Faeti, V., Fantin, V., Masoni, P., Buttol, P., Zerbinatti, L., Falconi, F., 2016.Environmental impact of heavy pig produc-tion in a sample of Italian farms. A cradle to farm-gate analysis. Sci. Total Environ. 565, 576–585.
Rigamonti, L., Grosso, M., Moller, J., Martinez Sanchez, V., Magnani, S., Christensen, T.H., 2014.Environmental evaluation of plastic waste management scenarios. Resour. Conserv. Recycl. 85 (1), 42–53.
SUDOE, 2011. Olive oil life cycle assessment. OILCA Tool.http://www.oilca.eu/oilcatool/
(Accessed February 2016).
Thrane, M., 2006.LCA of Danishfish products. Int. J. Life Cycle Assess. 11 (1), 66–74.
Van der Harst, E., Potting, J., Kroeze, C., 2015.Comparison of different methods to include recycling in LCAs of aluminium cans and disposable polystyrene cups. Waste Manag. Res. 48 (1), 565–583.
Vázquez-Rowe, I., Villanueva-Rey, P., Moreira, M.T., Feijoo, G., 2013.The role of consumer purchase and post-purchase decision-making in sustainable seafood consumption. A Spanish case study using carbon footprinting. Food Policy 41 (1), 94–102.
Vázquez-Rowe, I., Villanueva-Rey, P., Hospido, A., Moreira, M.T., Feijoo, G., 2014.Life cycle assessment of European pilchard (Sardina pilchardus) consumption. A case study for Galicia (NW Spain). Sci. Tot. Environ. 475, 48–60.
Wang, L., Templer, R., Murphy, R.J., 2012.A life cycle assessment (LCA) comparison of three management options for waste papers: bioethanol production, recycling and incineration with energy recovery. Bioresour. Technol. 120 (1), 89–98.
Weidema, B.P., Schmidt, J.H., 2010.Avoiding co-product allocation in life-cycle assess-ment revisted. J. Ind. Ecol. 14 (2), 192–195.
Yellishetty, M., Mudd, G.M., Ranjith, P.G., Tharumarajah, A., 2011.Environmental life-cycle comparison of steel production and recycling: sustainability issues, problems and prospects. Environ. Sci. Pol. 14 (1), 650–663.
Ziegler, F., Nilson, P., Mattson, B., Walther, Y., 2003.Life cycle assessment of frozen cod fil-lets includingfishery-specific environmental impacts. Int. J. Life Cycle Assess. 8 (1), 39–47.
Ziegler, F., Winther, U., Hognes, E.S., Emanuelsson, A., Sund, V., Ellingsen, H., 2012.The carbon footprint of Norwegian seafood products on the global seafood market. J. Ind. Ecol. 17 (1), 103–116.
Ziegler, F., Hornborg, S., Green, B.S., Eigaard, O.R., Farmery, A.K., Hammar, L., Hartmann, K., Molander, S., Parker, R.W.R., Hognes, E.S., Vázquez-Rowe, I., Smith, A.D.M., 2016.
Expanding the concept of sustainable seafood using Life Cycle Assessment. Fish Fish. 17, 1073–1093.