Vitamin D exposure and Risk of
Breast Cancer: a meta-analysis
Nuria Estébanez
1, Inés Gómez-Acebo
1,2, Camilo Palazuelos
1,2, Javier Llorca
1,2& Trinidad
Dierssen-Sotos
1,2The relationship between vitamin D and breast cancer is still controversial. The present meta-analysis examines the effects of the 25(OH)D, 1,25(OH)2D and vitamin D intake on breast cancer risk. For this purpose, a PubMed, Scopus and Web of Science-databases search was conducted including all papers published with the keywords “breast cancer” and “vitamin D” with at least one reported relative risk (RR) or odds ratio (OR). In total sixty eight studies published between 1998 and 2018 were analyzed. Information about type of study, hormonal receptors and menopausal status was retrieved. Pooled OR or RR were estimated by weighting individual OR/RR by the inverse of their variance Our study showed a protective effect between 25 (OH) D and breast cancer in both cohort studies (RR = 0.85, 95%CI:0.74– 0.98) and case-control studies (OR = 0.65, 95%CI: 0.56–0.76). However, analyzing by menopausal status, the protective vitamin D – breast cancer association persisted only in the premenopausal group (OR = 0.67, 95%CI: 0.49–0.92) when restricting the analysis to nested case-control studies. No significant association was found for vitamin D intake or 1,25(OH)2D. Conclusion: This systematic review suggests a protective relationship between circulating vitamin D (measured as 25(OH) D) and breast cancer development in premenopausal women.
Breast cancer is an important public health problem in developed countries as it is one of the most common can-cers, being the most if only the female population is considered1. The incidence is decreasing every year, which is
partly due to early detection programs2.
In the last decades, cellular in vitro experiments and in vivo models have evaluated the role of vitamin D in the development of breast cancer, finding a protective anticancer role of 1,25(OH)D33. It has been demonstrated
that treating breast cancer cells with 1,25(OH)D3 induces two beneficial effects: an anti-proliferative effect4 and
a pro-apoptotic effect5,6. The former is linked to the suppression of growth stimulatory signals and the
potentia-tion of growth inhibitory signals, whilst the second one is explained by the bcl-2 family proteins. The interacpotentia-tion between vitamin D and its receptors induces an increase in the expression of pro-apoptotic family member (bax and bak protein) and simultaneously a decrease of anti-apoptotic (bcl-2/bcl-XL)6. In addition, the breast tissue
contains the 1-α-hydroxylase, allowing for the generation of the active vitamin D metabolite (1,25 dihydroxyvi-tamin D) from the circulating precursor (25 hydroxyvidihydroxyvi-tamin D). As vidihydroxyvi-tamin D receptors are found in the breast6,
an autocrine role of vitamin D has been suggested7.
Despite this biological background, literature shows inconsistent results8–16 (Table 1). Several additional
observational studies have appeared since the last meta-analysis publication (including articles until 2013). The main purpose of the present meta-analysis is to update the relationship between vitamin D exposure and breast cancer risk by adding the studies published more recently. Thus sixty-eight observational studies: thirty of these were case-control, twenty-one were nested case-control and the remaining were cohort studies.
Methods
Search strategy.
Firstly, the following inclusion criteria were defined: we looked for cohort or case-control studies performed in humans, which reported, at least, one relative risk (RR) or odds ratio (OR) with confidence interval at 95%. (95% CI)We began our search in Pub-Med, Scopus and Web of Science database using “breast cancer” and “vitamin D” as keywords, finding 2313 articles. After having read the title and abstract, 2123 articles that did not meet the above criteria were eliminated. Next, we carried out a more exhaustive and complete reading, which allowed us to reject another additional 69 articles (Fig. 1). Finally, sixty eight studies meeting our inclusion criteria were
1University of Cantabria – IDIVAL, Santander, Spain. 2CIBER Epidemiología y Salud Pública (CIBERESP), Madrid, Spain. Correspondence and requests for materials should be addressed to T.D.-S. (email: [email protected]) Received: 22 June 2017
Accepted: 29 May 2018 Published: xx xx xxxx
identified: fifty one case-control10,17–65 and seventeen cohort studies65–81. Tables 2 and 3 summarize the main
characteristics of the included articles.
Data extraction.
The following step was to create a database to gather all relevant information extracted from each article: year of publication, author, journal, follow up, country, sample size, exposure levels, units of measure, data for the creation of the contingency table and RR/OR with 95% CI; as well as a section to assess the quality of the study using the STROBE scale82.Statistical analysis.
Statistical analysis was performed separately for cohort and case-control studies. In the case control studies a sensitivity analysis was also carried-out including only nested case-control studies. We per-formed separate analyses for any type of vitamin D exposure reported in at least three studies: 25(OH)D, dietary intake of vitamin D, 1,25(OH)2D and vitamin D supplements.The ways that doses or levels of vitamin D were reported in each individual article were not standardized across studies (for instance, some papers reported vitamin D levels in quartiles; others in tertiles, and so on), making it difficult to extract them in an analyzable form. Therefore, in order to provide a consistent criterion of comparability, we selected the OR or RR reported for the highest category compared to the lowest one.
Regarding the type of breast cancer, we analyzed all invasive breast cancers together, and breast cancer strat-ified according to the cancer estrogen receptor status and woman’s menopausal status. Pooled OR or RR were
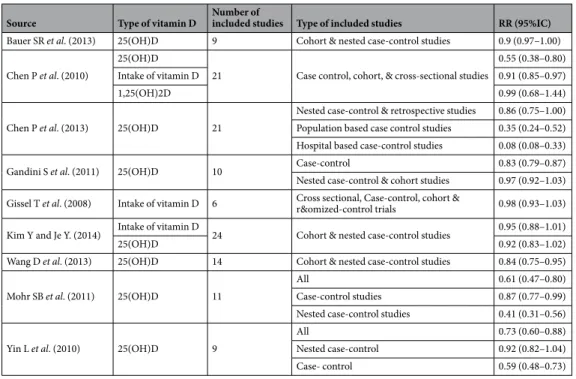
Source Type of vitamin D Number of included studies Type of included studies RR (95%IC)
Bauer SR et al. (2013) 25(OH)D 9 Cohort & nested case-control studies 0.9 (0.97–1.00) Chen P et al. (2010)
25(OH)D
21 Case control, cohort, & cross-sectional studies
0.55 (0.38–0.80)
Intake of vitamin D 0.91 (0.85–0.97)
1,25(OH)2D 0.99 (0.68–1.44)
Chen P et al. (2013) 25(OH)D 21
Nested case-control & retrospective studies 0.86 (0.75–1.00) Population based case control studies 0.35 (0.24–0.52) Hospital based case-control studies 0.08 (0.08–0.33) Gandini S et al. (2011) 25(OH)D 10 Case-control 0.83 (0.79–0.87) Nested case-control & cohort studies 0.97 (0.92–1.03) Gissel T et al. (2008) Intake of vitamin D 6 Cross sectional, Case-control, cohort & r&omized-control trials 0.98 (0.93–1.03) Kim Y and Je Y. (2014) Intake of vitamin D 24 Cohort & nested case-control studies 0.95 (0.88–1.01)
25(OH)D 0.92 (0.83–1.02)
Wang D et al. (2013) 25(OH)D 14 Cohort & nested case-control studies 0.84 (0.75–0.95) Mohr SB et al. (2011) 25(OH)D 11
All 0.61 (0.47–0.80)
Case-control studies 0.87 (0.77–0.99) Nested case-control studies 0.41 (0.31–0.56) Yin L et al. (2010) 25(OH)D 9
All 0.73 (0.60–0.88)
Nested case-control 0.92 (0.82–1.04) Case- control 0.59 (0.48–0.73)
Table 1. RR of breast cancer and vitamin D in previous meta-analysis.
Nested
Case-Control Country Exposition Group OR 95% CI No. of participants Age at baselinea Follow-up period Upper vs lower cut off levels
Adjusted by Time of blood draw Almquist M et al.(2010)£,¥,§,ϕ Sweden 25(OH)D3 All 0.99 (0.72–1.36) 1524 57 years 1991–2006 ≥106 vs ≤70 ng/mL Yes 25(OH) D3 + D2 All 1.01 (0.73–1.40) ≥107 vs ≤71 ng/mL 25(OH)D3 PRE 1.58 (0.77–3.25) ≥106 vs ≤70 ng/mL POST 0.88 (0.60–1.28) ≥107 vs ≤71 ng/mL 25(OH) D3 + D2 PRE 1.74 (0.84–3.60) ≥106 vs ≤70 ng/mL POST 0.88 (0.60–1.29) ≥107 vs ≤71 ng/mL Amir E et al.
(2012)£ Canada 25(OH)D All 0.86 (0.62–1.21) 1087 53.6 years 1992–1997 ≥34.4 vs <12 ng/mL No
Bertone-Johnson ER et al. (2005)£,¥,§ USA 25(OH)D All 0.73 (0.49–1.07) 1425 52.7 cases 57.1 controls 1989–1996 ≥48 vs <20 ng/mL No 1,25(OH)D All 0.76 [0.52–1.11] ≥38.2 vs <28.5 ng/mL Chlebowski RT et al.
(2008)€,£,§,ǂ,$ USA 25(OH)D POST 0.82 (0.60–1.12) 2134
50–79
years 1995–2002 ≥27.04 vs <12.96 ng/mL Yes Deschasaux M
et al. (2016)£,
¥,ǂ,ϕ France 25(OH)D All 0.98 (0.60–1.61) 699
49.3 cases 49.1
controls 1994–2007 ≥23.5 vs <11.4 ng/mL Yes Eliassen AH
et al. (2011)£,¥ USA 25(OH)D
All 1.20 (0.88–1.63) 1827 45 cases 44.9 controls 1996–2007 ≥30.6vs <18.4 ng/mL No ER+ 1.21 (0.84–1.75) ER− 1.31 (0.63–2.74) Eliassen AH
et al.(2016)£,¥ USA 25(OH)D
All 0.84 (0.58–1.21) 3012 56.7 cases 56.8 controls 1989–2010 ≥32.7 ng/ml vs <17.5 No ER+ 0.89 (0.74–1.08) ≥30 ng/ml vs <30 ER− 0.87 (0.63–1.20) Engel P et al. (2010)€,£, ¥, ǂ France 25(OH)D All 0.73 (0.55–0.96) 1908 56.9 years 1995–2005 >27 vs <19.8 ng/ml Yes PRE 0.37 (0.12–1.15) POST 0.80 (0.60–1.07) Freedman M
et al. (2008)€,£,¥¥,§ USA 25(OH)D POST 1.04 (0.72–1.51) 2010 55–74 years 1993–2005 33.7 vs 18.3 ng/mL Yes
Hiatt RA et al.
(1998)¥,ϕ USA 1,25(OH)2D All 1.00 (0.20–3.40) 192 >55 years 1980–1991 ≥51 vs <32 pg/ml No
Kim Y et al. (2014)£,¥,$ USA 25(OH)D White 0.13 (0.03–0.71) 1414 68.5 cases 68.4 controls 2001–2006 >0 vs 0 ng/mL Yes African-american 1.35 (0.65–2.78) Hawaian 1.35 (0.23–7.69) Japanese 1.04 (0.51–2.13) Latino 1.11 (0.51–2.44) Kühn T et al. (2013)£,¥,ǂ,ϕ Europe 25(OH)D All 1.07 (0.85–1.36) 2782 50.7 years 1992–2006 >63 vs ≤39.3nmol/L No ER+ 0.97 (0.67–1.38) ER− 0.97 (0.66–1.42) McCullough ML et al. (2009)£,¥,$ USA 25(OH)D All 1.09 (0.70–1.68) 1032 69.5 cases 69.4 controls 1998–2005 >76.2vs <36.7 nmol/ml Yes ER+ 1.15 (0.80–1.65) >64.2 vs <45.9 nmol/ml ER− 0.95 (0.43–2.06) Mohr SB et al.
(2013)$ USA 25(OH)D All 0.84(0.56–1.25) 1200 39.6 years 1994–2009 ≥35.2 vs ≤14.9 ng/mL No
Neuhouser ML
et al. (2012)£,ǂ USA 25(OH)D POST 0.94 (0.70–1.28) 2160 50–79 years 1994–2005 ≥25.96vs ≤14.68 ng/mL No
Rejnmark L
et al. (2009)# Denmark 25(OH)D
All 0.52 (0.32–0.85) 562 58 years 2003–2007 >33.6 vs <24 ng/mL No PRE 0.38 (0.15–0.97) POST 0.71 (0.38–1.30) Scarmo S et al. (2013)£,¥,§ USA&Sweden 25(OH)D All 0.94 (0.76–1.16)
4525 34–69 years 1985–2007 1995–2010 N.A. (Quintiles) No PRE 0.67 (0.48–0.92)
POST 1.21 (0.92–1.58) Shirazi L et al.
(2016)€,£, ¥,§ Sweden 25(OH)D3 All 0.97 (0.75–1.25) 1520 46–73 years 1991–1996/2006 ≥98nmol/L vs ≤76nmol/L Yes
Wang J et al.
(2014)£,¥ USA 25(OH)D All 0.95 (0.67–1.36) 1168 45 years >= 5.59 vs <3.76nmol/L No Case-Control Country Exposition Group OR 95% CI No. of participants Age at baseline Follow-up period Upper cut off levels
Nested
Case-Control Country Exposition Group OR 95% CI No. of participants Age at baselinea Follow-up period Upper vs lower cut off levels
Adjusted by Time of blood draw Abbas S et al. (2009)£,¥,ϕ Germany 25(OH)D PRE 0.45 (0.29–0.70) 884 42.1 cases 41.6
controls 1992–1995 ≥60 vs <30nmol/L Yes ER+ 0.56 (0.31–1.00)
ER− 0.40 (0.20–0,81) Abbas S et al.
(2008)£,¥,§ Germany 25 (OH)D POST 0.31 (0.24–0.42) 2759
63.6 cases 63.5
controls 2001–2005 > = 75 vs <30nmol/L Yes Alipour S et al.
(2014)€, ¥ Iran 25 (OH)D All 0.33 (0.12–0.91) 500
44.2 cases 43.2 controls N.A. >35 ng/ml vs <12.5 ng/ ml No Bilinski K et al. (2012) €,ϕ Australia 25(OH)D All 0.43 (0.23–0.77) 1066 55.4 cases55.5 controls 2008–2011 ≥75nmol/L vs <25nmol/mL Yes <50years 0.29 [0.08–1] ≥50 years 0.45 [0.23–0.71] Chen P et al.
(2013)€, ¥,§ China 25(OH)D All 0.11 (0.07–1.17) 1173
53.0 cases 55.3 controls 2005–2008 >17.9 ng/ml vs <10.4 ng/ml Yes Colagar AH et
al. (2015)# Iran 25(OH)D All 0.26 (0.13–0.50) 261
48.7 cases 47.0 controls 2009–2013 ≥16 vs <9 ng/mL No Crew KD et al. (2009) €,£,¥,§,ǂ,$ USA 25(OH)D All 0.56 (0.41–0.78) 2101 58.6 cases56.1 controls 1996–1997 ≥40 vs <20 ng/mL Yes PRE 0.83 [0.36–1.30] POST 0.46 [0.09–0.83] Fedirko V et al. (2012)£,¥¥,§,ǂ,ϕ Mexico 25(OH)D3 All 0.53 (0.36–0.78) 2074 53.1 cases51.3 controls 2004–2007 >25 vs ≤20 ng/mL Yes PRE 0.40 (0.30–0.81) POST 0.55 (0.33–0.90) Jamshidinaein Y et al. (2016)£,§,ϕ,$ Iran 25(OH)D All 0.26 (0.12–0.59) 270 50.4 cases50.0 controls 2013–2014 ≥29.5 vs <10.30 ng/ml Yes PRE 0.25 (0.09–0.69) POST 0.42(0.15–1.17) Janowsky EC
et al. (1999)€ USA 1,25(OH)2D All 0.31 (0.17–0.59) 331 NA 1990–1991 ≤34.6 vs>63.6pmol/ml Yes
Lowe LC et al. (2005)€ UK 25(OH)D All 0.17 (0.07–0.43) 358 58.0 cases 58.0 controls 1998–2003 ≥150 vs ≤50 nM Yes Oliveira-Sediyama CM
et al.(2016)ǂ Brazil 25(OH)D All 0.34 (0.16–0.71) 378
54.0 cases 47.5 controls NA ≥20vs <20 ng/mL No Park S et al. (2015)€,£, ¥,§ Korea 25(OH)D All 0.82 (0.75–0.90) 20767 50.7 cases49.7 controls 2006–2012 ≥20 vs <20 ng/mL Yes PRE 0.84 (0.74–0.96) POST 0.82 (0.73–0.93 Sofi NY et al.
(2016)# India 25(OH)D All 0.40 (0.14–1.11) 200
45.0 cases 46.0 controls 2014–2015 ≥20 ng/mL vs <20 ng/ mL No Sofi NY et al.
(2018)# India 25(OH)D All 0.42 (0.20–0.83) 400
45.0 cases 47.0 controls 2015–2017 ≥20 ng/mL vs <20 ng/ mL No Yao S et al. (2011)€,£,¥ USA 25(OH)D All 0.37 (0.27–0.51) 1153 NA 2003–2008 ≥30 vs <20 ng/mL Yes PRE 0.57 (0.34–0.93) POST 0.29 (0.19–0.45) Yousef FM et al.
(2013)€,£,ϕ Saudi Arabia 25(OH)D All 0.16 (0.07–0.42) 240 18–75 years 2009 ≥20 vs <10 ng/mL No
Ordoñez-Mena JM et al.
(2016)€,£,ǂ,ϕ Europe 25(OH)D POST 0.73 (0.22–2.43) 252
> = 60
years 1992–2000 >50 vs <30 nmol/L Yes
Cohort Country Exposition Group RR 95% CI Cases (No. of participants) Age at baseline Follow-up period Upper cut off levels
Skaaby T et al.
(2014)£,ǂ,ϕ Denmark 25(OH)D All 1.1 (0.7–1.71) 159 (5606) 18–71 years 1993–2008 N.A. (Quartiles) Yes
O´Brien KM (2017) et al€,£,
¥,§,ǂ,ϕ,$ USA 25(OH)D All 0.79 (0.63–0.98) 1600 (3422)
35–74
years 2003–2009 >38 vs <24.6 ng/mL Yes
Ordonez-Mena JM et al.
(2013)€,£,ǂ,ϕ Germany 25(OH)D All 1.08 (0.72–1.6) 137 (5261)
50–74 years 2000–2002 <30 vs >55 nmol/L* No Palmer JR et al. (2016)€,£, ¥,§ USA (African American
Women) 25(OH)D All 0.81 (0.68–0.96) 1454 (2856) 21–69
years 2012–2017 ≥49 vs <21 ng No
estimated by weighting individual OR/RR by the inverse of their variance. OR or RR heterogeneity was measured using Q and I2 statistics83. A fixed-effect model was preferred if the Q statistic was higher than 0.1 or I2 lower than 25%, indicating no relevant heterogeneity; a random-effect model was otherwise chosen84. The presence of
small-study bias was explored with Rosenthal model and with Egger test85; due to the low sensitivity of Egger test,
the cut-off was set at p = 0.1. Funnel plots86 were applied to detect publication bias.
An analysis of influence was performed via the re-estimation of pooled OR/RR by removing one study at a time. Studies that, when removed, strongly changed the OR/RR would be considered as highly influential. Results are displayed as forest plots showing OR/RR and their 95% confidence intervals for each individual study and for the pooled result. Cumulative meta-analyses were carried out to deem the stability of the OR/RR estimates. In order to do that, all studies considered were arranged from oldest to neweest. Then an OR/RR estimate was obtained for the two eldest studies; another for the three eldest, and so on, adding a study each time. Results are reported as forest plots.
All the statistical analyses were carried out with the package Stata 14/SE (Stata Corporation, College Station, TX, US).
Results
Relationship between 25(OH) D and breast cancer.
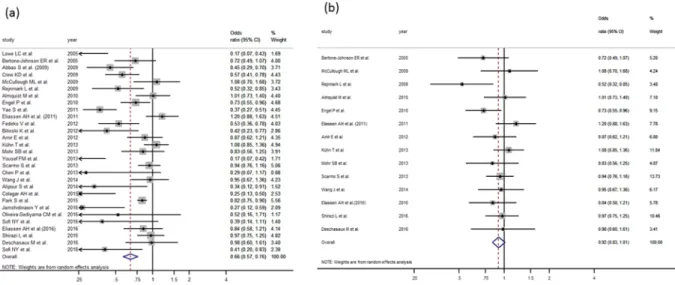
Twenty-nine case control studies were analyzed to study the relationship between 25 (OH) D and breast cancer10,19–22,25,27,29–35,38,42,44–46,48,49,51,55,56,58–63 obtaininga pooled OR of 0.65 (95%CI: 0.56–0.76) (Fig. 2a, Table 4). This value was calculated using the random effects model because of the high heterogeneity (I2 = 77.76%) of the fixed-effect. Although Egger test cannot rule out a small-study effect (p = 0.001), no study shows a relevant influence. The funnel plot shows asymmetry (Supplementary Fig. 1a), indicating either publication bias or heterogeneity that cannot be explained by a ran-dom-effect meta-analysis. Rosenthal model shows that 1194 negative studies would be needed to lose statistical significance. In order to further clarify the heterogeneous result, we carried out a sensitivity analysis including only nested case-control studies21,22,25,31–34,42,45,46,51,55,56,59 reaching a pooled OR = 0.92 (95%CI: 0.83–1.01) (Fig. 2b)
with I2 = 15.87%, Q-based p value = 0.22 and a very symmetrical-looking funnel plot (Supplementary Fig. 1b). Four cohort studies75,78–80 provided results on 25(OH)D and breast cancer relationship, from which we
obtained a pooled RR of 0.85 (95% CI:0.74–0.98).
We also analyzed the relationship between 25(OH) D and breast cancer, stratifying results by nal receptors (ER+/ER−) and menopausal status (postmenopausal or premenopausal). Regarding hormo-nal receptors (Table 4), we have found only one cohort study80 and five case-control studies19,32,33,42,45. In both
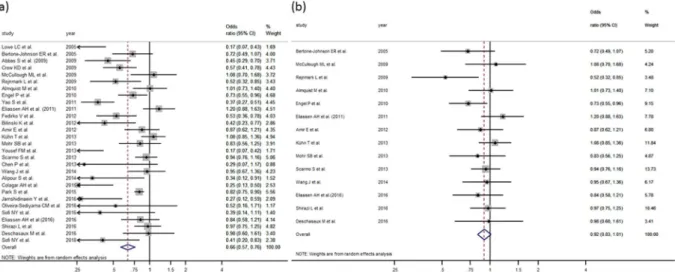
cases (ER+ and ER− tumors) statistical significance was not reached. With respect to menopausal status (Table 4), we obtained a protective effect in both groups: nineteen case-control studies targeted postmenopausal women18,21,28,30,34–36,38,41,47,49,51,55,60,81 with a pooled OR of 0.74 (95%CI: 0.59–0.93), and nine focused on
premeno-pausal21,30,34,35,38,49,51,55,60 obtaining a pooled OR of 0.63 (95%CI: 0.49–0.80) (Fig. 3a). When the sensitivity analysis
was carried out including only nested case-control studies, the protective vitamin D – breast cancer association persisted only in the premenopausal group (Fig. 3b, Supplementary Table 1). On the other hand three cohorts studies analyzed separately postmenopausal women79,81 without reaching statistical significance (OR = 1.15
(0.59–2.23)).
Relationship between 1,25(OH)2D and breast cancer.
Three case-control studies25,37,39 examined therelationship between circulating 1,25(OH)2D and breast cancer; significant association was not found either in the whole analysis (pooled OR = 0.61 (0.33–1.16)) or in postmenopausal women (combined OR = 1.28 IC 95%: 0.98–1.67)36,37.
Relationship between dietary vitamin D and breast cancer.
We found eight case-control stud-ies24,38,40,50,52,53,57,64 on the relationship between dietary vitamin D and breast cancer with a pooled OR of 0.91(95%CI: 0.72–1.17) (Table 4, Supplementary Fig. 2a). In addition, by combining five cohort studies66,68,70–72 we
obtained a RR of 1.00 (95% CI 0.93–1.07) (Table 4, Supplementary Fig. 2b).
When stratifying by menopausal status, four case-control38,40,53,64 and five cohort studies66,73,74,76,77 assessed
the risk of breast cancer in postmenopausal women. The pooled OR for case-control studies was 0.78 (95%CI: 0.68–0.90) and the pooled RR for cohort studies was 0.95 (95%CI: 0.83–1.09) (Table 4). In both analyses, Egger
Nested
Case-Control Country Exposition Group OR 95% CI No. of participants Age at baselinea Follow-up period Upper vs lower cut off levels
Adjusted by Time of blood draw Ordonez-Mena JM et al.
(2016)€,£, ǂ,ϕ Germany 25(OH)D POST 1.35 (0.38–2.27) 63 (4990) 63 years 2000–2002 >50 vs <30nmol/L Yes
Ordonez-Mena JM et al.
(2016)€,£,ǂ,ϕ Norway 25(OH)D POST 2.63 (0.82–8.33) 89 (2471) 62 years 1994–1995 >50 vs <30nmol/L Yes
Table 2. Studies included in our meta-analyses of blood 25-hydroxyvitamin D and breast cancer risk.
aMean or range of age. Adjusted by: €age; £BMI; ¥reproductive factors (menopausal status, age at menopause, age at menarche, parity, etc); §hormone therapy; ǂphysical activity; ϕeducative or socioeconomic variables; $race or sun exposure. #Unadjusted. Abbreviations: CI = confidence interval; POST = postmenopausal; PRE = premenopausal; OR = odds ratio; NA: Not available.
Case-Control Country Exposition Group OR (95% CI) No. of participants Age at baseline Follow-up period Upper vs lower cut off levels
Abbas S et al. (2007)€,£,¥ Germany Dietary
Vitamin D PRE 0.50 (0.26–0.96) 944 41.7 cases41.6 controls 1992–1995 ≥200 vs <80 IU/day Anderson LN et al. (2010)€,¥,ǂ,ϕ Canada Total vitamin D intake All 0.99 (0.78–1.26) 6572 56 years 2002–2003 ≥15 vs <2.5 mg/day Dietary Vitamin D 1.13 (0.88–1.45) ≥10 vs <2.5 mg/day Vitamin D supplement 0.76 (0.59–0.98) ≥10 vs 0 mg/day Anderson LN et al. (2011)€ Canada Vitamin D supplement
All 0.80 (0.60–1.08) 3616 56 years 2002–2003 >400 vs 0 IU/day Total Vitamin
D intake 0.87 (0.71–1.06) ≥600 vs <200 IU/day Bidgoli SA et al. (2014)# Iran Vitamin D
supplement PRE 0.89 (0.84–0.95) 176 36.5 cases 34.2 controls 2010–2012 Yes vs No
Jamshidinaein Y et al. (2016)€,£,¥,§,ϕ Iran
Dietary
vitamin D All 0.38 (0.18–0.83)
270 50.4 cases 50 controls 2013–2014 NA (Quartile) Dietary vitamin D PRE 0.39 (0.15–1.00) Dietary vitamin D POST 0.40 (0.15–1.12) Total vitamin D intake All 0.52 (0.25–1.14) Total vitamin D intake PRE 0.36 (0.13–1.06) Total vitamin D intake POST 0.70 (0.27–1.82) Kawase T et al. (2010)£,¥,§,ǂ Japan Dietary
Vitamin D
All 0.76 (0.63–0.90)
5409 20–79 2001–2005 >6.66 vs <2 mg/day PRE 0.65 (0.50–0.86)
POST 0.83 (0.64–1.07)
Lee MS et al. (2011)€,£,¥,ϕ Taiwan
Dietary Vitamin D All 0.57 (0.28–1.19) 400 52.5 cases 48.9 controls 2004–2005 >5 vs <2 mg/day Dietary Vitamin D PRE 0.38 (0.14–0.98) Dietary Vitamin D POST 0.60 (0.20–1.69) Total vitamin D intake All 0.52 (0.25–1.07) NA (Quartile) Total vitamin D intake PRE 0.47 (0.18–1.23) Total vitamin D intake POST 0.68 (0.23–1.27) Levi F et al.(2001)€,£,¥,ϕ Switzerland Vitamin D
supplement All 1.43 (0.90–2.26) 731 23–74 1993–1999 ≥2.7 vs <1.4 mg/day Leung et al.(2016)€ China Vitamin D
supplement All 0.78 (0.63–0.98) 323612 >18 2000–2011 ≤15 DDD Potischman N et al.
(1999)€,¥,§,ϕ USA Dietary Vitamin D All 0.98 (0.80–1.20) 2019 20–44 1990–1992 ≥400 vs <0 IU
Rollison DE et al. (2012)€,£,¥,§,ǂ USA Dietary Vitamin D All 1.35 (1.15–1.60) 4839 24–79 1999–2004 7.71 vs <3.06 mg/ day Vitamin D
supplement All 0.79 (0.65–0.96) 24–79 years 1999–2004 0 vs>10 mg/day Rossi M et al. (2009)€,£,¥,§,ϕ Italy Dietary
Vitamin D
All 0.76 (0.58–1.00)
5157 55 years cases 56 controls 1991–1994 >3.57 vs ≤3.57 mg PRE 0.80 (0.64–0.99)
POST 0.78 (0.66–0.92) Salarabadi A et al. (2015)# Iran Vitamin D
supplement PRE 0.53 (0.14–1.96) 152 NA 2012–2014 Yes vs No
Cohort Country Exposition Group RR (95% CI) Cases/Total Age at baseline Follow-up period Upper cut off levels
John EM et al. (1999)€,£,¥,ǂ,ϕ USA
Dietary
vitamin D All 0.85 (0.59–1.24)
190/5009
25–74 1971–1992 ≥200 vs <100 IU/day Vitamin D
supplement All 0.89 (0.60–1.32) 25–74 1971–1993 Daily vs never Total vitamin
D intake All 0.86 (0.61–1.2) 25–74 1971–1994
≥200 or daily suppl vs <100 IU/day without daily suppl
test rejected the possibility of small study bias (p = 0.536 in case-control studies and p = 0.68 in cohort studies). On the other hand, five case-control studies17,38,40,53,63 and three cohort studies66,73,77 targeted premenopausal
women; the pooled OR was 0.65 (95%CI: 0.52–0.82) for case-control studies and the RR for cohort studies was 1.01 (95% CI: 0.86–1.18) (Table 4).
Case-Control Country Exposition Group OR (95% CI) No. of participants Age at baseline Follow-up period Upper vs lower cut off levels
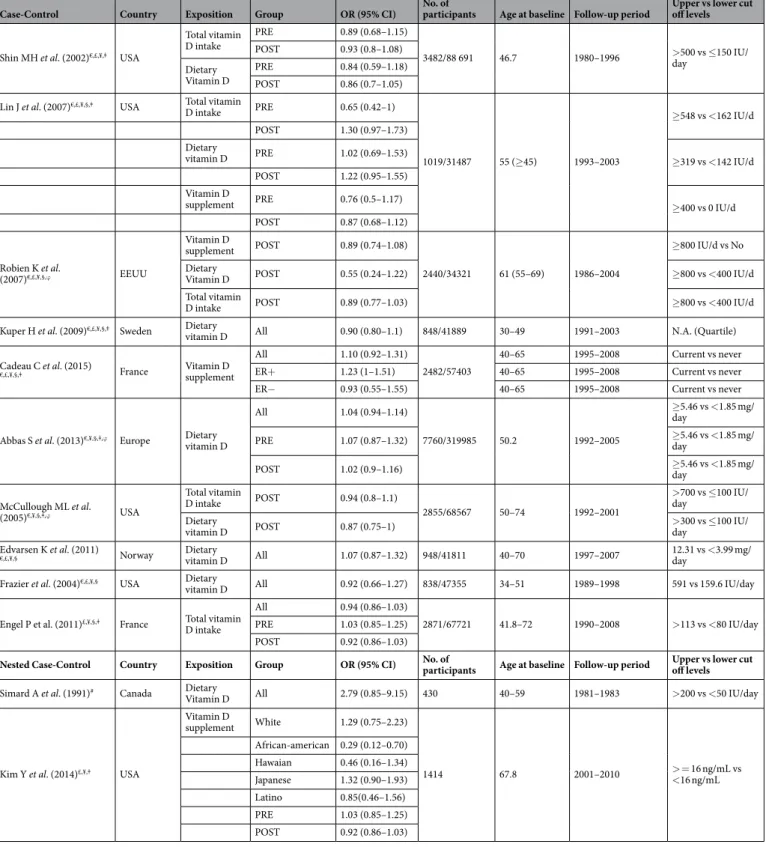
Shin MH et al. (2002)€,£,¥,ǂ USA
Total vitamin
D intake PRE 0.89 (0.68–1.15)
3482/88 691 46.7 1980–1996 >500 vs ≤150 IU/day POST 0.93 (0.8–1.08)
Dietary
Vitamin D PREPOST 0.84 (0.59–1.18)0.86 (0.7–1.05) Lin J et al. (2007)€,£,¥,§,ǂ USA Total vitamin
D intake PRE 0.65 (0.42–1)
1019/31487 55 (≥45) 1993–2003
≥548 vs <162 IU/d POST 1.30 (0.97–1.73)
Dietary
vitamin D PRE 1.02 (0.69–1.53) ≥319 vs <142 IU/d POST 1.22 (0.95–1.55)
Vitamin D
supplement PRE 0.76 (0.5–1.17) ≥400 vs 0 IU/d
POST 0.87 (0.68–1.12) Robien K et al. (2007)€,£,¥,§,ϕ EEUU Vitamin D supplement POST 0.89 (0.74–1.08) 2440/34321 61 (55–69) 1986–2004 ≥800 IU/d vs No Dietary
Vitamin D POST 0.55 (0.24–1.22) ≥800 vs <400 IU/d Total vitamin
D intake POST 0.89 (0.77–1.03) ≥800 vs <400 IU/d Kuper H et al. (2009)€,£,¥,§,ǂ Sweden Dietary
vitamin D All 0.90 (0.80–1.1) 848/41889 30–49 1991–2003 N.A. (Quartile) Cadeau C et al. (2015)
€,£,¥,§,ǂ France Vitamin D supplement
All 1.10 (0.92–1.31)
2482/57403
40–65 1995–2008 Current vs never ER+ 1.23 (1–1.51) 40–65 1995–2008 Current vs never ER− 0.93 (0.55–1.55) 40–65 1995–2008 Current vs never
Abbas S et al. (2013)€,¥,§,ǂ,ϕ Europe Dietary
vitamin D All 1.04 (0.94–1.14) 7760/319985 50.2 1992–2005 ≥5.46 vs <1.85 mg/ day PRE 1.07 (0.87–1.32) ≥5.46 vs <1.85 mg/day POST 1.02 (0.9–1.16) ≥5.46 vs <1.85 mg/day McCullough ML et al. (2005)€,¥,§,ǂ,ϕ USA Total vitamin D intake POST 0.94 (0.8–1.1) 2855/68567 50–74 1992–2001 >700 vs ≤100 IU/ day Dietary
vitamin D POST 0.87 (0.75–1) >300 vs ≤100 IU/day Edvarsen K et al. (2011)
€,£,¥,§ Norway Dietary vitamin D All 1.07 (0.87–1.32) 948/41811 40–70 1997–2007 12.31 vs <3.99 mg/day
Frazier et al. (2004)€,£,¥,§ USA Dietary
vitamin D All 0.92 (0.66–1.27) 838/47355 34–51 1989–1998 591 vs 159.6 IU/day Engel P et al. (2011)£,¥,§,ǂ France Total vitamin
D intake
All 0.94 (0.86–1.03)
2871/67721 41.8–72 1990–2008 >113 vs <80 IU/day PRE 1.03 (0.85–1.25)
POST 0.92 (0.86–1.03)
Nested Case-Control Country Exposition Group OR (95% CI) No. of participants Age at baseline Follow-up period Upper vs lower cut off levels
Simard A et al. (1991)# Canada Dietary
Vitamin D All 2.79 (0.85–9.15) 430 40–59 1981–1983 >200 vs <50 IU/day
Kim Y et al. (2014)£,¥,ǂ USA
Vitamin D supplement White 1.29 (0.75–2.23) 1414 67.8 2001–2010 > = 16 ng/mL vs <16 ng/mL African-american 0.29 (0.12–0.70) Hawaian 0.46 (0.16–1.34) Japanese 1.32 (0.90–1.93) Latino 0.85(0.46–1.56) PRE 1.03 (0.85–1.25) POST 0.92 (0.86–1.03)
Table 3. Studies included in our meta-analyses of dietary or supplements vitamin D and breast cancer risk.
aMean or range of age. Adjusted by: €age; £BMI; ¥reproductive factors (menopausal status, age at menopause,
age at menarche, parity, etc); §hormone therapy; ǂphysical activity; ϕeducative or socioeconomic variables; $race or sun exposure. #Unadjusted. Abbreviations: CI = confidence interval; POST = postmenopausal; PRE = premenopausal; OR = odds ratio; NA: Not available.
Relationship between supplements of vitamin D and breast cancer.
We identified five case-control studies23,24,43,52,65 and two cohort studies67,71 that had evaluated the association between supplements of vitaminD and breast cancer risk. The pooled OR and RR were 0.78 (95% CI: 0.63–0.98) and 1.06(95% IC: 0.90–1.25) respectively (Table 4). Regarding menopausal status, Kim et al.41 published a study on five different populations of
postmenopausal women; when combining all five results, we found no significant association (OR: 0.82 95%CI: 0.49–1.35).In addition, we found two case-control studies26,54 focused on premenopausal women obtaining a
weak protection (pooled OR 0.89 95%CI (0.84–0.95)).
Relationship between total vitamin D intake (dietary and supplements) and breast
can-cer.
Finally, we found two cohort studies69,71 and four case control studies23,24,38,64 on vitamin D intake (dietaryplus supplements) and breast cancer risk, providing no separate results on dietary/supplemented vitamin D ori-gin. We obtained a combined RR = 0.93 (95% CI: 0.86–1.02) for cohort studies, and a combined OR = 0.84 (95% CI: 0.68–1.05) for case-control studies. Five cohort studies69,73,74,76,77 provided results on postmenopausal women
(RR = 0.94 95% CI: 0.87–1.00) and three cohort studies69,73,77 on about premenopausal women (RR = 0.90 95%
CI: 0.72–1.12) (Table 4). Only two case-control studies provided results according menopausal status38,64 without
being significant in both groups.
Figure 2. (a) Forest plot for the relationship between 25(OH)D and breast cancer in case control studies. (b) Forest plot for the relationship between 25(OH)D and breast cancer in nested case control studies.
Exposition Group (Number of studies) Type of study OR/RR (95% CI) I2
25(OH)D All (n = 29) Case-control 0.65 (0.56–0.76) 40.87% All (n = 4) Cohort 0.85 (0.74–0.98) 3.56% ER+ (n = 5) Case-control 0.98 (0.85–1.13) 0% ER– (n = 5) Case-control 0.86 (0.64–1.15) 15.60% Postmenopausal (n = 19) Case-control 0.74 (0.59–0.93) 13.16% Postmenopausal (n = 3) Cohort 1.15 (0.59–2.23) 8% Premenopausal (n = 9) Case-control 0.63 (0.49–0.80) 8.37% Dietary vitamin D All (n = 8) Case-control 0.91 (0.72–1.17) 30.73% All (n = 5) Cohort 1.00 (0.93–1.07) 0% Postmenopausal (n = 4) Case-control 0.78 (0.68–0.90) 0% Postmenopausal (n = 5) Cohort 0.95 (0.83–1.09) 19.13% Premenopausal (n = 5) Case-Control 0.65 (0.52–0.82) 0% Premenopausal (n = 3) Cohort 1.01 (0.86–1.18) 0% Vitamin D supplements All (n = 5) Case-control 0.78 (0.63–0.98) 25.94%
All (n = 2) Cohort 1.06 (0.90–1.25) 0% Total Vitamin D intake
(dietary + supplements)
All (n = 4) Case-control 0.84 (0.68–1.05) 18.65% All (n = 2) Cohort 0.93 (0.86–1.02) 0% Postmenopausal (n = 5) Cohort 0.94 (0.87–1.02) 17.64% Premenopausal (n = 3) Cohort 0.90 (0.72–1.12) 10.83%
Discussion
According to our results, 25(OH)D levels were associated with smaller risk of breast cancer in both case-control and cohort studies; these results were consistent on premenopausal women for case-control studies but could not be analyzed for cohort studies. Results for the relationships between breast cancer and dietary vitamin D or between breast cancer and vitamin D supplements, however, showed a protective association only in case-control studies.
In relation to the influence of vitamin D on breast cancer development prospective (cohort and nested case-control) and case control studies tend to show discrepant results: case-control studies usually show a protec-tive effect while prospecprotec-tive studies rarely find it87. This discrepancy might be the result of several factors: Firstly,
it is well known that prospective studies are less prone to be affected by both information and reverse-causation bias. Secondly, several authors highlight the season when the vitamin D measurement was made as a potential limitation of case-control studies. Eliassen et al.33 in a nested case-control study found an inverse association
between serum 25(OH) D levels and breast cancer limited only to summer measures. It can be assumed that people with low vitamin D levels in summer would also have low levels year-round; therefore, vitamin D levels in summer would be more adequate for analyzing vitamin D – breast cancer relationship than vitamin D levels in any other moment of the year.
When stratifying by menopausal status, our meta-analysis shows a consistent protective effect of 25(OH) D in both case-control and nested case-control studies, but only in premenopausal women. There are different explanations for the influence of menopausal status in the relationship between vitamin D and breast cancer. One of them may be related to the joint relationship between vitamin D and insulin-like growth factors (IGFs). IGF-I is a mitogenic and antiapoptotic peptide that can stimulate the proliferation of breast epithelial cells, increasing the risk of neoplastic transformation88,89. The active vitamin D metabolite is able to block the mitogenic effects
of IGF-I, leading to a decrease in proliferation and an increase in apoptosis90. As there is a physiological decline
of the IGF with aging91, the interaction between IGF pathways and vitamin D is likely to be stronger for
premen-opausal than for postmenpremen-opausal women, leading to greater risk reduction in premenpremen-opausal breast cancer73,92.
Finally, high levels of vitamin D may reduce progesterone and estradiol, providing a potential mechanism for reducing breast cancer risk in young women93.
Previous meta-analyses of prospective studies showed contradictory results. Kim et al.13 (who included 24
studies, 14 of those having measured serum 25(OH)D) found a slightly stronger inverse association among premenopausal than among postmenopausal women but without significant differences, whereas in the meta-analysis of Bauer et al.8 (nine studies included) the inverse association was only observed in
postmenopau-sal women. In our meta-analysis, new prospective studies31,33,41,56,58,59,67,78–81,94 not included in previous reviews,
were added and this fact may explain the differences in the results.
Concerning hormonal receptors (ER+/ER−), the relationship with breast cancer remains controversial. On the one hand, a decreased risk in ER+ would be expected, since it seems that sensitivity to 1,25(OH)2D is gener-ally reported as being higher in breast cancer cells that express the estrogen receptor than in those that do not93,95.
It has been demonstrated that treating breast cancer cells ER+ with 1,25(OH)D3 induces a cell cycle shutdown in GO/G13,96. On the other hand, two-thirds of triple negative tumors express VDR97 and it has been
demon-strated that VDR expression is inversely associated with more aggressive breast cancer98. In consonance with
previous epidemiological studies32,33,42,45, our study does not reach significant differences when the analysis was
performed separately in ER+ or ER− subgroups. However, other studies found a decreased risk of ER− breast cancer regarding the serum levels of 25 (OH) D18,60.
Figure 3. (a) Forest plot for the relationship between 25(OH)D and premenopausal breast cancer in case control studies. (b) Forest plot for the relationship between 25(OH)D and premenopausal breast cancer in nested case control studies.
No relationship is found between the level of circulating 1,25(OH)2D and breast cancer. This result is con-sistent with previous studies9, while Janowsky et al.39 found an inverse association. Several authors consider that
1,25(OH)2D is not a good indicator of vitamin D status: First, 1,25(OH)2D’s half-life is only 4–6 h, whereas 25(OH)D’s half-life is 3 weeks; second, 1,25(OH)2D is influenced by many factors10, for instance, it can be
elevated in patients with vitamin D deficiency as a result of hyperparathyroidism12,99; finally, as 1,25(OH)2D
is metabolized by 1-α -hydroxylase in breast tissue, plasma levels may not adequately represent breast tissue levels12,100.
We do not find a relationship between vitamin D intake and breast cancer in the overall analysis. In contrast, when stratifying by menopausal status, a protective effect is observed in case-control studies in both premeno-pausal and postmenopremeno-pausal women, whereas this association is not present in cohort studies. On the other hand, when analyzing the influence of vitamin D supplements on breast cancer risk, we find a borderline protective effect.
In the relationship between vitamin D intake (dietary and/or supplements) and breast cancer, most observa-tional studies showed non-significant differences; only two articles17,53 found a protective association. In a
previ-ous meta-analysis13, this association was not significant for either vitamin D intake or supplements.
A probable explanation for the lack of association observed in the analysis of dietary intake or supplements compared to the 25(OH)D levels may be that the main source of vitamin D is sunlight rather than food or supplements.
In addition, the French E3N Cohort Study12 reported that high vitamin D intake is associated with lower
breast cancer risk in regions with high ultraviolet solar radiance. These results suggested that the total amount of vitamin D needed to reach a protective effect on breast cancer is too high to be achieved in regions with low ultraviolet radiance. Under these circumstances, as the vitamin D intake has to be higher than the usually recom-mended, it could eventually lead to side effects such as hypercalcemia, constipation or muscle weakness.
Our study has some limitations; firstly each article uses different cutoff points according to serum levels of vitamin D. To analyze it we restricted our analysis to the comparison between the highest vs. lowest category of exposure. This analysis strategy does not allow for a dose-response analysis. Moreover, we carried out a sensitivity analysis excluding one study at a time, showing that no single study substantially affected the pooled RR/OR. Secondly, there is huge variability in the literature on the type of vitamin D studied, which makes it difficult to perform the analysis. In addition, levels of vitamin D depend on the season, so it would be advisable to take all samples at the same time, or at least refer to when they were collected75. Thirdly, case-control studies are more
prone to methodological issues, such as recall and selection biases, which limits the strength and quality of evi-dence. However, about half of the case-control studies included in our meta-analysis are nested in cohort studies, which minimizes the possibility of introducing biases. Finally, breast cancer is a heterogeneous disease and it is possible that vitamin D only affects certain breast cancer subtypes. However, this aspect has been scarcely studied in primary articles, so we have not been able to analyze it in the present meta-analysis.
Despite these limitations, our study also has several strengths; first, we have gathered all the observational studies published in the last twenty years. In addition, we have focused the analysis on different types of vitamin D exposure (diet, supplements and blood-levels of 25(OH) D and 1,25(OH)2D) whereas other meta-analyses are only focused on 25(OH)D levels9,10,16,99 or vitamin D intake12. This strategy allows us to obtain a more detailed
analysis of the relationship between vitamin D and breast cancer.
In conclusion, our meta-analysis supports the hypothesis that high serum levels of 25(OH) vitamin D has a protective effect on breast cancer risk in premenopausal women; we cannot draw the same conclusion regarding vitamin D intake or supplements of vitamin D since the number of studies are still limited and publication biases cannot be excluded.
References
1. Siegel, R. L., Miller, K. D. & Jemal, A. Cancer statistics. CA Cancer J Clin. 66, 7–30 (2016).
2. Habib, O. S. et al. Epidemiology of Breast Cancer among Females in Basrah. Asian Pac J Cancer Prev. 17, 91–5 (2016).
3. Colston, K. W. & Hansen, M. Mechanisms implicated in the growth regulatory effects of vitamin D in breast cancer. Endocr Relat
Cancer. 9, 45–59 (2001).
4. Simboli-Campbell, M., Narvaez, C. J., Tenniswood, M. & Welsh, J. E. 1α,25(OH)2D3 induces morphological and biochemical indices of apoptosis in MCF-7 breast cancer cells. Journal of Steroid Biochemistry and Molecular Biology 58, 367–376 (1996). 5. Welsh, J. E. Induction of apoptosis in breast cancer cells in response to vitamin D and antiestrogens. Biochemistry and Cell Biology
72, 537–545 (1994).
6. James, S. Y., Mackay, A. G. & Colston, K. W. Effects on 1,25 dihydroxyvitamin D3 and its analogues on induction of apoptosis in breast cancer cells. Journal of Steroid Biochemistry and Molecular Biology 58, 395–401 (1996).
7. Khan, Q. J., Kimler, B. F. & Fabia, C. J. The Relationship Between Vitamin D and Breast Cancer Incidence and Natural History. Curr
Oncol Rep. 12, 136–142 (2010).
8. Bauer, S. R., Hankinson, S. E., Bertone-Johnson, E. R. & Ding, E. L. Plasma Vitamin D Levels, Menopause, and Risk of Breast Cancer: Dose-Response Meta-Analysis of Prospective Studies. Medicine. 92, 123–131 (2013).
9. Chen, P. et al. Meta-analysis of vitamin D, calcium and the prevention of breast cancer. Breast Cancer Res Treat 121, 469–77 (2010). 10. Chen, P. et al. Higher Blood 25(OH)D Level May Reduce the Breast Cancer Risk: Evidence from a Chinese Population Based
Case-Control Study and Meta-analysis of the Observational Studies. PLoS One. 8, e49312 (2013).
11. Gandini, S. et al. Meta-analysis of observational studies of serum 25-hydroxyvitamin D levels and colorectal, breast and prostate cancer and colorectal adenoma. Int J Cancer. 128, 1414–24 (2011).
12. Gissel, T., Rejnmark, L., Mosekilde, L. & Vestergaard, P. Intake of vitamin D and risk of breast cancer–a meta-analysis. J Steroid
Biochem Mol Biol 111, 195–9 (2008).
13. Kim, Y. & Je, Y. Vitamin D intake, blood 25(OH)D levels, and breast cancer risk or mortality: a meta-analysis. Br J Cancer 110, 2772–84 (2014).
14. Mohr, S. B. et al. Serum 25-Hydroxyvitamin D and Prevention of Breast Cancer: Pooled Analysis. Anticancer Res 31, 2939–48 (2011).
15. Wang, D., Velez de-la-Paz, O. I., Zhai, J. X. & Liu, D. W. Serum 25-hydroxyvitamin D and breast cancer risk: a meta-analysis of prospective studies. Tumor Biology 34, 3509 (2013).
16. Yin, L. et al. Meta-analysis: Serum vitamin D and breast cancer risk. Eur J Cancer 4, 2196–2205 (2010).
17. Abbas, S., Linseisen, J. & Chang-Claude, J. Dietary Vitamin D and Calcium Intake and Premenopausal Breast Cancer Risk in a German Case-Control Study. Nutr Cancer. 59, 54–61 (2007).
18. Abbas, S. et al. Serum 25-hydroxyvitamin D and risk of post-menopausal breast cancer—results of a large case–control study.
Carcinogenesis. 29, 93–99 (2008).
19. Abbas, S., Linseisen, J. & Chang-Claude, J. Plasma 25-hydroxyvitamin D and premenopausal breast cancer risk in a German case-control study. Int J Cancer. 124, 250–5 (2009).
20. Alipour, S. et al. Levels of Serum 25-Hydroxy-Vitamin D in Benign and Malignant Breast Masse. Asian Pac J Cancer Prev. 15, 129–32 (2014).
21. Almquist, M., Bondeson, A. G., Bondeson, L., Malm, J. & Manjer, J. Serum levels of vitamin D, PTH and calcium and breast cancer risk—a prospective nested case–control study. Int J Cancer. 127, 2159–2168 (2010).
22. Amir, E. et al. 25-Hydroxy vitamin-D, obesity, and associated variables as predictors of breast cancer risk and tamoxifen benefit in NSABP-P1. Breast Cancer Res Treat. 133, 1077–1088 (2012).
23. Anderson, L. N., Cotterchio, M., Cole, D. E. & Knight, J. A. Vitamin D-Related Genetic Variants, Interactions with Vitamin D Exposure, and Breast Cancer Risk among Caucasian Women in Ontario. Cancer Epidemiol Biomarkers Prev. 20, 1708–17 (2011). 24. Anderson, L. N., Cotterchio, M., Vieth, R. & Knight, J. A. Vitamin D and calcium intakes and breast cancer risk in pre- and
postmenopausal women. Am J Clin Nutr 91, 1699–707 (2010).
25. Bertone-Johnson, E. R. et al. Plasma 25-Hydroxyvitamin D and 1,25-Dihydroxyvitamin D and Risk of Breast Cancer. Cancer
Epidemiol Biomarkers Prev 14, 1991–7 (2005).
26. Bidgoli, S. A. & Azarshab, H. Role of Vitamin D Deficiency and Lack of Sun Exposure in the Incidence of Premenopausal Breast Cancer: a Case Control Study in Sabzevar, Iran. Asian Pac J Cancer Prev 15, 3391–6 (2014).
27. Bilinski, K. & Boyages, J. Association between 25-hydroxyvitamin D concentration and breast cancer risk in an Australian population: an observational case–control study. Breast Cancer Res Treat. 137, 599–607 (2013).
28. Chlebowski, R. T. et al. Calcium Plus Vitamin D Supplementation and the Risk of Breast Cancer. J Natl Cancer Inst. 100, 1581–91 (2008).
29. Colagar, A. H., Firouzjah, H. J. & Halalkho, S. Vitamin D Receptor Poly(A) Microsatellite Polymorphism and 25-Hydroxyvitamin D Serum Levels: Association with Susceptibility to Breast Cancer. J Breast Cancer. 18, 119–12 (2015).
30. Crew, K. D. et al. Association between Plasma 25-Hydroxyvitamin D and Breast Cancer Risk. Cancer Prev Res. 2, 589–604 (2009). 31. Deschasaux, M. et al. Weight Status and Alcohol Intake Modify the Association between Vitamin D and Breast Cancer Risk. J Nutr.
143, 576–85 (2016).
32. Eliassen, A. H. et al. Plasma 25-hydroxyvitamin D and risk of breast cancer in the Nurses’ Health Study II. Breast Cancer Res. 13, R50 (2011).
33. Eliassen, A. H. et al. Plasma 25-hydroxyvitamin D and risk of breast cancer in women followed over 20 years. Cancer Res. 76, 5423–30 (2016).
34. Engel, P. et al. Serum 25(OH) Vitamin D and Risk of Breast Cancer: A Nested Case-Control Study from the French E3N Cohort.
Cancer Epidemiol Biomarkers Prev. 19, 2341–50 (2010).
35. Fedirko, V. et al. Serum 25-hydroxyvitamin D and risk of breast cancer: results of a large population-based case–control study in Mexican wome. Cancer Causes Control. 23, 1149–62 (2012).
36. Freedman, M. et al. Serum Levels of Vitamin D Metabolites and Breast Cancer Risk in the Prostate, Lung, Colorectal, and Ovarian Cancer Screening Trial. Cancer Epidemiol Biomarkers Prev. 17, 889–94 (2008).
37. Hiatt, R. A. et al. Prediagnostic Serum Vitamin D and Breast Cancer. J Natl Cancer Inst. 90, 461–3 (1998).
38. Jamshidinaeini, Y., Akbari, M. E., Abdollahi, M., Ajami, M. & Davoodi, S. H. Vitamin D Status and Risk of Breast Cancer in Iranian Women: A Case–Control Stud. J Am Coll Nutr. 35, 639–646 (2016).
39. Janowsky, E. C. et al. Association between low levels of 1,25-dihydroxyvitamin D and breast cancer risk. Public Health Nutr. 2, 283–29 (1999).
40. Kawase, T. et al. Association between vitamin D and calcium intake and breast cancer risk according to menopausal status and receptor status in Japan. Cancer Sci. 101, 1234–40 (2010).
41. Kim, Y. et al. Plasma 25-hydroxyvitamin D3 is associated with decreased risk of postmenopausal breast cancer in whites: a nested case-control study in the multiethnic cohort study. BMC Cancer. 17(14), 29 (2014).
42. Kühn, T. et al. Plasma 25-hydroxyvitamin D and the risk of breast cancer in the European Prospective Investigation into Cancer and Nutrition: A nested case–control study. Int J Cancer. 133, 1689–700 (2013).
43. Levi, F., Pasche, C., Lucchini, F. & La Vecchia, C. Dietary intake of selected micronutrients and breast-cancer risk. Int J Cancer. 91, 260–3 (2001).
44. Lowe, L. C. et al. Plasma 25-hydroxy vitamin D concentrations, vitamin D receptor genotype and breast cancer risk in a UK Caucasian population. Eur J Cancer. 41, 1164–9 (2005).
45. McCullough, M. L. et al. Serum 25-hydroxyvitamin D concentrations and postmenopausal breast cancer risk: a nested case control study in the Cancer Prevention Study-II Nutrition Cohort. Breast Cancer Res. 11, R64 (2009).
46. Mohr, S. B. et al. Serum 25-hydroxyvitamin D and breast cancer in the military: a case–control study utilizing pre-diagnostic serum. Cancer Causes Control. 24, 495–504 (2013).
47. Neuhouser, M. L. et al. The Influence of Health and Lifestyle Characteristics on the Relation of Serum 25-Hydroxyvitamin D With Risk of Colorectal and Breast Cancer in Postmenopausal Women. Am J Epidemio. 175, 673–84 (2012).
48. Oliveira-Sediyama, C. M. et al. Lifestyle and vitamin D dosage in women with breast cancer. Nutr Hosp. 33, 1179 (2016). 49. Park, S. et al. Serum 25-hydroxyvitamin D deficiency and increased risk of breast cancer among Korean women: a case–control
study. Breast Cancer Res Treat. 152, 147–54 (2015).
50. Potischman, N. et al. Intake of food groups and associated micronutrients in relation to risk of early-stage breast cancer. Int J
Cancer. 82, 315–21 (1999).
51. Rejnmark, L. et al. Reduced prediagnostic 25-hydroxyvitamin D levels in women with breast cancer: a nested case-control study.
Cancer Epidemiol Biomarkers Prev. 18, 2655–60 (2009).
52. Rollison, D. E. et al. Vitamin D intake, vitamin D receptor polymorphisms, and breast cancer risk among women living in the southwestern U.S. Breast Cancer Res Treat. 132, 683–91 (2012).
53. Rossi, M. et al. Vitamin D intake and breast cancer risk: a case-control study in Italy. Ann Oncol. 20, 374–8 (2009).
54. Salarabadi, A., Bidgoli, S. A. & Madani, S. H. Roles of Kermanshahi Oil, Animal Fat, Dietary and Non- Dietary Vitamin D and other Nutrients in Increased Risk of Premenopausal Breast Cancer: A Case Control Study in Kermanshah, Iran. Asian Pac J Cancer
Prev. 16, 7473–8 (2015).
55. Scarmo, S. et al. Circulating levels of 25-hydroxyvitamin D and risk of breast cancer: a nested case-control study. Breast Cancer Res.
133, 1689–700 (2013).
56. Shirazi, L., Almquist, M., Borgquist, S. & Manjer, J. Serum vitamin D (25OHD3) levels and the risk of different subtypes of breast cancer: A nested case-control study. Breast. 28, 184–190 (2016).
57. Simard, A., Vobecky, J. & Vobecky, J. S. Vitamin D deficiency and cancer of the breast: an unprovocative ecological hypothesis. Can
58. Sofi, N. Y. et al. Nutritional risk factors and status of serum 25(OH)D levels in patients with breast cancer: A case control study in India. J Steroid Biochem Mol Biol. 175, 55–59 (2016).
59. Wang, J., Eliassen, A. H., Spiegelman, D., Willett, W. C. & Hankinson, S. E. Plasma free 25-hydroxyvitamin D, vitamin D binding protein, and risk of breast cancer in the Nurses’ Health Study II. Cancer Causes Control. 25, 819–27 (2014).
60. Yao, S. et al. Pretreatment Serum Concentrations of 25-Hydroxyvitamin D and Breast Cancer Prognostic Characteristics: A Case-Control and a Case-Series Study. PLoS One 6, e17251 (2011).
61. Yousef, F. M. et al. Vitamin D status and breast cancer in Saudi Arabian women: case-control study. Am J Clin Nutr. 98, 105–10 (2013).
62. Wu, Y., Sarkissyan, M., Clayton, S., Chlebowski, R. & Vadgama, J. V. Association of Vitamin D3 Level with Breast Cancer Risk and Prognosis in African-American and HispanicWomen. Cancers. 9, 144 (2017).
63. Sofi, N. Y. et al. Reproductive factors, nutritional status and serum 25(OH)D levels in women with breast cancer: A case control study. Journal of Steroid Biochemistry and Molecular Biology 175, 200–204 (2018).
64. Lee, M. S. et al. Vitamin D Decreases Risk of Breast Cancer in Premenopausal Women of Normal Weight in Subtropical Taiwan. J
Epidemiol. 21, 87–94 (2011).
65. Leung, H. W. C., Muo, C. H., Liu, C. F. & Chan, A. L. F. Vitamin D3 Intake Dose and Common Cancer: A Population-Based Case Control Study in a Chinese Population. Journal of Cancer 7, 2028–2034 (2016).
66. Abbas, S. et al. Dietary Intake of Vitamin D and Calcium and Breast Cancer Risk in the European Prospective Investigation into Cancer and Nutrition. Nutr Cancer. 65, 178–87 (2013).
67. Cadeau, C. et al. Interaction between current vitamin D supplementation and menopausal hormone therapy use on breast cancer risk: evidence from the E3N cohort. Am J Clin Nutr. 102, 966–73 (2015).
68. Edvardsen, K. et al. Vitamin D-effective solar UV radiation, dietary vitamin D and breast cancer risk. Int J Cancer. 128, 1425–1433 (2011).
69. Engel, P., Fagherazzi, G., Mesrine, S., Boutron-Ruault, M. C. & Clavel-Chapelon, F. Joint Effects of Dietary Vitamin D and Sun Exposure on Breast Cancer Risk: Results from the French E3N Cohort. Cancer Epidemiol Biomarkers Prev. 20, 187–98 (2010). 70. Frazier, A. L., Li, L., Cho, E., Willett, W. C. & Colditz, G. A. Adolescent diet and risk of breast cancer. Cancer Causes Control. 15,
73–82 (2004).
71. John, E. M., Schwartz, G. G., Dreon, D. M. & Koo, J. Vitamin D and Breast Cancer Risk: The NHANES I Epidemiologic Follow-up Study, 1971–1975 to 1992. Cancer Epidemiol Biomarkers Prev 8, 399–406 (1999).
72. Kuper, H. et al. Prospective study of solar exposure, dietary vitamin D intake, and risk of breast cancer among middle-aged women.
Cancer Epidemiol Biomarkers Prev. 18, 2558–6 (2009).
73. Lin, J. et al. Intakes of calcium and vitamin D and breast cancer risk in women. Arch Intern Med. 167, 1050–9 (2007).
74. McCullough, M. L. et al. Dairy, Calcium, and Vitamin D Intake and Postmenopausal Breast Cancer Risk in the Cancer Prevention Study II Nutrition Cohort. Cancer Epidemiol Biomarkers Prev 14, 2898–904 (2005).
75. Ordóñez-Mena, J. M. et al. Serum 25-hydroxyvitamin d and cancer risk in older adults: results from a large German prospective cohort study. Cancer Epidemiol Biomarkers Prev. 22, 905–16 (2013).
76. Robien, K., Cutler, G. J. & Lazovich, D. Vitamin D intake and breast cancer risk in postmenopausal women: the Iowa Women’s Health Study. Cancer causes control. 18, 775–782 (2007).
77. Shin, M. H. et al. Intake of Dairy Products, Calcium, and Vitamin D and Risk of Breast Cancer. J Natl Cancer Inst 94, 1301–11 (2002).
78. Skaaby, T. et al. Prospective population-based study of the association between serum 25-hydroxyvitamin-D levels and the incidence of specific types of cáncer. Cancer Epidemiol Biomarkers Prev 23, 1220–9 (2014).
79. O’Brien, K. M., Sandler, D. P., Taylor, J. A. & Weinberg, C. R. Serum Vitamin D and Risk of Breast Cancer within Five Years.
Environ Health Perspect 25, 077004, https://doi.org/10.1289/EHP943 (2017).
80. Palmer, J. R. et al. Predicted 25-hydroxyvitamin D in relation to incidence of breast cancer in a large cohort of African American women. Breast Cancer Research 18, 86 (2016).
81. Ordoñez-Mena, J. M. et al. Pre-diagnostic vitamin D concentrations and cancer risks in older individuals: an analysis of cohorts participating in the CHANCES consortium. Eur J Epidemiol. 31, 311–23 (2016).
82. Elma, E. V. et al. Declaración de la Iniciativa STROBE (Strengthening the Reporting of Observational studies inEpidemiology): directrices para la comunicación de estudios observacionales. Revista Española de Salud Pública 82, 144–150 (2008).
83. Higgins, J. P. & Thompson, S. G. Quantifying heterogeneity in a meta-analysis. Stat Med. 21, 1539–58 (2002). 84. DerSimonian, R. & Laird, N. Meta-analysis in clinical trials. Control Clin Trials 7, 177–188 (1986).
85. Egger, M., Davey, S. G., Schneider, M. & Minder, C. Bias in meta-analysis detected by a simple, graphical test. BMJ. 315, 629–34 (1997).
86. Light, R. J. & Pillemer, D. B. Summing up: the science of reviewing research. Cambridge: Harvard University Press. (1984). 87. Moukayed, M. & Grant, W. B. The roles of UVB and vitamin D in reducing risk of cancer incidence and mortality: A review of the
epidemiology, clinical trials, and mechanisms. Rev Endocr Metab Disord. 18, 167–182 (2017).
88. Hankinson, S. E. et al. Plasma Sex Steroid Hormone Levels and Risk of Breast Cancer in Postmenopausal women. J Natl Cancer
Inst. 90, 1292–1299 (1998).
89. Christopoulos, P. F., Msaouel, P. & Koutsilieris, M. The role of the insulin-like growth factor-1 system in breast cancer. 15, 43 (2015).
90. Ameri, P. et al. Interactions between vitamin D and IGF-I: from physiology to clinical practice. Clin Endocrinol (Oxf). 79, 457–63 (2013).
91. Gomez, M. The role of insulin-like growth factor I components in the regulation of vitamin D. Curr Pharm Biotechnol. 7, 125–32 (2006).
92. Chlebowski, R. T. Vitamin D and breast cancer: interpreting current evidence. Breast Cancer Res. 3, 217 (2011).
93. Knight, J. A., Wong, J., Blackmore, M., Raboud, J. M. & Vieth, R. Vitamin D association with estradiol and progesterone in young women. Cancer Causes Control. 21, 479 (2010).
94. Cadeau, C. et al. Postmenopausal breast cancer risk and interactions between body mass index, menopausal hormone therapy use, and vitamin D supplementation: Evidence from the E3N cohort. Int. J. Cancer. 139, 2193–2200 (2016).
95. Narvaez, C. J., Zinser, G. & Welsh, J. Functions of 1,25-dihydroxyvitamin D3 in mammary gland: from normal development to breast cancer. Steroids. 66, 301–8 (2001).
96. Shao, T., Klein, P. & Grossbard, M. L. Vitamin D and Breast Cancer. Oncologist. 17, 36–45 (2012).
97. Thakkar, A. et al. Vitamin D and androgen receptor-targeted therapy for triple-negative breast cancer. Breast Cancer Res Treat
157(1), 77–90 (2016).
98. Al-Azhri et al. Tumor Expression of Vitamin D Receptor and Breast Cancer Histopathological Characteristics and Prognosis. Clin
Cancer Res 23(1), 97–103 (2016).
99. Garland, C. F. et al. Vitamin D and prevention of breast cancer: pooled analysis. J Steroid Biochem Mol Biol 103, 708–711 (2007). 100. Bertone-Johnson, E. R. Vitamin D and breast cancer. Ann Epidemiol 19, 462–467 (2009).
Author Contributions
N.E., T.D.S. and I.G.A. contributed substantially to the conception, design and acquisition of data. N.E. and T.D.S.: wrote the main manuscript text. N.E. and C.P. prepared figures. T.D.S., I.G.A. and J.L. contributed to the analysis and interpretation of the data. N.E. and T.D.S., I.G.A., C.P. and J.L. contributed to devising the draft of the article and all of the other authors revised it critically. All authors participated in revising the manuscript and in the final approval of the version to be published.
Additional Information
Supplementary information accompanies this paper at https://doi.org/10.1038/s41598-018-27297-1.
Competing Interests: The authors declare no competing interests.
Publisher's note: Springer Nature remains neutral with regard to jurisdictional claims in published maps and institutional affiliations.
Open Access This article is licensed under a Creative Commons Attribution 4.0 International License, which permits use, sharing, adaptation, distribution and reproduction in any medium or format, as long as you give appropriate credit to the original author(s) and the source, provide a link to the Cre-ative Commons license, and indicate if changes were made. The images or other third party material in this article are included in the article’s Creative Commons license, unless indicated otherwise in a credit line to the material. If material is not included in the article’s Creative Commons license and your intended use is not per-mitted by statutory regulation or exceeds the perper-mitted use, you will need to obtain permission directly from the copyright holder. To view a copy of this license, visit http://creativecommons.org/licenses/by/4.0/.