THESIS WORK
Master of Science in Energy and Environment
Instituto Tecnológico de Buenos Aires - Karlsruhe Institute of TechnologyFEASIBILITY STUDY FOR A MEDIUM-ENTHALPY
GEOTHERMAL POWER PLANT IN
ROSARIO DE LA FRONTERA, SALTA, ARGENTINA
Niklas Brender
Mechanical Engineer (KIT)
Tutor
Lic. geol. Alejandro Conde (SegemAR) Dr. Dietmar Kuhn (KIT)
Examiners
Dra. Silvia Barredo
Dra. Ing. Cecilia Smoglie (ITBA) Prof. Dr. Ing. Martin Gabi (KIT)
Declaration of Authorship
I declare that I have developed and written the enclosed Master Thesis completely by myself, and have not used sources or means without declaration in the text. Any thoughts from others or literal quotations are clearly marked. The Master Thesis was not used in the same or in a similar version to achieve an academic grading or is being published elsewhere.
Buenos Aires, 24. August, 2018
Abstract
In this study the surrounding of Rosario de la Frontera was investigated for its suitability for geothermal energy production. The area is located in north-western Argentina, in the province of Salta, which is at the foothills of the Andean retro-wedge and in the northern part of the Sierra de la Candelaria anticline. In this region there are 13 hot springs with temperatures between 24.1◦C to 90.5◦C, which have been used for commercial purposes since 1880 and geological investigations were carried out early on, suggesting a large hydrothermal reservoir at a maximum depth of 3000 meters. In 2012 the presence of two aquifers at different depths was detected with the help of audiomagnetotelluric investigations and recent studies indicate these depths to 150 meters and 2400 meters respectively. Samples and calculations show temperatures between 100◦C to 130◦C and a permeability of 49 - 81.2 mD for the deep aquifer.
Based on these data, the focus was placed on the performance calculation of an Organic Rankine Cycle (ORC) power plant. Thereby, a power plant adapted to the boundary conditions in Rosario de la Frontera can deliver net outputs between 388.9 kW to 893.9 kW for well head temperatures ranging from 95◦C to 125◦C. In contrast, the achievable net outputs of two example turnkey systems are in the range of 137 kW - 491 kW.
En este estudio se examinó la aptitud de los alrededores de Rosario de la Frontera para la producción de energía geotérmica. La zona está ubicada en el noroeste de Argentina, en la provincia de Salta, al pie de la cordillera de los Andes, la misma yace al norte del anticlinal de la Sierra de la Candelaria. En esta región se encuentran 13 fuentes de aguas termales con temperaturas entre 24.1◦C a 90.5◦C, han sido utilizadas desde 1880 con fines comerciales. Con el paso del tiempo se han ido realizando varias investigaciones geológicas, lo que sugiere la existencia de un gran reservorio hidrotérmico a una máxima profundidad de 3000 metros. En el año 2012 se pudo detectar la presencia de dos acuíferos a diferentes profundidades, uno a 150 metros y el otro a 2400 metros, con la ayuda de investigaciones audiomagnetotelúricas. Las muestras y los cálculos indican temperaturas entre 100◦C y 130◦C con una permeabilidad de 49 - 81.2 mD para el acuífero profundo.
Contents
Contents
Contents I
Nomenclature IV
List of Tables VIII
List of Figures IX
1 Introduction 1
1.1 Motivation 1
1.2 Objective and structure of this thesis 2
2 Fundamentals of geothermal energy 3
2.1 Geothermal energy around the world and in Argentina 3 2.1.1 Structure and energy supply of the Earth 3 2.1.2 Status of geothermal energy around the world 5
2.1.3 Geothermal situation in Argentina 6
2.2 Concepts of geothermal usage 9
2.2.1 Hydrothermal resources 9
2.2.2 Petrothermal resources 10
2.2.3 Stimulation options 11
3 Exploitation technology 14
3.1 Drilling technology 14
3.2 Geothermal power plants 17
3.2.1 Thermodynamic cycle 18
3.2.2 Organic Rankine Cycle 19
3.2.3 Kalina Cycle 21
3.3 Optional heat sources 22
3.3.1 Solar energy 22
3.3.2 Biomass 23
3.4 Examples of low- to medium-enthalpy geothermal power plants 24
3.4.2 Medium-enthalpy ORC in Fang, Chiang Mai 24
3.4.3 Kalina cycle in Húsavík 25
4 Analysis of the geothermal field at Rosario de la Frontera 26 4.1 Characterization of the thermal water resource 26
4.1.1 Geological conditions 26
4.1.2 Geochemical conditions 30
4.2 Infrastructure and energy demand 33
4.3 Simulation program GeSi 34
4.4 Performance model for tailored solutions 36
4.4.1 Simulation for different well head temperatures 39
4.4.1.1 Calculation for 95◦C 40
4.4.1.2 Calculation for 105◦C 43
4.4.1.3 Calculation for 115◦C 44
4.4.1.4 Calculation for 125◦C 46
4.4.2 Seasonal cycle calculation 47
4.4.3 Partial load calculation 50
4.5 Performance model for turnkey solutions 53
4.5.1 Electratherm 54
4.5.2 SUMEC 56
4.6 Power output for district heating 59
4.7 Risks and environmental impact 61
5 Economic and financial analysis for different solutions 63
5.1 Regulations and support 63
5.1.1 National and provincial regulations 64
5.1.2 Incentives 66
5.2 Assessment of installation cost 68
5.2.1 Independent cost 68
5.2.2 Tailored solution 71
5.2.3 Turnkey solutions 71
5.2.3.1 Electratherm 71
5.2.3.2 SUMEC 72
5.3 Investment calculation 72
5.3.1 Levelized Costs 72
5.3.2 Net present value and internal rate of return 73
5.3.3 Costs of the different variants 74
5.3.3.1 Tailored solution at 95◦C 74
Contents
5.3.3.3 Tailored solution with increased flow rate 77
5.3.3.4 Turnkey solution: Electratherm 78
5.3.3.5 Turnkey solution: SUMEC 80
5.3.4 District heating 81
6 Evaluation of the work 83
6.1 Technical assumptions 83
6.2 Economic assumptions 84
7 Summary and prospects 85
7.1 Conclusion 85
7.2 Prospects 87
Bibliography XI
Nomenclature
Abbreviations
AGEERA Asociación de Generadores de Energía Eléctrica de la República Argentina, engl.: Association of Electricity Producers of the Argen-tinine Republic
ARS Argentine Peso
CAMMESA Compañía Administradora del Mercado Mayorista Eléctrico, engl.: Wholesale Electricity Market Management Company
CF Capacity Factor
CFC Chlorofluorocarbon
CGA Cámara Geotérmica Argentina, engl.: Argentine Geothermal Chamber
CP Critical Point
CHP Combined Heat and Power
COP Conference of the Parties
DFN Discrete Fracture Network
EGS Enhanced/Engineered Geothermal System
ENARSA Energía Argentina S.A.
ENRE Ente Nacional Regulador de la Electricidad, engl.: National Elec-tricity Regulatory Agency
engl. English
fig. Figure
FM Formation
FODER Fondo para el Desarollo de Energías Renovables, engl.: Renew-able Energy Development Fund
GeSi Geothermal Simulation
GEF Global Environment Fund
ger. German
GHP Ground-source Heat Pump
GUI Graphical User Interface
GWP Global Warming Potential
HC Hydrocarbon
HCFC Hydrochlorofluorocarbon
HDR Hot Dry Rock
HFC Hydrofluorocarbon
HFO Hydrofluoroolefin
HO Hydroolefin
IAEA International Atomic Energy Agency
IBRD International Bank for Reconstruction and Development
IPCC Intergovernmental Panel on Climate Change
IRR Internal Rate of Return
LCOE Levelized Cost of Energy
LWD Logging While Drilling
Ma Million years ago
mD milli Darcy
MINEM Ministerio de Energía y Minería, engl.: Ministry of Energy and Mines
Mio. Million
MWD Measurement While Drilling
NIST National Institute of Standards and Technology
NPV Net Present Value
NTA Nitrilotriacetic acid
NW North West
OCA Organic Clay Acid
ODP Ozone Depletion Potential
O&M Operation and Maintenance
ORC Organic Rankine Cycle
PERMER Proyecto de Energías Renovables en Mercados Rurales, engl.: Renewable Energy Project in Rural Markets
PM Precio Monómico
PME Precio Monómico Estacional
PPA Power Purchase Agreement
REFPROP Reference Fluid Thermodynamic and Transport Properties Database
RMA Regular Mud Acid
rpm Rotations per minute
S.A. Sociedad Anónima, engl.: Public Limited Company or Incorporated (Inc.)
sect. Section
TDS Total Dissolved Solids
TPES Total Primary Energy Supply
Symbols Description Unit
cp Heat capacity [kJ/kgK]
D Thickness of the aquifer [m]
E Generated electricity [kWh]
F Fuel cost [US$], [ARS]
д Gravitational constant [m/s2]
H Enthalpy [J]
h Specific enthalpy [J/kg]
I Investment cost [US$], [ARS]
K Permeability [mD], [m2]
kf Hydraulic conductivity [m/s]
M Maintenance cost [US$], [ARS]
m Mass [kg]
˙
m Mass flow [kg/s]
n Lifetime [years]
P Power [W]
p Pressure [Pa]
Q Heat [J]
˙
Q Heat flow [J/s], [W]
r Discount rate [%]
s Specific entropy [J/kgK ]
T Temperature [◦C], [K]
T Transmissivity [m2/s]
U Internal energy [J]
u Specific internal energy [J/kg]
V Volume [m3]
w Specific work [J/kg]
η Efficiency [-]
µ Dynamic viscosity [Ns/m2]
ρ Density [kg/m3]
Indices
c Carnot
con Condenser
dis discharged
e electric
hx Heat exchanger
i year[i]
max maximum
min minimum
net net power
nom nominal
pump Feed pump
sup supplied
t thermodynamic
th thermal
List of Tables
2.1 Top countries of geothermal direct-usage 2015 and electricity production 2015/16 6
4.1 Chemical composition, temperature, pH value and flow rate of the hot springs 32 4.2 Boundary conditions of the power calculations 37
4.3 Refrigerant properties 39
4.4 Power output results for 95◦C 42
4.5 Power output results for 105◦C 43
4.6 Power output results for 115◦C 45
4.7 Power output results for 125◦C 46
4.8 Power output for changing condensation temperatures 48 4.9 Cooling air flow rates for constant condensation temperature 49 4.10 Electratherm Power+Generator 6500 operating parameters 54 4.11 Electratherm power output for July, December and the annual average 56
4.12 SUMEC PureCycle SGPTc272design parameters 57
4.13 SUMEC power output for July, December and the annual average 59
4.14 Thermal water outlet temperatures 60
4.15 Net power output and thermal performance 61
List of Figures
List of Figures
2.1 Structure of the Earth 3
2.2 Model of convection within Earth’s mantle 4
2.3 Distribution of geothermal projects in Argentina 7
2.4 Categorization of geothermal resources 10
3.1 Scheme of a drilling rig 15
3.2 Scheme of well completion 16
3.3 Carnot-process in the T,s - diagram 18
3.4 System layout of an ORC power plant and T,s - diagram 20
3.5 Comparison between ORC and Kalina process 21
4.1 Structural provinces in NW-Argentina 27
4.2 Geological map of the Rosario de La Frontera area 29 4.3 Conceptual 3D model of the undeground fluid movement 30 4.4 Locations of the hot springs around Hotel Termas 31 4.5 Relationship between pumping power and transmissivity 38
4.6 Graphical User Interface of GeSi 40
4.7 Net power curve of R32 and R1234yf at 95◦C 41 4.8 Colormap of the net power output of R1234yf at 95◦C 41 4.9 T,s - diagram and heating-up curve of R134a at 105◦C 43 4.10 T,s - diagram and heating-up curve of R218 at 105◦C 44 4.11 Thermal water temperature after the heat exchanger at 95◦C and 115◦C 45 4.12 Net power and steam pressure curves of the fluids from 95◦C to 125◦C 46 4.13 Condensation curve and cooling air temperature of R218 at 95◦C 47
4.14 Feed pump and turbine efficiency curves 51
4.15 Net power output for different design flow rates 52
4.16 Net power output for partial load 52
4.17 Resulting net power for a declining reservoir temperature 53
4.18 ElectrathermPower+Generator 6500 54
4.19 Electratherm T,s - diagram at 95◦C and 122◦C 55
4.20 SUMECPureCycle SGPTc272 57
5.1 Electricity price development 2012 - 2018 64 5.2 Drilling costs as a function of drilling depth 69
5.3 Levelized cost of energy 73
1 Introduction
1 Introduction
1.1 Motivation
The global primary energy demand has risen continuously over the past decades. Due to enormous population growth on the one hand and rising social prosperity on the other, it can be assumed that this development will at least continue for the time being. The way in which this demand is met today, but also the amount of natural resources needed for it, has taken on dimensions that the chemist and atmospheric researcher Paul Crutzen (2000) made the concept of theAnthropocenepopular. This states that mankind has become one of the most important factors influencing almost all natural processes on earth.
Even though these influences are still largely unnoticed by the global population, people are becoming increasingly aware of them, especially as more and more institutions, above all the Intergovernmental Panel on Climate Change, are warning of the negative consequences and many countries now have ambitious goals to minimize their ecological footprint.
The main focus here is on reducing greenhouse gas emissions, which occure especially from the generation of energy from fossil fuels such as coal, oil and gas. Renewable energies should therefore not only be sustainable in terms of the used resources, but also have the goal of providing either completely emission free or emission neutral electricity and heat. Unfortunately, the most prominent representatives among renewable energies, namely wind and solar power as well as biomass plants come along with a number of disadvantages, such as highly fluctuating and therefore unreliable energy production, large surface requirement or the use of rare materials.
1.2 Objective and structure of this thesis
Similar to wind and solar energy, there are also locations for geothermal energy that are more suitable due to their local conditions, and as a result, permit higher electricity production. Therefore, this study will investigate whether the results of previous geological investigations in Rosario de la Frontera are of interest for a commercial geothermal use.
For this purpose, the origin of heat within the earth and how it is distributed worldwide will be explained first (chapter2). The main focus thereby is set on the situation in Argentina, to introduce its geothermal potential as well as to point out already advanced projects.
Based on this, the following chapter3 describes the current state of the art technology to explore deep geothermal fields, with medium enthalpy reservoirs. In addition, possibilities for increasing performance through secondary heat sources are shown and examples of already installed binary power plants are presented.
Chapter4begins by describing the geological and geochemical situation of the reservoir in Rosario de la Frontera. With this data as a basis, the performance of a possible ORC power plant is calculated with the help of a simulation program (GeSi), which was implemented at the Institute of Nuclear and Energy Technology at KIT. Thereby, various parameters are varied to assess their impact on performance. These include, for example, the temperature of the thermal water, which represents a great uncertainty at the present time, but also the influence of fluctuating ambient temperatures and thus changes in the cooling capacity of the power plant are investigated.
2 Fundamentals of geothermal energy
2 Fundamentals of geothermal energy
2.1 Geothermal energy around the world and in Argentina
2.1.1 Structure and energy supply of the Earth
The Earth is shell-shaped (fig. 2.1) with a relatively thin earth’s crust, followed by the mantle, the outer and finally the inner core. The average surface temperature is around 14◦C whereas in the inner core temperatures of around 5500◦C are expected [Litasov, Shatskiy, 2015]. Approximately 99%of the earth are hotter than 1000◦C but due to the great depth mostly unavailable for technical usage. Not only the temperature rise with depth, but also the density and pressure increase, so that in the inner core pressures of up to 360 GPa are expected. The inner core with its radius of roughly 1220 km consits of a solid iron-nickel alloy. The outer core with a thickness of approximately 2250 km however is with 4000◦C and lower pressures molten iron. Convection in the outer core and interaction of earth’s rotation give rise to the magnetic field of the earth.The strict line between core and mantel can be drawn due to a rapid decrease of density caused by the change from iron to lighter elements [Stober, Bucher, 2014, sect. 1.2].
The crystallization heat caused by the slow cooling process of the core, produce sufficient energy to heat up the earth’s mantle [Hirose et al., 2017]. This leads to a difference in density which cause a convective flow movement of the solid but (on a geological timescale) ductile material over millions of years (fig. 2.2). Thereby hot material rises from the core-mantle boundary up to higher areas, whereas cooler material sinks down. This part of the mantle is known as asthenosphere. The lithosphere lays above that and includes the uppermost part of the mantle as well as the earth’s crust. Its magnitute vary from few kilometres at mid-ocean ridges up to 200 km on the continents. Although the lithosphere itself can be regarded as rigid it “floats” on the ductile asthenosphere and is subject to a constant movement by the convective flows within the asthenosphere. The dynamic of the lithosphere is known as plate tectonics and can be assigned to three categories [Frisch et al., 2011, sect. 1]:
• Converging plateswhere two plates either collide and form mountain ranges such as the Himalaya, or an oceanic plate slides down another plate (subduction) which leads to an oceanic trench as well as volcanic mountain ranges like the Andes.
• Diverging plates result in rift events or mid-ocean ridges where ascending magma cools down and forms new oceanic crust.
• Relative movements transverse to the plate boundaries.
All of those movements have in common that they are a source of earthquakes and in many cases also of volcanic activity.
2 Fundamentals of geothermal energy
In the nowadays most explored depths up to 6000 m the average geothermal gradient is 3◦C per 100 m. This temperature increase is not distributed equally over the world, especially where continental plates drift together or volcanic activities occure, much higher temperatures in shallow depths can be found, as in Larderello (Italy) for example, with temperatures between 150◦C to 270◦C in about 1000 m depth [Razzano, Cei, 2015].
Due to the great temperature difference between the earth’s core and the surface there is a continuous power output from the earth. This terrestrial heat flow is approximately 0.065 W/m2 and leads in the long term to a cooling of the earth. But from the heat flow measured at the surface only around 30%are coming from the earth’s core. Over 70% of it are “generated” within the earth’s crust. The high percentage of the earth’s crust heat production is a result of radioactive decay of the natural isotopes uranium [238U,235U], thorium [232Th] and potassium [40K]. The heat generated in the earth’s interior is estimated at 27.5·1012W, whereas about 44.2·1012W is radiated from the surface [Bauer et al., 2014, sect. 1.2]. That the net heat loss, as estimated by [Clauser, 2009], is only 1.4·1012W and the earth therefore does not cool down quickly, is mainly attributed to the absorption of solar radiation. Calculations have shown that the temperature in the core within the last three billion years is only decreased by 300◦C to 350◦C, therefore the geothermal energy can be regarded as inexhaustible.
2.1.2 Status of geothermal energy around the world
In 2015 the worldwide energy production from geothermal resources used to be 251 TWh. Of this, 176 TWh were heat utillizations, the remainder was electricity. Compared to the world total primary energy supply (TPES) this share is tiny. There, wind-, solar-, tide- and geothermal-energy combined make up only 1.5%of the TPES of 158,714 TWh [IEA, 2017]. Table 2.1lists the top five countries for direct-usage and electricity production out of geother-mal energy. Whereas geothergeother-mal energy is used for heating purposes in roughly 80 countries, less than 30 countries worldwide use this resource to generate electricity. Reasons for the discrepancy may be on the one hand the fact that high enthalpy reservoirs, preferred for electricity production, only occur in a few areas, and on the other hand the high investment costs associated with the exploration and exploitation of conventional geothermal resources. The first traditional applications of geothermal energy were direct utilizations in order to heat public baths or laundry purposes and can be dated back to the time of the Roman Empire. Nowadays the application possibilities of direct-use are manifold and can be found in various industries. Those might be agriculture applications (greenhouse heating), aquaculture appli-cations (fish ponds), industrial processes (lumber drying) and heating or cooling appliappli-cations for buildings with ground-source heat pumps (GHP) [CanGEA, 2014].
via steam turbines. When the water leaves a geothermal power plant, it is typically still hot enough for the most direct-use applications. Such a combined-heat-and-power (CHP) application is characterized by a large temperature spread and thus a high efficiency. A so called geothermal cascade, where thermal water is used serveral times and users are sequentially likend according to their decreasing heat demand, could include for example a power plant, a district heating network and greenhouses [Bauer et al., 2017, sect. 5.3]. In addition to the wide range of possible uses, geothermal energy is also characterized by high capacity factors (mostly above 90%). In this way, geothermal power plants could make an important contribution to the base load supply and at the same time they do not suffer from the disadvantages of conventional coal- or nuclear power plants, such as high CO2emissions or radioactive waste [Younger, 2015, p. XII].
Table 2.1: Top countries of geothermal direct-usage 2015 and electricity production 2015 / 2016. [Bertani, 2015], [IEA, 2018], [Lund, Boyd, 2015]
Direct-usage Electricity production
Country Capacity [MWth]
Production [TWh]
Country Capacity [MWe]
Production [TWh]
China 17,870 48.43 USA 3,800 17.41
USA 17,416 21.07 Philippines 1,870 9.64
Sweden 5,600 14.42 Indonesia 1,340 9.60
Turkey 2,937 12.74 New Zealand 1,068 7.64
Germany 2,848 5.42 Mexico 982.3 5.93
2.1.3 Geothermal situation in Argentina
2 Fundamentals of geothermal energy
From the map in figure2.3 there can be pointed out three main areas of geothermal projects in Argentina:
• The Andes range with volvanic systems in the west,
• El Salado basin in the province of Buenos Aires and
• Chacoparanense basin including the provinces Santiago del Estero, Chaco, Formosa, Santa Fe, Entre Ríos, Corrientes and Missiones, as well as parts of Paraguay, Uruguay and Brazil.
Figure 2.3: Distribution of geothermal projects in Argentina:
The high-enthalpy projects are within the Andes range, with exception of Termas de Río Hondo, at the border between Santiago del Estero and Tucumán, where a strong heat anomaly is found with a geothermal gradient between 3.5 to 4 times above average.
Almost all projects in the Chacoparanense and El Salado basins provide low-enthalpy sources. Most of them are still in the development stage but the already drilled wells (Talpalqué, Dolores, Curuzú Cuatiá and Monte Casero) show temperatures between 31◦C to 42◦C, depths between 441 m to 1060 m and flow rates of 25 l/s to 95 l/s respectively [Pesce, 2015].
In 2017 the National Ministry of Energy and Mining (MINEM) of Argentina expressed interest in the development of geothermal energy projects. Sebastián Kind, undersecretary of the MIMEM highlighted the geothermal potential and also the Argentine Geothermal Chamber (CGA) was formed in order to boost the sector.
The electric-geothermal potential of Argentina is subject to some uncertainties, but the values given in different sources are within the same order. According to Giorgio Stangalino, president of the CGA, the nationwide potential is up to 1500 MWe [Gubinelli, 2017], which fits into the range of 490 MWe to 2010 MWe given in [Bona, Coviello, 2016]. However it should be mentioned that the upper limit is estimated under the subject of only applying state of the art technology. Whereas [Chiodini et al., 2014] estimate, in the volcanic area of Domuyo (Province Neuquén) alone is a thermal energy release of around 1100 MWth, which would make it a very important geothermal field in the world, comparable to Mutnovsky (Russia) and Wairakei (New Zealand).
The provinces in which there are geothermal projects in different stages of study are: Cata-marca, Jujuy, La Rioja, Mendoza, Neuquén, Salta, San Juan and Tucumán. Of these, four have geothermal projects which are already in the stage of feasability studies with the following results [Gubinelli, 2017]:
• Province Jujuy, vulcano Tuzgle, estimated capacity 20 to 30 MWe. • Province Neuquén, vulcano Copahue, confirmed capacity 30 MWe.
• Province Salta, geothermal project Falla Tocomar, estimated capacity 20 to 30 MWe.
• Province San Juan, geothermal project Los Despoblados, estimated capacity 15 to 20 MWe.
2 Fundamentals of geothermal energy
Geothermal One in 2013 [Pesce, 2015].
With the change of government in 2015, the new president Mauricio Macri introduced ambi-tious targets and plans a 20% share of renewable energies by 2025. Those targets come along with the new Ministry of Energy and Mining as well as the renewable energy plan RenovAr, both established in 2016 [Heinonen et al., 2016, p. 51]. Although the first rounds of the RenovAr program focus on energies such as wind, solar and biogas there is hope that it will also attract investment for geothermal projects. This could be the step from the current status to the development of geothermal energy in Argentina.
2.2 Concepts of geothermal usage
For areas without special geothermal conditions it is necessary to drill deep wells as the temperature increases with depth. In Germany for example most wells for geothermal power plants are between 3000 m to 5000 m. In contrast to this deep geothermal energy, there are near-surface systems such as geothermal probes or groundwater wells with depths mostly less than 100 m [Stober, Bucher, 2014, sect. 4].
The different depths make a subdivision useful whereby the transition from shallow to deep geothermal energy is smooth and usally in the range of 150 m to 400 m and 20◦C to 25◦C. These low temperatures normally require a level increase (for example by heat-pumps) to make the energy usable, whereas with deep geothermal systems the energy can be used directly. However, for the considered situation in Rosario de la Frontera, near-surface systems are not relevant and therefore will not be discussed further in the following.
2.2.1 Hydrothermal resources
As one type of deep geothermal energy, hydrothermal resources characterize natural aquifers. Furthermore, these aquifers can be divided into those with high and those with low enthalpy. High enthalpy systems allow the use of Flash or Dry-Steam processes, whereas low enthalpy systems require an additional cycle such as the Organic Rankine Cycle (ORC) or the Kalina process (see section3.2for a more detailled description).
[Younger, 2015, p. XIV] gives a proposal for the catigorization of geothermal resources according to their pressure, temperature and enthalpy, as shown in figure2.4. The enthalpy is a property of a thermodynamic system and is equal to the internal energy of the system plus the product of its pressure and volume. It is defined as:
whereH is the enthalpy,U the internal energy,p the pressure andV the volume of the system. As state variable the enthalpy is a basic for efficiency calculations of steam processes (see equation3.4).
Figure 2.4: Categorization of geothermal resources. The number on the lines are approximate values of enthalpy in kJ/kg [Younger, 2015]
Not only temperature and pressure of an aquifer determine its economic efficiency, but also its transmissivity. This is a measure of an aquifer’s ability to transport fluids and is expressed in m2/s [Feldrappe et al., 2008, p. 9]. Since the required pumping power increases with a low transmissivity, this must be taken into account when considering the efficiency of the system. Furthermore a sustainable water management also demands reinjection into the same aquifer, which also needs pumping capacity. In this context, additional stimulation of the reservoir to increase permeability may be useful.
2.2.2 Petrothermal resources
2 Fundamentals of geothermal energy
natural circulation of the aquifer, petrothermal systems usually are dominated by a conductive heat transfer through the rock. Whereby when water is pumped through the hot rock, it acts as a natural heat exchanger [Bauer et al., 2014, sect. 6.1].
First used in Frenton Hill (New Mexico, USA) in the 1970s, the exploration of petrothermal systems used to be called Hot-Dry-Rock (HDR). Nowadays the term Enhanced or Engineered Geothermal System (EGS) is more common because it has been shown that dry-rocks in the actual sense do not exist, but instead all cracks are filled to a certain degree with fluids [Stober, Bucher, 2014, sect. 9].
2.2.3 Stimulation options
Stimulation, optional for hydrothermal resources to increase the permeability, is indispensable for petrothermal use. Thereby three different types of stimulation can be distinguished, namely hydraulic shearing, chemical stimulation and proppant fracturing [Bauer et al., 2014, sect. 6.3].
Hydaulic shearing
Hydraulic shearing (sometimes known as pure shear stimulation) [Sutra et al., 2017] is by far the most used stimulation method in Central Europe. Hereby water without additives is pumped into the ground under high pressure, which induces fault movements along fracture surfaces. Therefore the water pressure must be above the rock pressure (For example: Soultz-sous-Forêts (France) well head pressure: 180 bar; Harris (USA) well head pressure: 538 bar [NREL, 2011]) in order to create a stress field. If the water pressure is subsequently reduced, the fracture width will also reduce, but the surfaces no longer “fit” together as a result of the previous displacement movement, resulting in cavities which improves the permeability of existing fissure systems. This effect is called self-propping [Stober, Bucher, 2014, sect. 9.3].
The effectiveness of the hydraulic shearing is particularly dependent on the angle of the fissures in relation to the main stress direction. In addition, minor seismic activity is an elementary component of this stimulation method due to the necessary tectonic stress [Xie et al., 2014].
Chemical stimulation
results within the reservoir. Depending on the geological conditions and other environmental aspects, various chemicals can be used, whereas the most common are [Bauer et al., 2014, sect. 6.4.2]:
• Hydrochloric acid[HCl], a corrosive solution with irritant effect and particularly suitable for limestone, as these react with each other:
2HCl + CaCO3 → CO2 + CaCl2 + H2O
The reaction products are harmless to health with the exception of calcium chloride [CaCl2], which further reacts by contact with water to antarcitite [CaCl2·6H2O], a natural hexahydrate. As the dissolving reaction does not occur, this option has no effect on other rocks such as granite or sandstone.
• Organic Clay Acid (OCA) can be an alternative if the rock does not react to a single acid, for example [HCl]. It is a mixture of different acids whose exact composition depends on the rock and the temperature. However, the central component is usually hydrogen fluoride [HF], which is toxic and water contaminating. OCA is often used for rocks containing clay, as this is stabilised and undesirable reactions with other substances are thus avoided.
• Regular Mud Acid(RMA) is a compound of hydrochloric acid and hydrogen fluoride. Ammonium bifluoride [N H4HF] is necessary for its formation and it is well suited for dissolving silicate material. However, contact with calcium chloride should be avoided, as otherwise insoluble calcium fluoride [CaF2] is formed which closes the pore spaces. In general, RMA should not be used for rocks with a lime content of more than 20%. As with OCA, contact with near-surface groundwater should be avoided, as otherwise harmful environmental effects may occur.
• Nitrilotriacetic acid (NTA) is a poorly water-soluble solid, usually in the form of a white, crystalline powder. It is used as a chelating agent and is 95%biodegradable. In combination with ions of calcium [Ca2+], potassium [K+] or magnesium [Mд2+] it forms stable water-soluble complexes and thus helps to dissolve these minerals more easily from the rock. However, it is classified as a water hazard and is carcinogenic in high doses.
Proppant or hydraulic fracturing
2 Fundamentals of geothermal energy
of the rock are dissolved. Characteristic for this method is the final rinsing process, in which an attempt is made to bring all fluid back to the surface as a so known flowback. With the exception of the proppants (mostly quartz- / bauxite sand or aluminium oxide) and other thickening agents as these are intended to hold the fractures open after the hydraulic pressure is removed from the well [Sutra et al., 2017]. However, this method is often regarded as unsuitable for geothermal applications due to different reasons. On the one side are technical problems like proppant dissolution [Childers et al., 2017] or the concern that the large flow of water could leach out the proppants [Bauer et al., 2014, sect. 6.4.3]. On the other side is a considerable cost factor, as larger cracks would require larger amounts of proppants.
Differentiation to fracking
Although stimulation for geothermal applications originates in the hydrocarbon industry, there are some differences to the fracking methods used there, especially regarding the field of chemical stimulation and hydraulic shearing [Bauer et al., 2014, sect. 6.5.3], [Sutra et al., 2017].
• Fracking of unconventional reservoirs usually targets reservoir depths between 1000 and 2000 m and is intended to create a large number of new cracks and pathways there. The rock is mostly characterized by claystone or slate with a high content of organic ingredients.
The Frac Fluid consists mostly of gel fracs and proppants and occasionally biocides. In addition, the process creates a flow back, which means a return flow of this fluid to the surface, which must be specially disposed due to the chemicals it contains.
3 Exploitation technology
3.1 Drilling technology
Drilling platforms for geothermal drilling have their origin mainly in the oil and gas industry. However, the mostly higher temperatures, more aggressive components in the thermal water and a required service life of the well of usually more than 30 years, pose special challenges for the used technologies and materials. For these reasons and due to the larger diameters needed by higher volume flows, the drilling costs are usually higher. Another point is the fact that drilling for geothermal plants mostly takes place in the vicinity of residential areas and thus places high demands on emission values (air / noise) and groundwater protection [Stober, Bucher, 2014, sect. 11].
Figure3.1shows a schematic representation of a typical drilling rig with rotary drive. Thereby the drill pipe is driven from the rotary table via a driving rod (the so calledKelly). Besides this method, there can be a top drive, where the drive unit is located between the hook and drill pipe, as well as turbine drilling, whereby not the entire drill pipe is driven, but the bit is connected to a turbine which is directly located behind the bit and itself driven via the downwardly pressed drilling mud (Moineau principle) [Stober, Bucher, 2014, sect. 11]. The drilling head can be either a roller cone bit or a diamond bit (to obtain drill cores) but also special directional drill bits are usually used, always dependent on the task to be performed. The necessary contact force on the rock comes from the dead weight of the drill pipe itself, at least from its lower part, and is regulated via the hook. This means that only the lowest meters of the drill pipe are subjected to pressure and the rest to tension. Directly behind the bitdrill collars with larger wall thicknesses are used to prevent the rod from buckling in the pressure loaded area [Reich, 2015, sect. 7.3]. Finally there are some important parameters for the rotary procedure such as [Bauer et al., 2014, sect. 8.3]:
• Maximum hook load, limits the maximum depth as the drill pipe gets heavier, normally in the order of 150 - 350 t (with exceptions in the size range of 750 t [ITAG, 2013]).
• Rotations per minute, mostly between 50 - 200 rpm.
3 Exploitation technology
• Hydraulic and mechanical performance, the former being significantly higher (factor 20 - 30).
• The rate of penetration, meaning the feed speed of the drill pipe, which is determined by the speed, the contact pressure, the underground situation and further parameters.
Figure 3.1: Scheme of a typical drilling rig [DiPippo, 2015]
The required initial diameter is determined by the number of phases and the final diameter. The latter, in turn, is calculated by the desired volume flow and the associated pressure losses. If there is stable rock in the last section, piping can be dispensed, which is called open hole, otherwise aclosed holeis needed [Bauer et al., 2014, sect. 8.8.12].
Figure 3.2: Scheme of a well completion with three phases [DiPippo, 2015]
3 Exploitation technology
a new direction.
Regardless of whether it is a directional bore or a purely vertical bore, it must always be ensured that the current bore path still matches with the planned one or if the rock type is as expected. Therefore a number of measuring methods and instruments are used but in general, a distinction can be made between the measurement while drilling (MWD) systems and the logging while drilling (LWD) systems.
MWD systems are used to determine the position using built-in compasses and position sensors. LWD sensors, on the other hand, make it possible to make statements about the type of rock and its porosity with the aid of conductivity measurements, gamma and/or neutron beams [Reich, 2015, sect. 12.1, 12.2].
3.2 Geothermal power plants
In conventional power plants water is used as working fluid and heated up till 600◦C into dry steam, and also high-enthalpy geothermal resources, which provide temperatures above 200◦C or 250◦C, use the steam of water directly for driving the turbines. These cycles, which use water as working fluid, are known as Clausius-Rankine Cycle.
In a dry-steam geothermal power plant saturated or slightly superheated steam with temper-atures of 200◦C or more is used directly from the reservoir to drive the turbines. However, such favourable conditions like in Larderello (Italy) or The Geysers (USA) are very rare and those systems make up only a fraction of the global geothermal supply. Much more frequently, so called flash systems can be found in which a two phase mixture is present under high temperature. At the surface, the steam content is regulated by a pressure drop and separated from the remaining water by a separator. The steam fraction is then fed into the turbine and, after condensation, together with the previously separated water, led back into the reservoir [Bauer et al., 2014, sect. 22.1].
3.2.1 Thermodynamic cycle
A thermodynamic cycle describes a linked sequence of thermodynamic processes which contain a transfer of heat and work in and out of a system, so that start and end state of the system are identical. Therefore such a cycle can be described as follows [Vetter, 2011, sect. 2.2.1]:
I
du =I dw +
I
dq= 0 (3.1)
For a heat engine, such as a thermal power plant, that means the supplied energydqin form of heat is transformed to mechanical energydw and the internal energydu remains constant. In a closed system the sum of anergy and exergy remains constant. Exergy describes the part of energy of a system that can be transformed into work, while anergy is the energy a system contains while it is in equilibrium with its surrounding. To close the thermodynamic cycle, the anergy, as the part of the heat which can not be transformed, must be removed from the system. Figure3.3shows the Carnot-process as example of an ideal cycle without losses.
Figure 3.3: Carnot-process in the T,s - diagram [Vetter, 2011]
HereT describes the Temperature in [K], wheres stands for the specific entropy in [kJ/kgK], and the four changes of state during the process are:
• 1 →2: Isothermal expansion, supply of heat.
• 2 →3: Isentropic expansion, discharge of work.
• 3 →4: Isothermal compression, discharge of heat.
3 Exploitation technology
The surrounded surface in the T,s - diagram describes the difference between the supplied and discharged specific heatq. From that the thermal efficiency can be calculated:
Tmax∆s =qsup
Tmin∆s =qdis
ηt = qsup
− |qdis|
qsup (3.2)
Due to the heat exchange at constant temperature, the efficiency of the Carnot ideal cycle only depends on the ratio between low and high heat source temperatures. This is the theoretical upper limit of any cyclical thermal machine and it cannot be reached in practice. Its efficiency is expressed as:
ηc = 1− |qqdis|
sup = 1−
Tmin
Tmax (3.3)
3.2.2 Organic Rankine Cycle
Selection of a working fluid within an organic rankine cycle depends on its thermo-physical properties as well as the temperature of the thermal water. Therefore the working fluid should meet some criteria such as a critical point suitable for the temperature range of the thermal water, low specific volume, high thermal conductivity as well as non toxic or flamable. Furthermore, regarding environmental issues, it should have a low global warming potential (GWP) and a low ozone depletion potential (ODP) [Nusiaputra, 2017, sect. 2.1].
Depending on the fluids pressure while vaporized, the process is either subcritical (below the critical point, fluid passes through the two phase region) or supercritical.
used to preheat the fluid.
The left image of figure 3.4 gives a simple system layout of an ORC power plant. In the T,s - diagram on the right are displayed the two phase areas of the non-retrograde fluid Dimethylether with a supercritical process as well as the retrograde fluid Butane with a subcritical process. Thereby the state changes by passing the individual components are as follows [Vetter, 2014, sect. 2.1.1]:
• 1 →2: Isentropic compression, supply of work by the feed pump.
• 2 →3: Isobaric supply of heat, within the heat exchanger.
• 3 →4: Isentropic expansion, discharge of work in the turbine.
• 4 →1: Isobaric discharge of heat, through the condenser.
Figure 3.4: System layout of an ORC plant (left) and T,s - diagram of Butane and Dimethylether (right)
The specific enthalpies of the individual states can be determined from steam tables or via approximate equations. The specific energy content of the respective components is obtained via enthalpy differences [Zahoransky, 2015, sect. 4.1.1]:
• Feed pump: wpump = ∆hpump =h2 −h1
• Heat exchanger: qsup = ∆hhx =h3 −h2
• Turbine: wturb = ∆hturb =h3 −h4
3 Exploitation technology
As with equation 3.2, the thermal efficiency can be calculated accordingly:
ηt =
|qsup| − |qdis|
|qsup| =
(h3 −h2) − (h4 −h1)
h3 −h2
(3.4)
3.2.3 Kalina Cycle
While the organic rankine cycle operates with an organic fluid, the russian scientist Alexander Kalina suggested in the 1970s to use a binary mixture. A binary fluid does not evaporate isothermally, but increases its temperature during the evaporation process because the composition of the mixture changes [Zahoransky, 2015, sect. 15.5.2]. This results in lower temperature differences between working fluid and thermal water, allowing to extract more heat from the latter. The same applies to condensation, which is also not isothermal as shown in figure3.5.
Figure 3.5: Comparison between ORC and Kalina process [Zahoransky, 2015]
• Lower temperature differences in the heat exchanger and the condenser which leads to higher efficiency.
• Better cooling with lower minimum temperatures leads to a higher specific work.
• The thermal water can further be cooled down and therefore the supplied heat can be used more efficiently which also results in higher work.
Contrary to these advantages however, it must be noted that ammonia has a strong basic effect in both phases. It can burn the skin and respiratory tract and is considered a powerful metabolic poison. In addition, it forms an explosive mixture in air. Therefore, maintenance and operation of Kalina plants are complex in terms of safety. Currently, only a few Kalina plants are in operation, mainly as pilot or test plants with low capacity. Although the ammonia water mixture is well investigated, the composition of the binary fluid represents a further optimization parameter.
Finally, it should be mentioned that an optimized multi-pressure ORC, which means a pro-cess operating with several evaporation pressures, could achieve similarly good efficiencies. However, this increases the technical expenditure and thus the investment costs.
3.3 Optional heat sources
As already mentioned, the number of geothermal resources with high enthalpy and thus with high temperatures is very limited. As the thermodynamic efficiency increases with higher temperatures, the idea of supporting low temperature geothermal reservoirs with external heat sources suggests itself. There are basically two possibilities to operate such a hybrid power plant [Sanner, 2005]:
• A geothermally operated ORC process with superheating from an external heat source,
• A power plant operated with another heat source and a preheating of the working fluid by geothermal energy.
In this chapter shall be given two examples of how these options could look like with other renewable energies, which also could be of interest for the plant in Rosario de la Frontera.
3.3.1 Solar energy
3 Exploitation technology
through, which focus the sunlight with a parabolic mirror on a focal line. There, a tube is positioned which contains a heat transfer fluid and can reach temperatures between 150◦C and 400◦C, depending on the concentration factor. Serveral studies propose the hybrid solar-geothermal use for almost all kind of geothermal cycles such as single flash, double flash and binary plants [Bonyadi et al., 2017], [Cardemil et al., 2016], [Ghasemi et al., 2014], [Sanner, 2005].
In [Ghasemi et al., 2014], they develop a model to expand an existing ORC geothermal power plant with a parabolic through. The solar system provides 17.6 MW of thermal energy at nominal conditions (direct nomal insolation = 1000 W/m2, ambient temperature = 15◦C, maximum fluid temperature = 182◦C).
Solar and geothermal energy are operating parallel, the working fluid is split into two streams, one heated by the thermal water and the other by the heat transfer fluid of the parabolic through. For this constellation they come to the result of an 5.5% boost of annual power generation.
Another option given by [Bonyadi et al., 2017], is to extend an existing ORC geothermal power plant with a topping steam cycle. Here the solar field is designed to reach temperatures of the heat transfer fluid of 395◦C, driving a standard Clausius Rankine cycle where the steam leaves the turbine at 170◦C. A coupling system links the ORC with the Clausius Rankine cycle. The cooled down thermal water after the heat exchanger of the ORC is used to cool down the steam of the Clausius Rankine cycle in the condenser and is then turned back to the heat exchanger of the ORC.
For a designed ORC with a geothermal brine flow rate of 100 kg/s and a solar field that can provide 50 kg/s at design conditions, he concludes an annual power output increase by 12.72%.
3.3.2 Biomass
Biomass is defined as substances of organic origin. These can be naturally growing or cultivated plants as well as animal or domestic waste. Biomass can be used in a wide variety of ways. Heat can be obtained from the direct combustion of wood, fuel such as bioethanol or biodiesel can be produced from crops and drive cars, or electricity can be generated from biogas, produced by the fermentation of biomass under the exclusion of oxygen. Alternatively, after the biogas has been processed, it can also be fed into existing natural gas networks [Quaschning, 2015, sect. 9.1].
steam turbine, the power output increase determined by [Bonyadi et al., 2017] could thereby be surpassed.
A second possibility would be to use biomass or biogas to fire a superheater in order to increase the operating temperture of the working fluid within the ORC. This option was investigaded by [Nakao et al., 2015] and showed an increase in power output of 889 kW and an increase in thermal efficiency of 2%for a 3 MW geothermal power plant.
Alternatively the operation of a combined heat and power plant with biogas, parallel to a geothermal power plant could provide electricity and heat. If the resulting waste heat is used locally, the overall efficiency in relation to the used primary energy can increase sharply. However, this requires a well-developed district heating network.
Finally, biogas could also be fed into the local gas grid and thus be used for cooking and heating purposes inside the houses, while electricity is provided by the geothermal power plant.
3.4 Examples of low- to medium-enthalpy geothermal power plants
3.4.1 Low-enthalpy ORC in Chena
Chena is a city in a rural area of Alaska which supplied the most of its electricity from diesel generator sets, spending 365,000 US$ alone on fuel in 2005.Therefore it was decided to install a geothermal power plant based on an organic rankine cycle with 210 kW net output and R134a as working fluid [Aneke et al., 2011].
The bore well provides thermal water from 300 m depth with a temperature of 73◦C and a mass flow rate of 33 kg/s. The preheater and evaporater heat up the working fluid to 64◦C at a pressure of 16.9 bar, which then enters the turbine with a flow rate of 12 kg/s. At the turbine outlet, the steam has a temperature of 16.5◦C at 4.4 bar which is cooled down to 11.6◦C by the condenser, using 101 kg/s of cooling water with a temperature between 4.4◦C at the inlet and 9.9◦C at the outlet.
With this small-scale geothermal power project it was able to reduce electricity costs from 30 US cents/kWh to 5 US cents/kWh, also thanks to the provision of various direct use appli-cations, through which electricity generation costs could be further reduced.
3.4.2 Medium-enthalpy ORC in Fang, Chiang Mai
3 Exploitation technology
extract the geothermal energy to produce electricity. The first geothermal power plant was completed on December 1989, using a binary cycle. It is located at the Fang geothermal field in the Chiang Mai province of northern Thailand and generates 300 kW of electricity. The thermal water inlet temperature to the heat exchanger varies nowadays between 115◦C and 120◦C. The released water with an outlet temperature of around 80◦C is further used for a drying house in order to dry chili, tabacco, tea, and so on [Raksaskulwong, 2015].
The shallow well with only 100 m depth provides a flow rate of 22 l/s at originally 125◦C and drives the power plant. Other two wells were drilled up to 500 m at the same temperatures but with lower flow rates of 8 l/s respectively. Although the results were promising, the plan to expand the power plant was halted due to the lack of detailed information on the geothermal field [Amatyakul et al., 2016].
3.4.3 Kalina cycle in Húsavík
The geothermal power plant in Húsavík, in the north of Iceland, was first commissioned 2000. It is the first geothermal power plant operating with the Kalina cycle worldwide and generates more than 1.6 MW of electricity. The wells with depths between 400 m and 1000 m provide thermal water with a flow rate of 90 kg/s, a typical temperature of 121◦C and are located 20 km south of the town of Húsavík. The power plant supplies around 80%of the electricity demand of the town with a population of 2500.
Additionally to the production of electricity, the local district heating system is fed by the still 80◦C hot thermal water after the heat exchanger. Other direct uses are greenhouse and swimming pool heating, as well as snow melting. The cooling water for the Kalina cycle comes from mountains and enters the condencer with 5◦C. Within the condenser it is heated up to 25◦C and then pumped to a trout fish farm.
The working fluid is an 82% ammonia-water mixture at 5.4 bar. It is preheated in two recuperators to 68◦C before entering the evaporator. There it is heated up to 118◦C and is vaporized to a quality of 75%vapor. The remaining water is seperated and the steam led to the turbine, which the steam exits at 60◦C [Mlcak, Mirolli, 2002].
4 Analysis of the geothermal field at Rosario de la Frontera
Rosario de La Frontera is a city located in the north-west of Argentina (25◦47’55.14” S -64◦58’3.54” W), in the Province of Salta. The city itself has a population of 26,174 (2010) and was founded in 1874. In this area, thermal springs for commercial purposes were first exploited by Dr. Antonio Palau and on April 1, 1880 opened the thermal complex, which makes it the oldest in South America. It is located around 6 km southeast from the city center and is used by the Hotel Termas till today [INDEC, 2010], [Invernizzi et al., 2014].
In the vivinity of Hotel Termas are 13 hot springs, with surface temperatures ranging between 24.1◦C to 90.5◦C, which are fed by two main aquifers in 150 m and 2400 m depths [Chiodi et al., 2015]. [Barcelona et al., 2012] proved the precence of hot fluids in the Rosario de La Frontera geothermal area by audiomagnetotelluric investigation and [Invernizzi et al., 2014] estimated a hydrographic network and recharge area of 51.5 to 62.9 km2 which feeds the reservoir of Pirgua Subgroup with an overall volume of 71.12 km3, considering an average thickness of the Subgroup of 700 m and a reservoir surface at depth of 101.6 km2. Thereby an effective volume of around 39 km3 is expected, in which temperatures exceed 60◦C and therefore is interesting for geothermal applications. Furthermore they calculated the stored heat within the fluid to 222 TWh, for an assumed temperature of 90◦C.
4.1 Characterization of the thermal water resource
4.1.1 Geological conditions
4 Analysis of the geothermal field at Rosario de la Frontera
The Sierra de La Candelaria anticline is north-south orientated, about 50 km long and up to 10 km wide (fig.4.2). It lays south-east of Rosario de la Frontera and is dominated by a basement involved thrust system. The anticline is uplifted by a high-angle thrust fault along its eastern limb and in its central portion extensional faults offset the stratigraphic succession from east to west. The stepped fold pattern is characteristic for this area, caused by the Andean inversion of pre-existing normal faults associated to a regional rifting event in the Jurassic-Createceous era (145 - 66 Ma) [Invernizzi et al., 2014].
Figure 4.1: Structural provinces in NW-Argentina [Maffucci et al. 2016]
• The Medina Formationis the oldest unit, this Precambrian (4600 - 541 Ma) basement crops out of the core of the anticline.
• The Salta Group which overlays the Medina Formation and predominantly consist of red beds with limestone interbeds. It was formed in a Cretaceous (145 - 66 Ma) to Paleogene (66 - 23 Ma) era and can further be subdevided into three subgroups, namely from bottom to top:
– The Pirgua Subgroup, which mainly consists of red breccias, conglomerates and sandstones and was conditioned by extentional faults during the formation of the Salta Basin.
– The Balbuena Subgroup where deposits of the Pirgua Subgroup evolve and is mainly represented by limestones and shales. It is roughly 180 m thick and was formed during the latest Cretaceous to early Paleocene era (72 - 61 Ma).
– The Santa Bárbara Subgroup, which, similiar to the Balbuena Subroup, is a post-rift event, deposited in lacustrine, shallow marine and continental environments of the Paleocene to early Eocene era (66 - 47 Ma) with a thickness of around 330 m.
• The Payogastila Group, including the Orán Group, formed in the middle Miocene (13 Ma) to Pleistocene (2.58 - 0.01 Ma) which crops out of the anticline in its northern sector and overlying the Salta Group, mostly represented by sandstones and massive quartzarenites with gypsum interlayers.
The Orán Group can further be subdevided into the Jujuy and Metán Subgroups, both formed during the Neogene era (23 - 2.58 Ma). The Metán Subgroup crops out at the northern sector of the Sierra de La Candelaria anticline and is regarded as the cap rock of the thermal aquifer, whereas the Medina Formation is considered as an impermeable basement.
4 Analysis of the geothermal field at Rosario de la Frontera
The recharge of the geothermal system is mainly due to meteoric water, which infiltrates the ground in the area where the Pirgua Subgroup crops out. From there it is moving into deep with a northward direction as shown in figure4.3. The residence time of the water within the reservoir is expected to be more than 50 years before it rises again to the surface in one of the hot springs [Invernizzi et al., 2014], [Maffucci et al., 2016].
Figure 4.3: Conceptual 3D model of the undeground fluid movement [Maffucci et al., 2016]
4.1.2 Geochemical conditions
4 Analysis of the geothermal field at Rosario de la Frontera
[OH−]- ions are balanced. This neutral point decreases with increasing temperature and the pH value also influences the solubility of many substances, which can be used to calculate whether certain minerals are saturated or not.
An overview of the locations of the 13 hot springs around Hotel Termas is shown in figure4.4
and the chemical composition as well as the temperature, pH value and the flow rate for each hot spring are listed in table 4.1. It should be mentioned, that the data available in the literature vary slighty from one another, so indicates [Invernizzi et al., 2014] a temperature range of 22.6◦C to 92.6◦C and a pH value of 6.65 to 8.43, whereas in [Chiodi et al., 2015] a range between 24.1◦C to 90.5◦C and 6.09 to 7.36 can be found, but as data from [Invernizzi et al., 2014] show, this values also vary throughout the year.
The amount of total dissolved solids in the majority of the hot springs is relatively low (TDS < 1050 mg/l) with a composition mostly of sodium [Na+] and chloride [Cl−] (alkali-chloride waters) with exeption of two sodium bicarbonate[NaHCO3] springs (RF07, RF12). The concentration of silica[SiO2] varys in a range of 47 mg/l to 124 mg/l, whereas values of bromide [Br−] and boron [B] are below 2.08 mg/l and 0.51 mg/l respectively [Chiodi et al., 2015].
From the analysis of oxygen isotopes[δ18O], which vary in a narrow range of - 7.1hto - 6.4h, can be assumed that the water of the hot springs has a meteoric origin [Invernizzi et al., 2014], and due to comparison of four probes for its tritium content with data from the international atomic energy agency (IAEA) catalogue for Salta, it could be shown that the residence time of the water within the reservoir must last for more than 50 years.
Furthermore, [Chiodi et al., 2015] comes to the conclusion, that the alkali-chloride domi-nated water comes from the shallow aquifer system, whereas the sodium bicarbonate water represents the main hydrothermal reservoir.
4 Analysis of the geothermal field at Rosario de la Frontera
4.2 Infrastructure and energy demand
Besides the city of Rosario de la Frontera, there is also the department of Rosario de la Frontera, including two municipalities, namely the city with 26,174 inhabitants and an area of 2184 km2, and furthermore El Potrero with 2,819 inhabitants and an area of 3218 km2, which means that besides the city the main part of the department is rural with agricultural production of beans, soy, vegetales and tobacco as well as the largest livestock production within the province of Salta [INDEC, 2010], [Salta, 2018].
For the construction and operation of a geothermal power plant some points must be taken into account regarding the local situation such as access to the well, infrastructure for con-struction equipment, a corresponding demand for energy and, as far as possible, further uses of the heat to increase profitability. A brief overview of these points is given below.
Access to the well
As mentioned in section 4.1.1, the most promising site for a geothermal power plant based on previous investigations, would be in the northern part of the Balboa anticline which is roughly 3 - 5 km to the southeast of Hotel Termas. The outlets of the anticline are thereby hilly and wooded, with no major forest roads leading into the area. But the surrounding is marked by flat fields, which can be reached via the nearby Route 34. Here there would be sufficient space for the drilling work if the exact development of the reservoir is carried out using directional drilling methods.
Infrastructure
The city of Rosario de la Frontera is located at the junction of routes 9 and 34. While route 9 comes south from San Miguel de Tucumán (distance 130 km), route 34 comes southeast from Santiago del Estero (270 km). Both head north until route 9 points west to Salta (180 km). Near this turn-off, 9 km south of the town of General Güemes, are also the two largest power plants in the province of Salta (Termoandes S.A., 643 MW and Térmica Güemes S.A., 361 MW). From there a 132 kV power line leads via Rosario de la Frontera to San Miguel de Tucumán, which is a good prerequisite for connection to the power grid [CAMMESA, 2018a], [MINEM, 2016a].
Electricity demand
This means an average electricity consumption of 1,379 kWh per capita per year [MINEM, 2016a].
Direct heat
The average minimum temperatures in the region of Salta fall below 10◦C between May to September [SMN, ], so it is likely that there is a heating demand. This could be covered by a district heating network or the heat could be offered to the local industry (to dry tobacco for example). No information about the natural gas demand in Rosario de la Frontera could be found, but the demand for the province of Salta in 2016 was 790 Mio. m3, of which around 27%
are used in the industry and 14%for residential buildings. With a total of 300,082 households in the province of Salta and 3,153 industrial companies [MINEM, 2016a], that leads to an estimated demand of natural gas of 3 Mio. m3 (≈32 GWh) for private households in Rosario de la Frontera or almost 4 Mio. m3 (≈43 GWh) for the industrial companies, considering a heating value of 9300 kcal [ENARGAS, 2016].
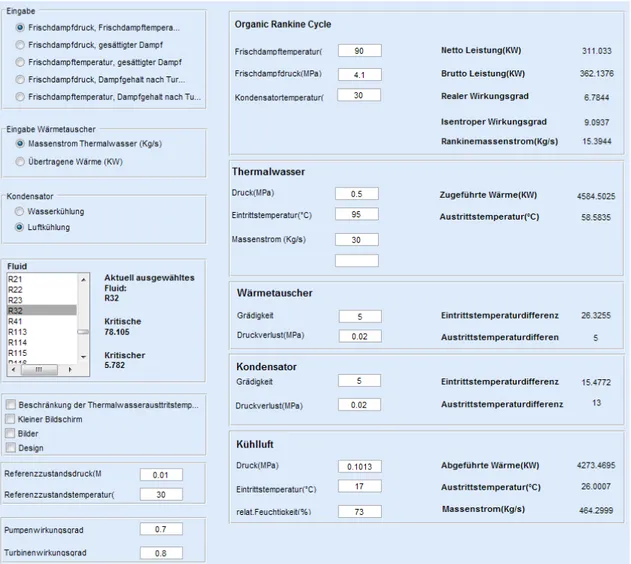
4.3 Simulation program GeSi
At the Institute of Nuclear and Energy Technology (ger.: Institut für Kern- und Energietechnik, IKET) at the Karlsruhe Institute of Technology (KIT), a simulation program was developed to calculate organic rankine cycles with thermal water as heat source. This geothermal simulation (GeSi) program is based on a Matlab®code and uses the REFPROP fluid data provided by the National Institute of Standards and Technology (NIST) [Vetter, 2014, sect. 3.1].
It comes with a graphical user interface (GUI) where serveral modules can be selected, as example full load or partial load, with or without recuperator, course of performance or colormaps to identify optimal process parameters, which will be briefly explained within this section.
Module: Organic Rankine Cycle
This module calculates a simple ORC layout at design conditions without a recuperator and sub- or supercritical processes can be computed. First a working fluid is selected from the REFPROP fluid list and as a second step, boundary conditions as well as process parameters are specified. There are several options for defining the steam condition, such as:
• Turbine inlet temperature and pressure
4 Analysis of the geothermal field at Rosario de la Frontera
• Turbine inlet temperature and saturated steam
• Turbine inlet pressure and turbine outlet steam content
• Turbine inlet temperature and turbine outlet steam content
Several input options can also be selected for the thermal water cycle. By default the definition of the thermal water temperature, pressure and flow rate into the heat exchanger is selected but can be switched to amount of heat transfered into the ORC or minimum permissible thermal water temperature after the heat exchanger.
For the cooling site can be selected between air or water cooling, with its temperature and relative air humidity or flow rate respectively.
In addition for the heat exchanger as well as the condenser must be given their minimal temperature difference (gradity) and pressure loss in order to calculate the unknown inlet or outlet temperatures. Finally information about the pump and turbine efficieny is required to calculate the power output and the systems real efficiency.
Module: ORC with recuperator
Hereby the layout of the ORC is extended by an internal heat exchanger (recuperator) and the input options differ in a few points from the previous module. The last two options to define the steam condition by its steam content at the turbine outlet are not available, because expanding into the two phase area would not allow an internal heat transfer due to similar temperatures at the outlets of the turbine and the pump.
For the recuperator, similar to the heat exchanger or the condenser, the gradity as well as the pressure loss must be specified. The calculation results are extended by the internal trans-ferred heat, temperature differences at in- and outlet side of the recuperator and furthermore the thermodynamic efficiency with and without recuperator.
Module: Course of performance
This module allows the variation of one parameter (for example the pressure) of the steam condition within a desired range, while the other parameter (for example the temperature) and all other conditions remain constant. It is possible to calculate an ORC with or without recuperator and to compare these two configurations directly. The values of the power output and the efficiency are displayed as a function of the variating parameter.
Module: Colormap
form of so called colormaps, where the values of power output, thermodynamic efficiency, transfered heat and flow rate are displayed as a funtion of the two parameters temperature and pressure. These diagrams allow an easy identification on how the different values depend on the parameters and to find the optimum operating condition.
Module: Partial load
All previous modules operate under the presumption of nominal capacity. In order to calculate the influence of changing thermal water conditions (temperature, flow rate, pressure) the modulePartial load offers in its submodules the same calculation possibilities as the previous modules (therefore with/without recuperator, course of performance, colormaps). The differ-ence in these submodules to the previous is on one side the variation of the thermal water condition instead of the steam condition and on the other side the necessity to implement the efficiency curve for the turbine and the pump as a function and not as a single value. To display the pump and turbine characteristics as accurately as possible, a function as shown in equation4.1is given as a dependency of the partial load:
η
ηnom = a0 + a1
m˙
˙ mnom
+ a2 m˙
˙ mnom
2
+ . . . + a6 m˙
˙ mnom
6
(4.1)
Wherea1 toa6 are parameters,η andm˙ are the actual efficiency and flow rate, whereasηnom andm˙nom are the efficiency and flow rate at nominal condition respectively.
4.4 Performance model for tailored solutions
In this section calculations of a power optimized ORC plant will be presented. Besides some constant assumptions for technical installations such as the heat exchanger or the condenser, variational calculations of different parameters are performed in order to see how these affect the power plant output.
These include calculations for different thermal water temperatures within the expected range, a seasonal cycle calculation where the influence of the ambient temperature to the cooling system shall be investigated and also a partial load simulation, if the flow rate or temperature of the thermal water deviate from the design point and thus the turbine and pump efficiency drop from its optimum.
![Figure 2.2: Model of convection within Earth’s mantle [OTB, ]](https://thumb-us.123doks.com/thumbv2/123dok_es/5584755.734211/20.892.195.678.767.1087/figure-model-convection-earth-s-mantle-otb.webp)
![Figure 2.4: Categorization of geothermal resources. The number on the lines are approximate values of enthalpy in kJ/kg [Younger, 2015]](https://thumb-us.123doks.com/thumbv2/123dok_es/5584755.734211/26.892.214.655.247.578/figure-categorization-geothermal-resources-number-approximate-enthalpy-younger.webp)
![Figure 3.2: Scheme of a well completion with three phases [DiPippo, 2015]](https://thumb-us.123doks.com/thumbv2/123dok_es/5584755.734211/32.892.254.616.263.654/figure-scheme-completion-phases-dipippo.webp)
![Figure 3.5: Comparison between ORC and Kalina process [Zahoransky, 2015]](https://thumb-us.123doks.com/thumbv2/123dok_es/5584755.734211/37.892.170.759.564.877/figure-comparison-orc-kalina-process-zahoransky.webp)
![Figure 4.1: Structural provinces in NW-Argentina [Maffucci et al. 2016]](https://thumb-us.123doks.com/thumbv2/123dok_es/5584755.734211/43.892.236.686.348.965/figure-structural-provinces-nw-argentina-maffucci-et-al.webp)
![Figure 4.2: Geological map of the Rosario de La Frontera area [Maffucci et al., 2015]](https://thumb-us.123doks.com/thumbv2/123dok_es/5584755.734211/45.892.92.823.122.1110/figure-geological-map-rosario-la-frontera-area-maffucci.webp)
![Figure 4.3: Conceptual 3D model of the undeground fluid movement [Maffucci et al., 2016]](https://thumb-us.123doks.com/thumbv2/123dok_es/5584755.734211/46.892.192.678.314.749/figure-conceptual-d-model-undeground-fluid-movement-maffucci.webp)
![Figure 4.4: Locations of the hot springs around Hotel Termas [Chiodi et al., 2015]](https://thumb-us.123doks.com/thumbv2/123dok_es/5584755.734211/47.892.90.828.782.1032/figure-locations-hot-springs-hotel-termas-chiodi-et.webp)
![Figure 4.5: Relationship between pumping power and transmissivity [Bauer et al., 2014]](https://thumb-us.123doks.com/thumbv2/123dok_es/5584755.734211/54.892.78.804.607.1084/figure-relationship-pumping-power-transmissivity-bauer-et-al.webp)