1
LABOR MARKET MOBILITY AND INFORMALITY: THE COLOMBIAN CASE
Kelly Yelitza Montoya Muñoz
Advisor: Hugo López Castaño
Medellin
Universidad EAFIT
School of Economics and Finance
MSc. In Economics
2
I. Introduction
Informality in the labor market is one of the main problems that developing countries face and Colombia is not exception: the proportion of informal workers in the Colombian economy is about half of the occupied population. Figure 1 shows the informality rate for Colombia between 2007 and 2016 measured according to three definitions that will be presented later in this document. The data indicates that informality declined over this ten year period; this could be due to the good performance of the economy (average annual growth rate of 4.11% during the period) and to active government policy to encourage formalization. However, the process has been too slow since the reduction of informality during the period is only about 5 points. This opens the discussion about what are the factors that affect the informality in Colombia and what policy measures can be taken to counter the problem.
Figure 1
3
One of the explanations given for the presence of informality in an economy is that workers with a high probability of being unemployed resort to the informal labor market in order to avoid it. Informality provides then a safety net to them, so they prefer low quality and poorly remunerated jobs rather than joining the unemployed population (Harris & Todaro, 1970). This case applies especially to older workers (Gonzalez de la Rocha, 1994) and unskilled workers (Selby, Murphy, & Lorenzen, 1990). Another explanation is that some people may find it hard to transit directly from unemployment and inactivity to the formal sector so they are inserted in the labor market as informal workers with the expectation of moving towards formalized jobs (Maloney, 2004), situation that applies particularly to young people who are deciding on their future labor trajectory (Balán, Browning, & Jelin, 1973).
Figure 2
4
kind), who worked at least 1 hour in the reference week in an economic company, vii) Day laborer employee: workers who are directly engaged in the production of agricultural and livestock goods, under the dependence of a single employer from which they obtain a remuneration either fixed or per unit produced.
Most of the studies on informality focus on answering questions such as how do business cycle and regulation affect the informality rate (Loayza, Oviedo, & Servén, 2005; Mortensen & Pissarides, 1999; Pries & Rogerson, 2005); how is the tradeoff between unemployment and informality (Bosh & Maloney, 2008), how big is the informal economy (Cárdenas & Mejía, 2007), what are the characteristics of the population immersed in the sector and which policy interventions should be taken to encourage employers to formalize themselves (López, Henao, & Sierra, 1981),but the dynamic of informality needs to be analyzed in more detail to identify the characteristics of those individuals that are more likely to be informal, especially in the case the self-employed which, as figure 2 shows, is the group of people that corresponds to the bulk of the informality in Colombia (around 60% of informal people are self-employed).
5 Figure 3
Note: The dark shaded area on Figure 3 represents the share of informal workers into each occupational position. About 100% of domestic and non-remunerated workers are informal, while around 20% of the private employees are informal. Government employees are not presented in the table since they should be all formal employees.
A similar case occurs with employers, domestic and non-remunerated workers, of which approximately 100% are informal. The trend is reversed in the case of private workers (21%) and government workers (0%). Taking into account the consistency of this fact, transitions towards self-employment, domestic and non-remunerated jobs will be considered as a proxy for movements towards informality.
self-6
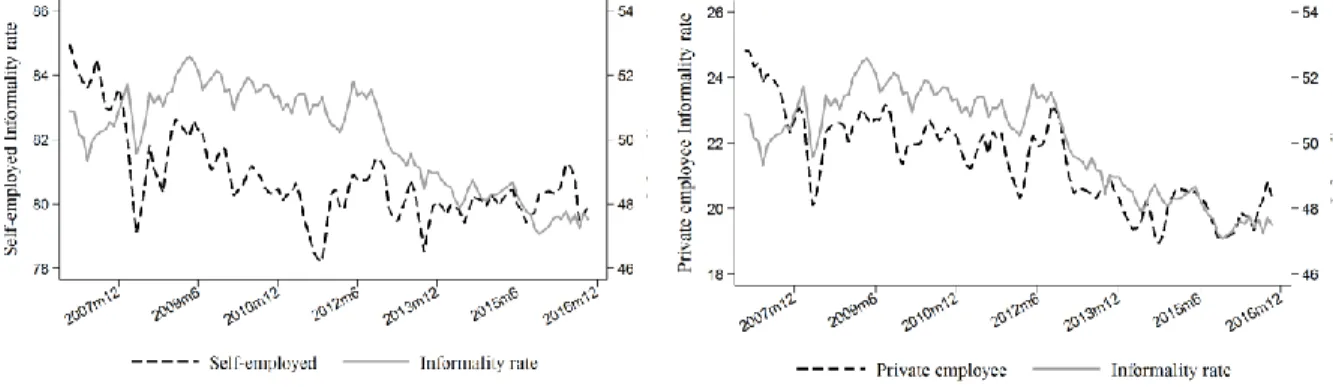
employment are not fully responsible for the change in the informality rate. On the other hand, in the case of private employees, the informality rate strongly and positively correlated with the informality rate (0.769 with a significance level of 1%) and, as the Figure 4.b shows, the movements of these two rates are very similar, which may suggest that, despite the low percentage of private employees immersed on informality, it is this occupational position the one that drives the change in the informality rate. This document then, will delve deeper into this analysis.
Figure 4.a Figure 5.b
Notes: Figures 4.a and 4.b compare the behavior of the 13 metropolitan areas informality rate vs the two leading occupations on informality dynamics. Figure 4.b indicates a strong positive relationship between the 13 areas informality rate and private sector informality rate.
Definitions
Before proceeding with the analysis; we need some definitions regarding informality and mobility in the labor market.
7
government, non-remunerated, domestic and laborer employee, and employer) which has not been done so far, as a proxy of between-jobs transitions. Finally, we will also study the effect of these types of mobility on informality rate, using the variables that according to literature affect the decision of individuals to participate in the labor market, such as gender, level of education, and rural and urban areas. Those individual characteristics finally affect not only the probability of participating actively in the labor market but also their career path and then their economic situation in old age.
For informality there are three definitions commonly used: i) Firm size: those workers who, at the reference period, were in one of the following situations: private workers and firm owners in firms with up to five employees, unpaid workers, domestic workers and the non-educated self-employed, this is the definition used by the Statistics National Department of Colombia (DANE, for its acronym in Spanish); ii) Health insurance: those workers who are not affiliated to health insurance, and iii) Pension contributions: those workers who do not contribute to the pension system. As it is showed in Figure 1, these definitions behave in a similar way and they are statistically closely related (correlation above 0.60 and significant at 1%). In addition, a special analysis will be presented for self-employment workers which, as previously mentioned, keep a close relationship with informality, particularly with the firm size definition (Figure 4.1), which will be used as the definition of informality from here on.
8
The analysis will also allow us to infer if the current dynamics actually results in better working conditions for individuals or if, on the contrary, it translates into informality and a descendent career path, especially in the case of those who are self-employed and employees of private firms. Finally, this work provides the basis for a future in-depth analysis of the Colombian pension problem.
The document is divided into 6 sections including this introduction. The second section will present a review of the most relevant literature concerning this kind of analysis. The third, describes the data used and the methodology applied to the data. The fourth section presents the current dynamics in the Colombian labor market. In the fifth section is presented the estimation of the labor trajectory for the Colombian population under the current labor market conditions, including the estimation of the informality rate given the future career path of the population. And the last section includes some conclusions and policy recommendations.
II. Theoretical framework
The following are the most representative works that have approached the study of the behavior of the main labor market indicators using labor market flows:
Elsby, Smith & Wadsworth (2010), estimate the United Kingdom labor transitions using retrospective information about the people labor activity one year before the survey combined with information about their current state, which allows them to construct the transitions for a 35 year period.
Goñi (2013), studies the Andean countries labor dynamics and they find that informality is persistently high despite of the high mobility. Moreover, the author concludes that the level of education is a highly explanatory factor for the transitions, and that the women and the young people are more likely to move towards inactivity.
9
market and that promote skills on those not participating in order to improve their productivity and therefore their employability.
In the Colombian case, this kind of analysis was first covered by Mondragon & Peña (2010) who analyze how labor market rigidities affect informality. They find that labor market rigidities are important drivers of the transition into informality, particularly for low skilled workers. However, they say that further research is needed to understand the channels through which labor market rigidities affect the transition into the formal sector, in particular for workers with high educational attainment.
Lasso (2011), analyzes Colombia’s unemployment dynamics for different types of employees using the household’s national survey 1986-2010; to do so he uses the methodology proposed by Shimer (2007) for the estimation of the labor flows between three states: employed, unemployed and inactive. The author disaggregates the employees between salaried and no salaried workers to capture the differences that may arise due to the informality problem but he does not analyze informality.
López & Lasso (2012) analyze the pension problem in Colombia for the year 2007; they estimate the labor history for the population and the probability of getting a pension. They find that young people start their career path as salaried workers but rotate quickly and face high unemployment rates; with the passing of the years they end up working steadily in informal self-employed jobs and that this is the main cause of the Colombian pension system problem.
López & Lasso (2015) study the main determinants of the differences between the transition rates by gender and they find that household’s head women are more likely to move from employment towards unemployment and inactivity in contrast with men in the same condition and level of education, and the probabilities are higher in the presence of children. They also find that the likelihood of staying unemployed increases with age and is bigger in the case of women and educated people; and that people in non-salaried and unemployment are more likely to transit towards inactivity, this probability also increases with age.
10
fluidity in labor markets increases the occupation rates for salaried and formal workers. However, as their information is limited to formal sector, their results cannot be transferred to informal sector.
III. Data and Methodology
The principal source of information for the estimations is the Colombian household survey (Gran Encuesta Integrada de Hogares, GEIH) conducted by the DANE, for the years 2008-2016. The survey contains information about labor participation and socio-demographic characteristics such as age, gender, children, marital status, level of education and income, etc. The sample used here contains individuals aged 15-65 years for whom it is possible to retrieve information about their work activity in the last 24 months. Even though the information is not available as a panel data, the survey contains retrospective questions about the employment status of the individual in one and two years before the application of the survey (questions used to recover labor information are presented in Appendix A). This feature, accompanied by the fact that is a large sample of individuals randomly selected, the size of which is preserved over time, make of the survey a rich dataset of information and a very valuable input in this kind of analysis.
The analysis of the labor market current dynamics presented in section III, is composed by a sample of 1’058.023 individuals and the measures there correspond to the average between the years 2015 and 2016. The average of the two years is selected due to the contrast in the Colombian macroeconomic dynamic during these years, the economy growth rate of the country passed from 3.1% in 2015 to 2.0% in 2016. (López, 2017)
Gross and net flows between states and positions are calculated as the percentage of people who, in the last year before the survey, moved from an state i to any other state different from i, or from position i to any other different position. The gross flow includes both, entry and exit from the state or position towards the other states or positions. That is, gross flow is a measure that accounts for the dynamics of the state/position. The net flow is the difference between the entries and the exits for each state/position; thus, this one can be seen as a measure of the direction of the state/position’s dynamics.
11
probability that an individual moves from an origin state O towards a destination state D is equal to the number of individuals that make the transition along one year, divided by the number of individuals in the origin state at the beginning of the year:
The criterion he uses to establish the movements along the states, is the same we use to determine the movements along the occupational positions, it is as follows:
- An individual moves from j to j if she has been part of the state/occupation j, either because she has stayed there or because she moved to the same state/occupation, during a period greater than 12 months before the date of the survey application.
∀ j with j = States, Occupations and States = salaried, non salaried, unemployed, inactivity; Occupations = government, private and domestic employee, self-employed1, employer, non-remunerated worker2, laborer, and unemployed
- An individual moves from i to j if she has been part of j for a period less than 12 months and had been part of i between one or two years before
the date of the survey application. ∀ with
Where
That is, the sum of all individuals that move from states/occupations i to the state/occupation j equals the number of individual in state j at time t-1. Therefore, by construction we have:
1 The position self-employed includes independent workers and other positions no covered in the presented options.
12
The calculated probabilities are smoothed using a robust nonlinear smoother with repetition until convergence and applying the Hanning linear smoother for endpoints; this smoother has the advantages of preserving the trend behavior present in the transition rates, eliminating the irregularities not associated with the trend or the cycle of the rates along time through several replications, re-smoothing and re-roughing; and not restricted to parametric forms (Velleman, 1977).
The labor trajectory is calculated using mortality tables with bootstrapping and Markov chains as described below:
In a first stage, a set of randomly selected individuals from those aged i die at age j (with i , j =15,16,…,64), and the labor market indicators are calculated
based on the new population. The number of individuals that should die is estimated according to the mortality rates available for men and women in the
Resolution 1555 of the Colombian Financial Superintendence
(Superintendencia Financiera de Colombia)3. To achieve robustness, the process has been repeated 200 times, and the probability of being selected is uniform across individuals in all iterations.
In a second stage, the Markov chains, method proposed by López et al (2012), use the individual information about the state and the probability of transition at time t to estimate the individual state at t + 1, the process continues until the individual has reached 65 years old.
Finally, the results obtained in the previous stage are used to estimate the informal rate for the next five years. It should be noted that these results assume that the current conditions of the labor market, specifically the transition probabilities, will be the same for the subsequent years. In order to give a more structural tone to this part of the analysis, the net flows among occupational positions are presented in this section to check variations across time.
IV. Overview of the current dynamics of the Colombian labor
market
In general terms, for the period 2015-2016, salaried jobs are the drivers of the labor market dynamics. The movements from and towards salaried jobs, account for 61.0% of total mobility (13% of the Economically Active
3
13
Population - EAP), for the 67.6% of male mobility, the 54.2% of women mobility, 71.0% of mobility for those with higher education, 56.8% of mobility for those without higher education and for 64.7% of urban mobility. The panorama changes for the rural population, whose main driver in the labor market dynamics are non-salaried jobs (70.8%). The most dynamics groups are salaried people with higher education and salaried men. The less dynamic group is that of unemployed individuals, especially men and those in urban areas. A more detailed analysis of flows between labor market states is presented in Table 1.
In the case of the net flows (Table 2), on the one hand, the salaried and inactive states are revealed are net expellers of labor force, a trend that is preserved across disaggregation by gender, area and education; being stronger in the case of inactive people and those salaried individuals with higher education and in urban areas. On the other hand, non-salaried and unemployment states are net receivers of labor force, being this last state the one that receives the most of the population (around 90% of the total population that moved). Again, this trend doesn’t change among the different demographic groups, but it is worth noting that the net flows of women and people in rural areas are bigger towards the non-salaried state.
14
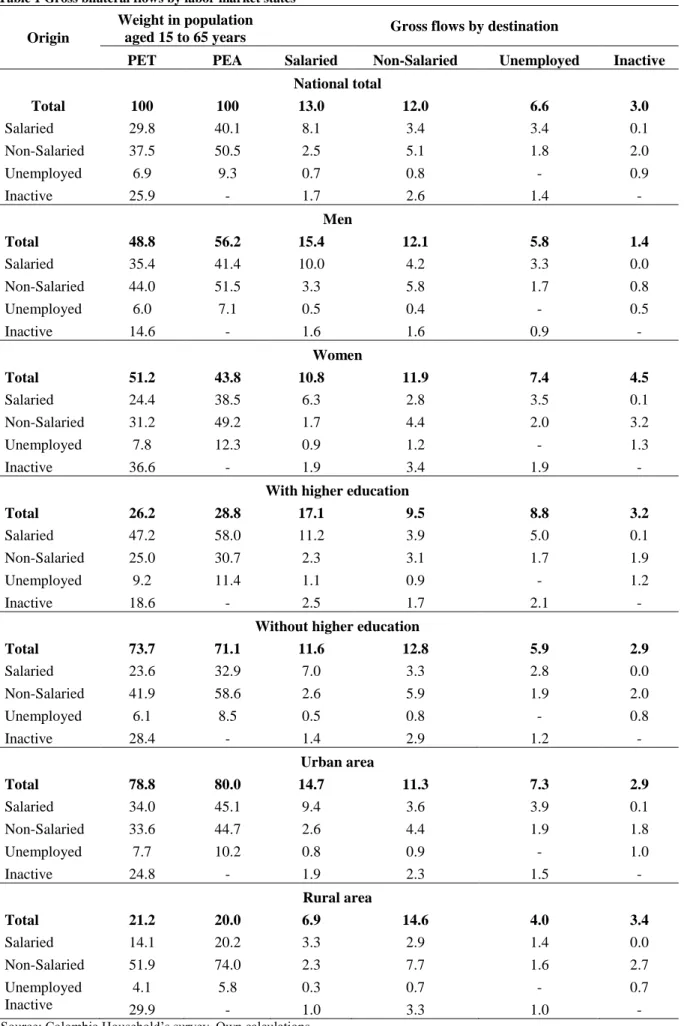
Table 1 Gross bilateral flows by labor market states
Origin
Weight in population
aged 15 to 65 years Gross flows by destination
PET PEA Salaried Non-Salaried Unemployed Inactive
National total
Total 100 100 13.0 12.0 6.6 3.0
Salaried 29.8 40.1 8.1 3.4 3.4 0.1
Non-Salaried 37.5 50.5 2.5 5.1 1.8 2.0
Unemployed 6.9 9.3 0.7 0.8 - 0.9
Inactive 25.9 - 1.7 2.6 1.4 -
Men
Total 48.8 56.2 15.4 12.1 5.8 1.4
Salaried 35.4 41.4 10.0 4.2 3.3 0.0
Non-Salaried 44.0 51.5 3.3 5.8 1.7 0.8
Unemployed 6.0 7.1 0.5 0.4 - 0.5
Inactive 14.6 - 1.6 1.6 0.9 -
Women
Total 51.2 43.8 10.8 11.9 7.4 4.5
Salaried 24.4 38.5 6.3 2.8 3.5 0.1
Non-Salaried 31.2 49.2 1.7 4.4 2.0 3.2
Unemployed 7.8 12.3 0.9 1.2 - 1.3
Inactive 36.6 - 1.9 3.4 1.9 -
With higher education
Total 26.2 28.8 17.1 9.5 8.8 3.2
Salaried 47.2 58.0 11.2 3.9 5.0 0.1
Non-Salaried 25.0 30.7 2.3 3.1 1.7 1.9
Unemployed 9.2 11.4 1.1 0.9 - 1.2
Inactive 18.6 - 2.5 1.7 2.1 -
Without higher education
Total 73.7 71.1 11.6 12.8 5.9 2.9
Salaried 23.6 32.9 7.0 3.3 2.8 0.0
Non-Salaried 41.9 58.6 2.6 5.9 1.9 2.0
Unemployed 6.1 8.5 0.5 0.8 - 0.8
Inactive 28.4 - 1.4 2.9 1.2 -
Urban area
Total 78.8 80.0 14.7 11.3 7.3 2.9
Salaried 34.0 45.1 9.4 3.6 3.9 0.1
Non-Salaried 33.6 44.7 2.6 4.4 1.9 1.8
Unemployed 7.7 10.2 0.8 0.9 - 1.0
Inactive 24.8 - 1.9 2.3 1.5 -
Rural area
Total 21.2 20.0 6.9 14.6 4.0 3.4
Salaried 14.1 20.2 3.3 2.9 1.4 0.0
Non-Salaried 51.9 74.0 2.3 7.7 1.6 2.7
Unemployed 4.1 5.8 0.3 0.7 - 0.7
Inactive 29.9 - 1.0 3.3 1.0 -
Note: The row total (bold) shows the share of the PEA that moved towards the destination state. The other rows correspond to the proportion of the PEA that moved from each origin state to each destination state.
15
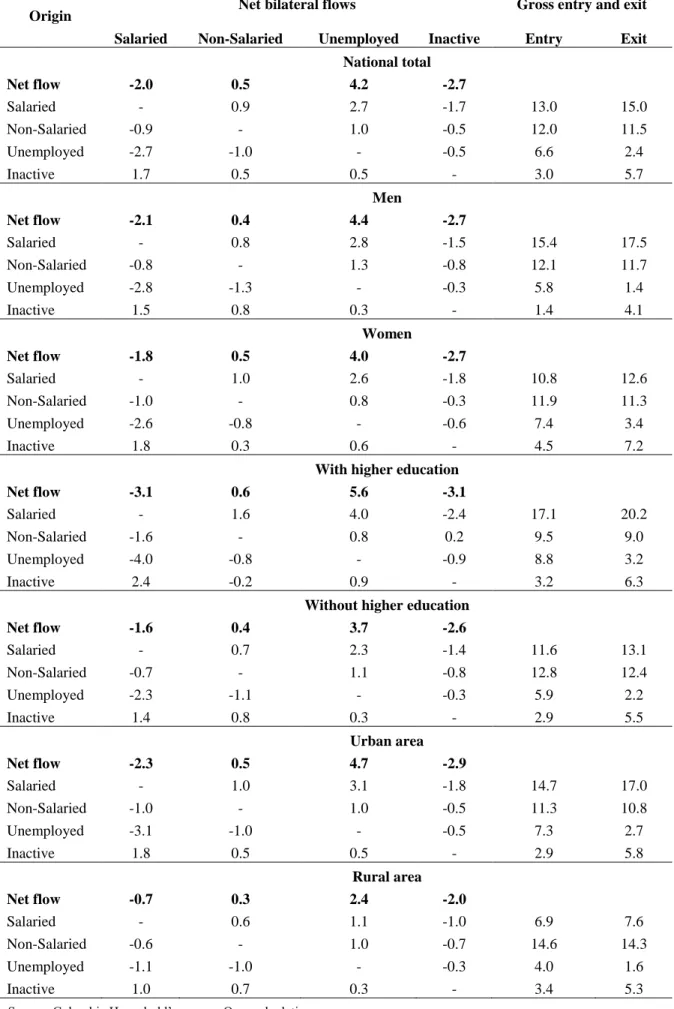
Table 2 Net bilateral flows by labor market states
Origin Net bilateral flows Gross entry and exit
Salaried Non-Salaried Unemployed Inactive Entry Exit
National total
Net flow -2.0 0.5 4.2 -2.7
Salaried - 0.9 2.7 -1.7 13.0 15.0
Non-Salaried -0.9 - 1.0 -0.5 12.0 11.5
Unemployed -2.7 -1.0 - -0.5 6.6 2.4
Inactive 1.7 0.5 0.5 - 3.0 5.7
Men
Net flow -2.1 0.4 4.4 -2.7
Salaried - 0.8 2.8 -1.5 15.4 17.5
Non-Salaried -0.8 - 1.3 -0.8 12.1 11.7
Unemployed -2.8 -1.3 - -0.3 5.8 1.4
Inactive 1.5 0.8 0.3 - 1.4 4.1
Women
Net flow -1.8 0.5 4.0 -2.7
Salaried - 1.0 2.6 -1.8 10.8 12.6
Non-Salaried -1.0 - 0.8 -0.3 11.9 11.3
Unemployed -2.6 -0.8 - -0.6 7.4 3.4
Inactive 1.8 0.3 0.6 - 4.5 7.2
With higher education
Net flow -3.1 0.6 5.6 -3.1
Salaried - 1.6 4.0 -2.4 17.1 20.2
Non-Salaried -1.6 - 0.8 0.2 9.5 9.0
Unemployed -4.0 -0.8 - -0.9 8.8 3.2
Inactive 2.4 -0.2 0.9 - 3.2 6.3
Without higher education
Net flow -1.6 0.4 3.7 -2.6
Salaried - 0.7 2.3 -1.4 11.6 13.1
Non-Salaried -0.7 - 1.1 -0.8 12.8 12.4
Unemployed -2.3 -1.1 - -0.3 5.9 2.2
Inactive 1.4 0.8 0.3 - 2.9 5.5
Urban area
Net flow -2.3 0.5 4.7 -2.9
Salaried - 1.0 3.1 -1.8 14.7 17.0
Non-Salaried -1.0 - 1.0 -0.5 11.3 10.8
Unemployed -3.1 -1.0 - -0.5 7.3 2.7
Inactive 1.8 0.5 0.5 - 2.9 5.8
Rural area
Net flow -0.7 0.3 2.4 -2.0
Salaried - 0.6 1.1 -1.0 6.9 7.6
Non-Salaried -0.6 - 1.0 -0.7 14.6 14.3
Unemployed -1.1 -1.0 - -0.3 4.0 1.6
Inactive 1.0 0.7 0.3 - 3.4 5.3
Note: The row total (bold) shows the share of the PEA that moved towards the destination state minus the share of the PEA that moved out that destination state towards any other state. The other rows correspond to the proportion of the PEA that moved from each origin state to each destination state minus the proportion of the PEA that moved from the destination state towards the origin state.
16
In the case of non-salaried worker, the transition probabilities indicate that the probability of moving to or remaining as a non-salaried worker is high in the first years of the working life, decreases at an age of 20 years old when people become salaried or unemployed looking for better job opportunities, and then increases again and stabilizes around 90%. The probabilities are lower for women, for whom is higher the probability of moving from a non-salaried job to unemployment, and higher for rural areas and people without higher education, which end up conforming the informal population. Figure 5.b indicates that there is a pattern of replacement between the probabilities of moving towards non-salaried and unemployment, which may indicate that in fact, people do move to non-salaried jobs to avoid unemployment. This is also supported by the probability of moving from unemployment to non-salaried jobs, which increases over time and is higher than the probability of passing from unemployment to a salaried job (Figure 6.a).
For unemployment, the transition probabilities also indicate that the probability of moving to or remaining as unemployed increases with the passing of the years and reaches the maximum at around 20% in old age. The same pattern holds for movements towards inactivity which may be due to a retirement age effect. In the meanwhile, the probability of moving from unemployment to a salaried job is low at the beginning of the working life but increases and reaches a maximum of 40% at an age of 20 years old, then decreases over time, especially in the case of women, rural areas and people without higher education.
17 Figure 5.a
18 Figure 6.a
19
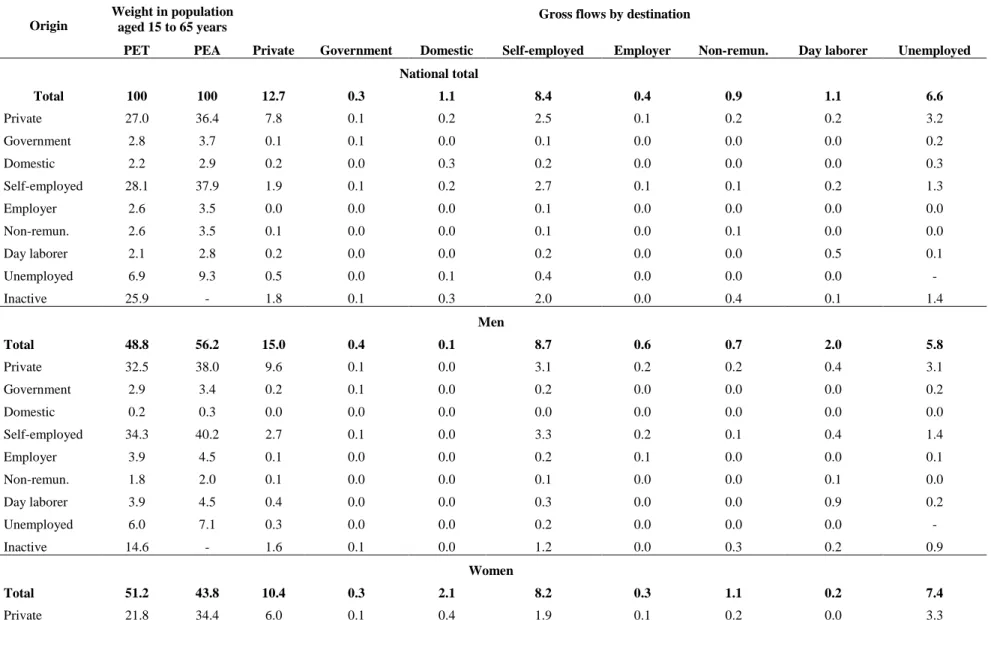
Regarding the occupational positions, private employee is the most dynamic position, accounting for 61% of the total mobility. 12.7% of the EAP moved from or towards private sector in the period of analysis (Table B.1 in Appendix B). This occupational position is a net receptor of inactive people (1.84% of the EAP), notably women and educated (2.08% and 2.63% of the EAP, respectively. Table B.2 in Appendix B). Private jobs also recruit, to a lesser extent, government and day laborer employees (0.03% each one), especially men (0.11%) and unskilled workers (0.08%) in the first case, and urban (0.07%), men (0.05%) and unskilled workers (0.04%) in the second one. However, this occupation is also the largest expeller, especially in the case of men (1.78%), people with higher education (2.89%), urban population (2.08%) and towards unemployment (5.54%).
The dynamics among informal people changes slightly (Tables B.3 and B.4 in Appendix B). Private sector is also a net expeller, but unemployment and self-employment become now other sources of labor force for private jobs (1.03% and 0.39% of the EAP, respectively). The main drivers of this change are self-employed informal men (1.85%), skilled informal self-self-employed people (1.16%), and unemployed women (0.61%), skilled (0.74%) and rural (0.48%) employees.
The probabilities in Figure 7.a indicate that moving from a private job to another private job is less likely when people is young, but the probability increases with age, which can be due to an effect of experience or a process of learning skills over time. This probability is lower for women and rural individuals during the first years of the working life, but it converges to the other groups’ probabilities with age. It also shows that the probability of passing to unemployment is higher at the beginning of the career path but reduces significantly after 20 years old for all groups, especially for men and unskilled workers. The probability of moving towards self-employment is smaller but quite stable over time at a level of 12% for all individuals and the probability of moving towards a non-remunerated job is 5% and converges to zero with age. The probability of transition to any other occupation is zero or very close to zero for all groups.
20 Figure 7.a
21
unemployment, so the net flow estimator indicate that the sector is a net expeller. When we analyze characteristics, the sector is more dynamic in the case of men, educated and people from urban areas (0.4%, 1.0% and 0.4% of the EAP, respectively). It behaves in the same manner regarding the sectors from which it takes and expels workforce. Some of those individuals expelled to private jobs or self-employment can start making part of informality. It means that coming from a government job, the one with highest quality, is not a guarantee of avoiding the lower quality jobs which are those under informality, especially in the case of educated people moving towards self-employment.
The Figure 7.b shows that the probability of moving from a government job to either the private sector or unemployment is higher in the first years of the working life (especially high for young women) but decreases with age and becomes very close to zero after 40 years old. Transition from a government job to another one has a low probability for young people (except for rural areas) but it increases quickly after 25 years and becomes very close to 100% after 40 years old for most groups. The probability of moving to self-employment increases until 20% between 15 and 25 years old, then it becomes close to zero. Summarizing, the dynamics of the government sector is driven mainly by young people who are in their learning process, but once individuals are immersed in the public sector and are experienced or old enough, the probability of remaining in the sector increases and becomes close to 100%. The pattern doesn’t change across demographic groups.
Domestic jobs represent 6.1% of total mobility and as expected, are driven mainly by women, unskilled and urban people (2.1%, 1.4% and 1.2% of the EAP, respectively). This sector feeds essentially from domestic workers, inactive and private employees. The sector expels labor force mainly towards self-employment and unemployment, notably in the case of women. The patterns stay the same in the case of domestic informal employee with the difference that now unemployment becomes another source of labor force and the expelled labor force is taken by unpaid jobs.
22
Figure 8.a
23
Self-employee is the second most dynamic group, after private employee. This position accounts for 39.3% of total mobility or the 8.4% of the movements performed by the EAP. The position receives labor force mainly from the private sector and inactivity (2.5% and 2.0% of the EAP, respectively). In the case of private employees, men (3.1%) and educated (3.0%) and urban areas’ people (2.8%) are those who transit to self-employment. While in the case of inactive people, the movements are performed mainly by women (2.7%), non-educated (2.2%) and rural inhabitants (2.2%). On the other hand, the probability of moving from self-employment to self-employment (i.e. changes in economic activity, changes in the type of business, etc.) is around 2.5% for all demographic groups and this kind of changes are also very representative in the gross flow of the position. The position expels labor force towards unemployment and the private sector, but it is a net receiver in the case of the movements from and towards private sector. Self-employment expels mainly man to the private sector (2.7%) while the proportion is nearly the same across groups when expelling to unemployment (around 1.3% in average).
When we look at the flows into informality, the trend does not change but now the measures are bigger, especially in the case of people with higher education entering to the position from the private sector (7.7%). Furthermore, government workers become now a source of labor force, 0.19% of the net flows are from government jobs to self-employment, and it is mainly driven by men (0.26%) and urban area (0.20%).
On the other side, transition probabilities indicate that once an individual becomes self-employee, there is a low probability of moving to any other occupational position, remarkably in old age. In the first years of the working life, individuals may transit to from self-employment to unemployment, non-remunerated job or the private sector, with a probability of around 15, being higher in the case of unemployment. As Figure 8.b shows, this pattern is persistent among demographic groups but the probability of staying the same (as self-employees) is almost constant over the working life for rural workers and for people without higher education. Also, the probability of moving towards unemployment is higher for women than for man in the whole trajectory.
24
the private sector and the self-employment in an equal proportion; and this position expels workers almost uniquely to the self-employment. It is worth noting that the gross and net flows from and towards this occupation are very close to zero for women, educated people and rural area; and slightly higher when it comes for women moving towards unemployment.
In the case of informality, the magnitudes are a bit higher in the aggregate, but they remain very close to zero among the demographical groups and the patterns does not change, except for day laborer that now becomes a source of male and unskilled labor force.
The Figure 9 indicates, however, that the position tends to be the more stable in the labor market, since the probability of staying as an employer is very close to one for all demographic groups and the probability of moving to any other occupation is very close to zero; which may explain the low participation of the occupation in the labor dynamics. Furthermore, the stability starts even in young age, since the probability is almost one rounding 20 years old, and as probabilities indicate, education is not a factor of difference between the probabilities.
25
In the case of day laborer and non-remunerated workers, the gross and net flows are also very low and the flow’s pattern does not differ from that in the employer’s case. However, the estimates can be found in tables B.1 and B.2 of the Appendix B and the figures B.1 and B.2 represent the transition probabilities for these two occupational positions.
As the previous analysis indicates, the flows in the Colombian labor market during the period 2015-2016 where driven mainly by self-employees and the private sector. Some demographical groups experience a higher amount of movements depending on the occupational position, for example, in the case of women, they moved mainly from an towards these two occupations and domestics jobs, while men flows seems to be more significant in the case of government employees and employers.
V. Expected labor trajectory for Colombian population and the effect of
the transition probabilities on informality rate.
Lopez & Lasso (2012), point out the existence of a labor life cycle that start with young people entering to the market as salaried workers where they perceive high levels of income, then suffer transitions to unemployment raising the unemployment rate; and end up with non-salaried jobs as informal self-employed and with lower levels of income.
26
Note: Figure 10 represents the share of the population in each one of the labor market states and position by age. The curvature of the lines indicates the presence of a cycle in the working life of the Colombian population.
As Figure 10 shows, the panorama has not changed so much in the last two years, and the cycle, in terms of occupational positions, starts with young inactive people entering to private jobs or starting a new business, then a learning process takes place while the individuals rotate among the different occupations but with a very small probability if those positions are different from private employee or self-employment, and end up in self-employment with a very high probability.
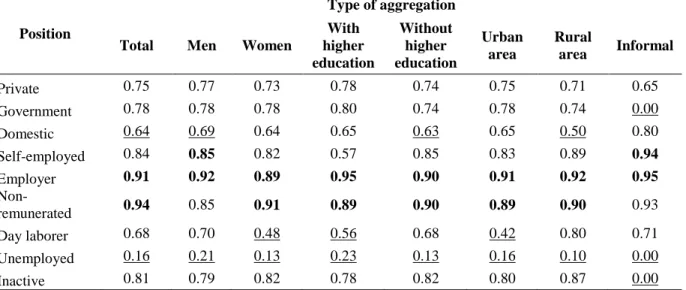
The following table presents the average probabilities of staying in the same occupational position, obtained from the estimation using Markov chains. It is worth nothing that for those people who are currently employers or non-remunerated, the probability of staying as employers or non-remunerated does not vary with gender, education, area or formality status; it is about 90% for all types of disaggregation.
Table 3 Average probabilities of stay in the same occupational position by demographic characteristics
Position
Type of aggregation
Total Men Women
With higher education Without higher education Urban area Rural
area Informal
Private 0.75 0.77 0.73 0.78 0.74 0.75 0.71 0.65 Government 0.78 0.78 0.78 0.80 0.74 0.78 0.74 0.00 Domestic 0.64 0.69 0.64 0.65 0.63 0.65 0.50 0.80 Self-employed 0.84 0.85 0.82 0.57 0.85 0.83 0.89 0.94 Employer 0.91 0.92 0.89 0.95 0.90 0.91 0.92 0.95
Non-remunerated 0.94 0.85 0.91 0.89 0.90 0.89 0.90 0.93 Day laborer 0.68 0.70 0.48 0.56 0.68 0.42 0.80 0.71 Unemployed 0.16 0.21 0.13 0.23 0.13 0.16 0.10 0.00 Inactive 0.81 0.79 0.82 0.78 0.82 0.80 0.87 0.00
Note: Table 3 represents the average probability of staying in the same occupational position across age. This measures have into account the people that have changed its job but whose jobs belong to the same occupational position.
In the case of men and women, the higher probabilities corresponds to those of remain as employer, non-remunerated, self-employee and inactive; but in a higher measure for women remaining as inactive and non-remunerated while for men remaining as employers or self-employees.
27
The most unstable positions or states are unemployment, domestic and day laborer worker, it means that people who start their career path in one of these occupations face a low probability of staying the same. However, these probabilities differ greatly by demographic groups. For men, it is highly likely remain as a domestic or day laborer worker, these two probabilities are very close to those of the other occupations; and the probability of staying unemployed is even higher than the national average and the women’s average.
Urban jobs seem to be more stable than rural jobs since the probabilities of staying the same in the urban area are higher than those of the rural area, except for day laborer workers. In the case of informality, the probability of remaining as informal is especially high for self-employees, employers and non-remunerated workers (95% in average). These probabilities may indicate that stronger policy programs should be applied towards the formalization of these occupational position since the informal people inside them tend to remain informal over time.
The trajectory paths for each one of the age cohorts of the Colombian population are presented in the following figures (11.a to 12.e):
Figure 11.a Figure 11.b
Note: Figure 11.a and 11.b show the results obtained from the survival and Markov chains estimation, for each one of the age cohorts by labor market state. Each one of the lines represents the career path of the cohort until it reach 64 years old.
28
cohorts, it is high for young people, decreases during the middle age to 20% and increases again in old age. A similar case occurs with informality, the probability of becoming informal is low for young people and increases with age to more than 40%, but the cohorts’ probabilities converge to the same curve, indicating a generalized cycle among generations. In the case of unemployment, the cohorts differ in their starting point where the level of unemployment is higher for young cohorts, but it reduces constantly across time and converges across generations.
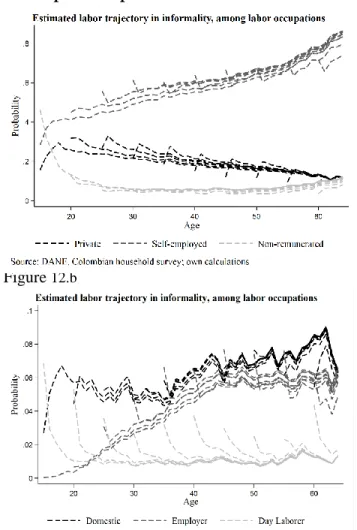
Among labor occupations, the transition probabilities have a great effect on the trajectory path. As Figure 12 indicates, the probability of become a private employee is higher during old age (around 30%) but it is even higher if the position belongs to the informal sector, the same pattern is present in the position of employer. However, in the case of self-employees, the career path indicates that about half of the population will be self-employee, and seems to be the same for both, total of private employees and informal private employees, this could be due to the high proportion of informal individuals into this occupational position.
In the case of domestic workers, the career path indicates a low probability of being a domestic worker for young people but a high probability of being domestic worker in old age. Nonetheless, in the case of informal domestic worker, the probability tends to be high and stable during the whole working life.
The probability of being a non-remunerated worker decreases with age and it also seems not to change when we compare private employees versus informal private employees. Again, this could be due to the high proportion of non-remunerated employees that are informal as in the case of self-employees.
29
Figure 12. Estimated labor trajectory among labor occupational positions
Figure 12.a Figure 12.b
Figure 12.c Figure 12.d
Figure 12.e
30
The results presented above may differ in a great measure when we look at them by gender.
When we compare man and women (Table 4), estimation results suggest that the probability of being inactive is about 20 p.p. higher for women than for men during the full labor path and they converge over cohorts, which means it is likely for all generations to follow this pattern. The probability of being self-employee is also higher for women than for men (around 15 p.p.) during the whole trajectory, but there is minor difference regarding the career path for those that are private employees.
The greatest difference is present for the position of domestic employees. The men’s career path indicated that about 0% of men of all each will be occupying this position while the share of women will increase up to 9% during old age for current young women. A similar trend is present in the position of non-remunerated workers, where 5% of men of all ages will be participating while the share is about 5% for old women and increases up to 9% for young women.
31
Figure 13. Estimated labor trajectory among labor positions by gender
Figure 13.a Figure 13.b
Figure 13.c Figure 13.d
32
Estimation of the informality rate for the following five years
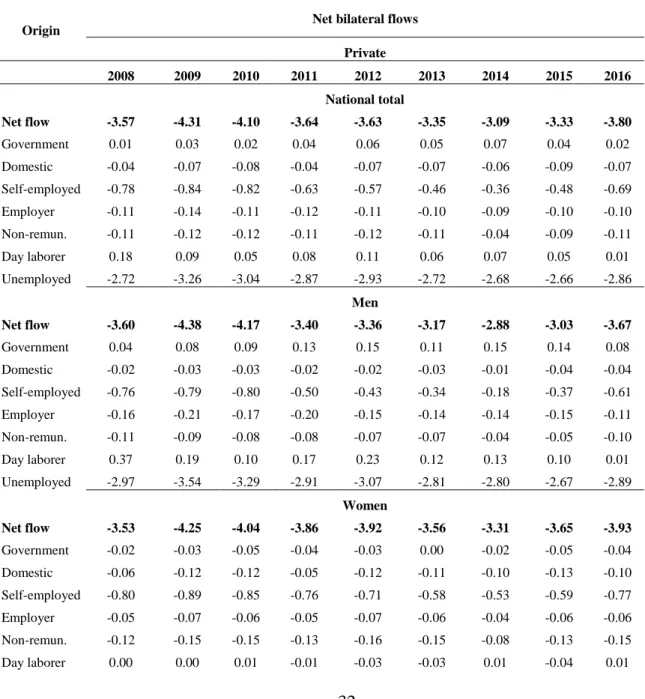
The probability of transiting among labor market states or position have changed very slightly across time. The following tables (Tables 4 and 5) present the net flows for private employees and self-employees for the period 2008-2016, these occupational positions are selected since, as presented before, they constitute the bulk of informality and are the positions that drive the informality dynamics. The tables corresponding to the labor market states and the other occupational positions can be found in the appendix C and the full set of results can be sent at the request of the reader.
Table 4. Net bilateral flows to private employee across years
Origin Net bilateral flows
Private
2008 2009 2010 2011 2012 2013 2014 2015 2016
National total
Net flow -3.57 -4.31 -4.10 -3.64 -3.63 -3.35 -3.09 -3.33 -3.80
Government 0.01 0.03 0.02 0.04 0.06 0.05 0.07 0.04 0.02
Domestic -0.04 -0.07 -0.08 -0.04 -0.07 -0.07 -0.06 -0.09 -0.07 Self-employed -0.78 -0.84 -0.82 -0.63 -0.57 -0.46 -0.36 -0.48 -0.69 Employer -0.11 -0.14 -0.11 -0.12 -0.11 -0.10 -0.09 -0.10 -0.10 Non-remun. -0.11 -0.12 -0.12 -0.11 -0.12 -0.11 -0.04 -0.09 -0.11
Day laborer 0.18 0.09 0.05 0.08 0.11 0.06 0.07 0.05 0.01
Unemployed -2.72 -3.26 -3.04 -2.87 -2.93 -2.72 -2.68 -2.66 -2.86
Men
Net flow -3.60 -4.38 -4.17 -3.40 -3.36 -3.17 -2.88 -3.03 -3.67
Government 0.04 0.08 0.09 0.13 0.15 0.11 0.15 0.14 0.08
Domestic -0.02 -0.03 -0.03 -0.02 -0.02 -0.03 -0.01 -0.04 -0.04 Self-employed -0.76 -0.79 -0.80 -0.50 -0.43 -0.34 -0.18 -0.37 -0.61 Employer -0.16 -0.21 -0.17 -0.20 -0.15 -0.14 -0.14 -0.15 -0.11 Non-remun. -0.11 -0.09 -0.08 -0.08 -0.07 -0.07 -0.04 -0.05 -0.10
Day laborer 0.37 0.19 0.10 0.17 0.23 0.12 0.13 0.10 0.01
Unemployed -2.97 -3.54 -3.29 -2.91 -3.07 -2.81 -2.80 -2.67 -2.89
Women
Net flow -3.53 -4.25 -4.04 -3.86 -3.92 -3.56 -3.31 -3.65 -3.93
33
Unemployed -2.49 -2.99 -2.81 -2.83 -2.80 -2.64 -2.56 -2.65 -2.82
With higher education
Net flow -5.27 -6.10 -6.04 -5.57 -5.57 -5.29 -4.61 -5.18 -5.92
Government -0.15 -0.10 -0.16 -0.15 -0.07 -0.02 -0.06 -0.08 -0.14 Domestic -0.03 -0.03 -0.07 -0.04 -0.05 -0.02 -0.06 -0.05 -0.08 Self-employed -1.20 -1.44 -1.48 -1.26 -1.23 -1.10 -0.72 -1.01 -1.26 Employer -0.17 -0.27 -0.21 -0.17 -0.15 -0.17 -0.08 -0.17 -0.14 Non-remun. -0.13 -0.14 -0.14 -0.13 -0.15 -0.14 -0.09 -0.14 -0.16
Day laborer -0.01 0.01 0.01 0.01 0.00 0.00 0.01 -0.02 0.01
Unemployed -3.59 -4.13 -4.00 -3.83 -3.90 -3.84 -3.63 -3.71 -4.14
Without higher education
Net flow -3.12 -3.85 -3.57 -3.09 -3.07 -2.70 -2.56 -2.71 -3.14
Government 0.05 0.06 0.07 0.10 0.10 0.08 0.11 0.09 0.08
Domestic -0.04 -0.09 -0.08 -0.04 -0.09 -0.08 -0.06 -0.10 -0.07 Self-employed -0.67 -0.68 -0.64 -0.44 -0.38 -0.25 -0.23 -0.30 -0.49 Employer -0.09 -0.10 -0.09 -0.11 -0.10 -0.07 -0.09 -0.09 -0.16 Non-remun. -0.11 -0.12 -0.11 -0.10 -0.11 -0.10 -0.04 -0.09 -0.11
Day laborer 0.23 0.12 0.07 0.10 0.14 0.08 0.09 0.08 0.01
Unemployed -2.50 -3.04 -2.78 -2.60 -2.63 -2.35 -2.34 -2.30 -2.39
Urban area
Net flow -4.38 -5.16 -4.84 -4.36 -4.40 -4.02 -3.65 -3.85 -4.73
Government -0.02 0.03 0.02 0.05 0.06 0.06 0.07 0.05 -0.16
Domestic -0.06 -0.10 -0.09 -0.05 -0.13 -0.10 -0.07 -0.09 -0.08 Self-employed -1.01 -1.07 -1.01 -0.82 -0.74 -0.65 -0.46 -0.61 -0.92 Employer -0.12 -0.16 -0.14 -0.14 -0.13 -0.12 -0.10 -0.11 -0.16 Non-remun. -0.11 -0.14 -0.12 -0.11 -0.12 -0.12 -0.07 -0.09 -0.12
Day laborer 0.12 0.10 0.09 0.08 0.11 0.08 0.09 0.09 0.04
Unemployed -3.19 -3.82 -3.59 -3.38 -3.44 -3.18 -3.10 -3.08 -3.32
Rural area
Net flow -0.85 -1.31 -1.47 -1.06 -0.98 -0.90 -0.98 -1.38 -0.96
Government 0.01 0.03 0.02 0.03 0.06 0.01 0.06 0.04 0.03
Domestic 0.03 0.02 -0.02 0.00 0.01 0.03 -0.01 -0.10 -0.03
34
Table 5. Net bilateral flows to self-employee across years
Origin Net bilateral flows
Self-employed
2008 2009 2010 2011 2012 2013 2014 2015 2016
National total
Net flow 0.32 0.09 -0.02 -0.17 -0.34 -0.40 -0.47 -0.34 -0.23
Private 0.78 0.84 0.82 0.63 0.57 0.46 0.36 0.48 0.69
Government 0.06 0.08 0.07 0.10 0.07 0.09 0.06 0.05 0.07
Domestic 0.06 0.07 0.07 0.06 0.08 0.04 0.03 0.02 0.04
Employer -0.03 -0.06 -0.06 -0.06 -0.12 -0.05 -0.04 -0.03 -0.04
Non-remun. -0.01 -0.03 -0.01 0.00 0.00 0.00 0.01 -0.01 -0.03
Day laborer 0.13 0.08 0.07 0.02 0.03 -0.04 -0.02 -0.02 -0.06
Unemployed -0.67 -0.89 -0.99 -0.92 -0.97 -0.89 -0.86 -0.83 -0.91
Men
Net flow -0.05 -0.27 -0.30 -0.63 -0.68 -0.88 -0.94 -0.64 -0.58
Private 0.76 0.79 0.80 0.50 0.43 0.34 0.18 0.37 0.61
Government 0.11 0.12 0.10 0.15 0.16 0.13 0.09 0.08 0.11
Domestic -0.02 -0.01 0.01 -0.02 -0.01 -0.02 -0.03 0.00 -0.01
Employer -0.05 -0.10 -0.10 -0.08 -0.08 -0.05 -0.05 -0.02 0.05
Non-remun. -0.02 -0.02 0.00 0.00 0.02 -0.01 0.02 -0.01 -0.01
Day laborer 0.22 0.13 0.12 0.02 0.02 -0.10 -0.06 -0.04 -0.14
Unemployed -1.04 -1.17 -1.22 -1.19 -1.23 -1.16 -1.09 -1.01 -1.20
Women
Net flow 0.67 0.43 0.27 0.26 0.20 0.05 -0.01 -0.07 0.20
Private 0.80 0.89 0.85 0.76 0.71 0.58 0.53 0.59 0.77
Government 0.02 0.04 0.05 0.06 0.05 0.04 0.03 0.02 0.04
Domestic 0.13 0.15 0.14 0.14 0.16 0.09 0.08 0.04 0.09
Employer -0.01 -0.02 -0.01 -0.05 -0.03 -0.04 -0.03 -0.03 -0.04
Non-remun. 0.00 -0.03 -0.02 0.00 -0.01 0.01 0.02 0.01 0.00
Day laborer 0.05 0.03 0.02 0.02 0.03 0.01 0.02 -0.04 -0.04
Unemployed -0.33 -0.63 -0.76 -0.66 -0.72 -0.64 -0.64 -0.65 -0.63
With higher education
Net flow 0.76 0.93 0.92 0.56 0.43 0.30 -0.22 0.12 0.19
Private 1.20 1.44 1.48 1.26 1.23 1.10 0.72 1.01 1.26
Government 0.15 0.12 0.11 0.20 0.10 0.12 0.03 0.02 0.11
Domestic 0.00 0.00 0.00 0.01 0.00 -0.02 -0.05 0.00 0.00
Employer -0.01 -0.07 -0.04 -0.08 -0.05 -0.02 -0.13 -0.03 -0.10 Non-remun. -0.02 -0.02 -0.02 -0.01 0.02 -0.05 -0.01 -0.03 -0.04
Day laborer 0.00 0.00 0.02 0.00 -0.01 0.01 0.05 -0.01 0.01
Unemployed -0.55 -0.55 -0.61 -0.82 -0.88 -0.85 -0.82 -0.85 -1.05
Without higher education
35
Private 0.67 0.68 0.64 0.44 0.38 0.25 0.23 0.30 0.49
Government 0.04 0.07 0.07 0.07 0.08 0.09 0.08 0.09 0.07
Domestic 0.08 0.09 0.09 0.07 0.04 0.06 0.05 0.02 0.06
Employer -0.04 -0.06 -0.06 -0.06 -0.05 -0.06 -0.04 -0.03 -0.03
Non-remun. -0.01 -0.03 -0.01 0.00 0.01 0.01 0.02 0.01 0.15
Day laborer 0.17 0.10 0.08 0.03 0.03 -0.06 -0.03 -0.02 -0.09
Unemployed -0.70 -0.98 -1.09 -0.95 -1.00 -0.91 -0.87 -0.82 -0.85
Urban area
Net flow 0.39 0.26 0.22 0.03 -0.17 -0.18 -0.39 -0.31 0.02
Private 1.01 1.07 1.01 0.82 0.74 0.65 0.46 0.61 0.92
Government 0.08 0.09 0.08 0.11 0.09 0.09 0.05 0.05 0.07
Domestic 0.04 0.06 0.06 0.05 0.00 0.03 -0.01 -0.03 0.03
Employer -0.03 -0.06 -0.05 -0.07 -0.06 -0.05 -0.04 -0.05 0.01 Non-remun. -0.03 -0.03 -0.02 -0.01 -0.01 -0.02 0.00 -0.05 -0.06
Day laborer 0.08 0.10 0.09 0.06 0.07 0.05 0.06 0.04 0.05
Unemployed -0.76 -0.97 -0.94 -0.92 -1.00 -0.93 -0.91 -0.88 -1.00
Rural area
Net flow 0.07 -0.51 -0.87 -0.90 -0.78 -1.22 -0.87 -0.58 -1.19
Private -0.01 0.04 0.18 -0.03 -0.04 -0.22 -0.02 0.00 -0.38
Government 0.02 0.04 0.06 0.07 0.08 0.04 0.01 0.06 0.08
Domestic 0.13 0.10 0.09 0.09 0.14 0.08 0.07 0.06 0.08
Employer -0.03 -0.06 -0.06 -0.04 -0.02 -0.01 -0.03 0.00 -0.16
Non-remun. 0.04 -0.02 0.03 0.05 0.06 0.06 0.07 0.17 0.21
Day laborer 0.31 0.01 -0.02 -0.11 -0.14 -0.40 -0.31 -0.24 -0.47 Unemployed -0.38 -0.63 -1.14 -0.92 -0.86 -0.77 -0.65 -0.63 -0.55 Source: Colombia Household’s survey. Own calculations
36
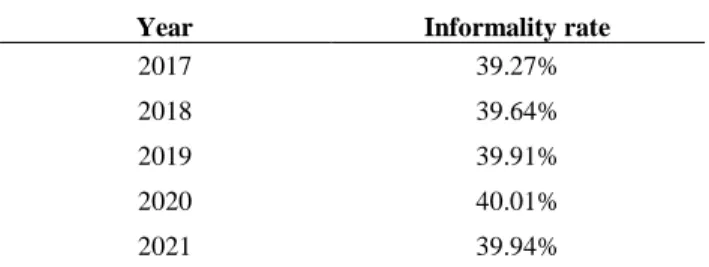
The table 6 presents the results of this estimation:
Table 6. Estimated informality rate for the next five years.
Year Informality rate
2017 39.27%
2018 39.64%
2019 39.91%
2020 40.01%
2021 39.94%
Estimation results indicate that the informality rate will be stable at a level of 39% during the following five years, which is very close to the current levels of informality by the firm size definition. The stability of the informality rate lies mainly on the stability of informality in the occupation self-employees that, as explained before, is the bulk of the informality.
VI. Conclusions
The salaried job is the driver of the labor market dynamics. The movements generated by salaried jobs account for the 57.5% of the total mobility, and for the bulk of the mobility for male, skilled and the urban people. In the case of women, unskilled and rural population; the main driver of the labor market dynamics is the non-salaried job.
The salaried and inactive states are revealed are net expellers of labor force, and this trend is preserved across disaggregation by gender, area and education; being stronger in the case of inactive people. Non-salaried and unemployment states are net receivers of labor force and this last state it the one that receives the most of the population (around 90% of the total).
37
Government jobs are the less dynamic ones due to the job security of the sector. The sector is a net expeller. It receives labor force mainly from private employees, self-employed and inactive people; and expels labor force to the same sectors from which it receives. Some of those individuals expelled to private jobs or self-employment can start making part of informality. It means that coming from a government job, the one with highest quality, is not a guarantee of avoiding the lower quality jobs which are those under informality, especially in the case of educated people moving towards self-employment. The dynamics of the government sector is driven mainly by young people who are in their learning process, but once individuals are immersed in the public sector and are experienced or old enough, the probability of remaining in the sector increases and becomes close to 100%. The pattern doesn’t change across demographic groups.
The domestic sector feeds essentially from domestic workers, inactive and private employees. The sector expels labor force mainly towards self-employment and unemployment, notably in the case of women. The patterns stay the same in the case of domestic informal employee with the difference that now unemployment becomes another source of labor force and the expelled labor force is taken by unpaid jobs.
Self-employee is the second most dynamic group, after private employee. The position receives labor force mainly from the private sector and inactivity. The position expels labor force towards unemployment and the private sector, but it is a net receiver in the case of the movements from and towards private sector. The trend into informality does not change but now the measures are bigger, especially in the case of people with higher education entering to the position from the private sector and government workers become also a source of labor force. Furthermore, transition probabilities indicate that once an individual becomes self-employee, there is a low probability of moving to any other occupational position, remarkably in old age.
Employer is a position that tends to be the more stable in the labor market, then it does not contribute so much neither on the labor dynamics nor the informality dynamics. In addition, the stability starts even in young age and education is not a factor of difference between the probabilities.
Across time, the most unstable positions or states appear to be unemployment, domestic and day laborer worker, which means that people who start their career path in one of these occupations face a low probability of staying the same.
self-38
employee and inactive; but in a higher measure for women remaining as inactive and non-remunerated while for men remaining as employers or self-employees.
Then, there is evidence suggesting the existence of a labor life cycle that starts with young inactive people entering to private jobs or starting a new business, and then a learning process takes place while the individuals rotate among the different occupations, and end up in self-employment.
Urban jobs seem to be more stable than rural jobs since the probabilities of staying the same in the urban area are higher than those of the rural area, except for day laborer workers. Furthermore, in the case of informality, the probability of remaining as informal is especially high for self-employees, employers and non-remunerated workers (95% in average). These probabilities may indicate that stronger policy programs should be applied towards the formalization of these occupational position since the informal people inside them tend to remain informal over time.
The transition probabilities also have a great effect on the trajectory path among labor occupational positions. The probability of become a private employee is higher during old age (around 30%) but it is even higher if the position belongs to the informal sector and the same pattern is present in the position of employer. The career path estimations indicate that about half of the population will be self-employee, and seems to be the same for both, total of private employees and informal private employees, which could be due to the high proportion of informal individuals into this occupational position.
The labor trajectory estimation indicates a low probability of being a domestic worker for young people but a high probability of being domestic worker in old age. Nonetheless, in the case of informal domestic worker, the probability tends to be high and stable during the whole working life, And in the case of unemployment, it indicates a high probability of being unemployed in youngness which decreases with age, and it may be due to an experience effect.
The career path estimation differ in a great measure when we look at them by gender, suggesting that women will transit from private employee and unemployment to self-employment and to domestic and non-remunerated jobs, which can be finally understood as moving towards informality.
39
40
References
Alaimo, V., Bosch, M., Kaplan, D., Pagés, C., & Ripani, L. (2015). Empleos para crecer.
Balán, J., Browning, H. L., & Jelin, E. (1973). Men in a developing society. Institute of Latin American Studies, Austin, TX: University of Texas Press.
Bosh, M., & Maloney, W. (2008). Cyclical movements in unemployment and informality in developing countries.
Cárdenas, M., & Mejía, C. (2007). Informalidad en Colombia: nueva evidencia.
Elsby, M., Smith, J., & Wadsworth, J. (2010). The Role of Worker Flows in the
Dynamics and Distribution of UK Unemployment. CEP Discussion Paper Nro.
1058, The London School of Economics and Political Science.
Gonzalez de la Rocha, M. (1994). The resources of poverty: Women and survival in a
Mexican city. Cambridge: Blackwell.
Goñi, E. (2013). Andemic Informality: Assesing Labor Informality, Employment and Income Risk in the Andes. Inter-American Development Bank.
Harris, J. R., & Todaro, M. P. (1970). Migration, unemployment, and development: A two sector analysis. American Economic Review, 60(1), 126-142.
Lasso Valderrama, F. (2011). La dinámica del desempleo urbano en Colombia.
Borradores de Economía(667).
Loayza, N., Oviedo, A., & Servén, L. (2005). The impact of regulation on growth and informality cross-country evidence.
López Castaño, H. (2017, Junio 9). Universidad EAFIT. Retrieved from Esc. de Economía y Finanzas / Bulletin News:
http://www.eafit.edu.co/escuelas/economiayfinanzas/noticias-eventos/Paginas/desempeno-laboral-colombiano-primer-trimestre-2017.aspx
41
López Castaño, H., & Lasso Valderrama, F. (2015). Flujos de trabajadores en el mercado laboral colombiano, determinantes de las diferencias entre hombres y mujeres, y futuro laboral esperado. Inter-America Development Bank.
López, H., Henao, M., & Sierra, O. (1981). El empleo en el sector informal: el caso de Colombia.
Maloney, W. F. (2004). Informality revisited. World development, 32(7), 1159-1178.
Mondragón-Vélez, C., Peña, X., & Wills, D. (2010). Labor Market Rigidities and Informality in Colombia. Economía, 11(1), 65-95.
Mortensen, D., & Pissarides, C. A. (1999). Job reallocation, employment fluctuations and unemployment. Handbook of macroeconomics. Handbook of macroeconomics, 1, 1171-1228.
Pries, M., & Rogerson, R. (2005). Hiring policies, Labor Market Institutions and Labor Market Flows. Journal of Political Economy, 113(4), 811-839.
Selby, H. A., Murphy, A. D., & Lorenzen, S. A. (1990). The Mexican urban household, organizing for self-defense. Austin, TX: University of Texas Press.
Shimer, R. (2007). Reassessing the Ins and Outs of Unemployment. NBER Working Paper Nro. 13421 Cambridge, Mass.: The National Bureau of Economic Research.
Velleman, P. F. (1977). Robust nonlinear data smoothers: Definitions and
42
Appendix A
The questions used to retrieve the information about the labor status of the individuals are presented below:
Employed
1. How long have you been working in this company, business, industry, office or farm in a continuous way? (months)
2. In this job you are…: Employee of a private company, government employee, domestic employee, self-employed, employer, non-remunerated employee, day laborer.
3. Before your current job, ¿did you have another job?
4. How many months were you without work between your current job and your previous job?
5. How long did you last in your previous job?
6. In your previous job, you were: Employee of a private company, government employee, domestic employee, self-employed, employer, non-remunerated employee, day laborer.
Unemployed
1. For how many weeks have you been looking for a job?
2. Have you sought employment for the first time or had you worked before for at least two consecutive weeks? : First time, Worked before
3. How many weeks have you stopped working since the last time?
4. In this last job you were…: Employee of a private company, government employee, domestic employee, self-employed, employer, non-remunerated employee, day laborer.
Inactive
1. Have you ever worked for at least two consecutive weeks? 2. How long ago did you work for last time?
3. After that last job, have you made any diligence to get another job or set up a business?
4. Have you ever looked for a job?
5. How long is since you looked for a job for the last time?
43
Appendix B Table B.1 Gross bilateral flows by labor market occupational positions
Origin
Weight in population aged 15 to 65 years
Gross flows by destination
PET PEA Private Government Domestic Self-employed Employer Non-remun. Day laborer Unemployed
National total
Total 100 100 12.7 0.3 1.1 8.4 0.4 0.9 1.1 6.6
Private 27.0 36.4 7.8 0.1 0.2 2.5 0.1 0.2 0.2 3.2
Government 2.8 3.7 0.1 0.1 0.0 0.1 0.0 0.0 0.0 0.2
Domestic 2.2 2.9 0.2 0.0 0.3 0.2 0.0 0.0 0.0 0.3
Self-employed 28.1 37.9 1.9 0.1 0.2 2.7 0.1 0.1 0.2 1.3
Employer 2.6 3.5 0.0 0.0 0.0 0.1 0.0 0.0 0.0 0.0
Non-remun. 2.6 3.5 0.1 0.0 0.0 0.1 0.0 0.1 0.0 0.0
Day laborer 2.1 2.8 0.2 0.0 0.0 0.2 0.0 0.0 0.5 0.1
Unemployed 6.9 9.3 0.5 0.0 0.1 0.4 0.0 0.0 0.0 -
Inactive 25.9 - 1.8 0.1 0.3 2.0 0.0 0.4 0.1 1.4
Men
Total 48.8 56.2 15.0 0.4 0.1 8.7 0.6 0.7 2.0 5.8
Private 32.5 38.0 9.6 0.1 0.0 3.1 0.2 0.2 0.4 3.1
Government 2.9 3.4 0.2 0.1 0.0 0.2 0.0 0.0 0.0 0.2
Domestic 0.2 0.3 0.0 0.0 0.0 0.0 0.0 0.0 0.0 0.0
Self-employed 34.3 40.2 2.7 0.1 0.0 3.3 0.2 0.1 0.4 1.4
Employer 3.9 4.5 0.1 0.0 0.0 0.2 0.1 0.0 0.0 0.1
Non-remun. 1.8 2.0 0.1 0.0 0.0 0.1 0.0 0.0 0.1 0.0
Day laborer 3.9 4.5 0.4 0.0 0.0 0.3 0.0 0.0 0.9 0.2
Unemployed 6.0 7.1 0.3 0.0 0.0 0.2 0.0 0.0 0.0 -
Inactive 14.6 - 1.6 0.1 0.0 1.2 0.0 0.3 0.2 0.9
Women
Total 51.2 43.8 10.4 0.3 2.1 8.2 0.3 1.1 0.2 7.4
44
Government 2.6 4.1 0.1 0.1 0.0 0.1 0.0 0.0 0.0 0.2
Domestic 4.0 6.3 0.3 0.0 0.6 0.5 0.0 0.0 0.0 0.6
Self-employed 22.1 34.9 1.2 0.1 0.4 2.2 0.1 0.1 0.0 1.2
Employer 1.4 2.2 0.0 0.0 0.0 0.0 0.0 0.0 0.0 0.0
Non-remun. 3.3 5.3 0.1 0.0 0.0 0.1 0.0 0.1 0.0 0.0
Day laborer 0.4 0.6 0.0 0.0 0.0 0.0 0.0 0.0 0.1 0.1
Unemployed 7.8 12.3 0.6 0.0 0.1 0.6 0.0 0.1 0.0 -
Inactive 36.6 - 2.1 0.1 0.5 2.7 0.1 0.5 0.1 1.9
With higher education
Total 26.2 28.8 16.1 1.0 0.4 8.0 0.4 0.6 0.1 8.8
Private 38.7 47.6 10.5 0.3 0.1 3.0 0.2 0.2 0.0 4.7
Government 8.4 10.3 0.2 0.2 0.0 0.3 0.0 0.0 0.0 0.4
Domestic 5.9 0.7 0.1 0.0 0.1 0.1 0.0 0.0 0.0 0.1
Self-employed 19.8 24.3 1.9 0.2 0.1 2.5 0.1 0.1 0.0 1.5
Employer 3.0 3.7 0.0 0.0 0.0 0.1 0.0 0.0 0.0 0.0
Non-remun. 1.5 1.8 0.1 0.0 0.0 0.0 0.0 0.0 0.0 0.0
Day laborer 0.1 0.2 0.0 0.0 0.0 0.0 0.0 0.0 0.0 0.0
Unemployed 9.2 11.4 0.7 0.0 0.0 0.5 0.0 0.0 0.0 -
Inactive 18.6 - 2.6 0.2 0.1 1.6 0.1 0.2 0.0 2.1
Without higher education
Total 73.7 71.1 11.5 0.1 1.4 8.6 0.4 1.0 1.4 5.9
Private 22.8 31.9 6.8 0.0 0.3 2.3 0.1 0.2 0.3 2.7
Government 0.7 1.0 0.1 0.0 0.0 0.1 0.0 0.0 0.0 0.1
Domestic 2.7 3.8 0.2 0.0 0.4 0.3 0.0 0.0 0.0 0.4
Self-employed 31.0 43.3 1.9 0.0 0.3 2.8 0.2 0.1 0.3 1.2
Employer 2.5 3.4 0.0 0.0 0.0 0.1 0.1 0.0 0.0 0.1
Non-remun. 2.9 4.1 0.1 0.0 0.0 0.1 0.0 0.1 0.0 0.0
Day laborer 2.8 3.9 0.3 0.0 0.0 0.2 0.0 0.0 0.7 0.2
Unemployed 6.1 8.5 0.4 0.0 0.1 0.4 0.0 0.0 0.0 -
Inactive 28.4 - 1.6 0.0 0.4 2.2 0.0 0.5 0.1 1.2