Application of capillary zone electrophoresis withof f line solid phase extraction to in i vitro metabolism studies of antifungals
9
0
0
Texto completo
(2) 2504. A. L. Crego et al.. then, separation efficiency in CE is greatly reduced if the sample is dissolved in a high-ionic-strength solution (e.g., in an in vitro or in vivo matrix). Thus, to date only three works have been reported on analyses of antifungal compounds with CE [21–23] and in none of them an application to metabolic studies was carried out. The aim of this study is to report a rapid CE method to determine the stability of several antifungals in in vitro samples. A simple and robust solid-phase extraction (SPE) procedure for the cleanup and sample preconcentration of the antifungals (ketoconazole, clotrimazole, itraconazole, fluconazole, and voriconazole) and their metabolites after incubation with human liver microsomes, as well as a simplified capillary zone electrophoresis (CZE) method for their rapid analysis, were developed. Verapamil was used as a standard compound to monitor variations in the performance of the metabolizing system. This compound is a synthetic drug widely applied in a variety of cardiovascular disorders, whose metabolism has been well described [24].. 2 Materials and methods 2.1 Apparatus A P/ACE 5510 CE apparatus (Beckman Instruments, Fullerton, CA, USA), equipped with a diode array detector was used to carry out the analyses. A Compact Deskpro personal computer running Beckman System Gold software was employed to control the instrument. For separation, a fused-silica capillary tubing (Composite Metal Services, Worcester, UK) of 27 cm total length (20 cm effective length)650 mm ID was employed and voltages of 15 kV (anode on sampling end) was applied. The capillary was thermostated at 307C to carry out separations. Samples were injected hydrodynamically using N2 pressure of 0.5 psi (1 psi = 6894.76 Pa), and an injection of running electrolyte (1 s) after the sample zone was carried out. Electropherograms were recorded at a detection wavelength of 198 nm. A bath to incubate, model 5WB20, from Haake (Berlin, Germany) and a centrifuge (mod. Z231M) from Hermle (Gosheim, Germany) were used in the preparation of in vitro samples. A vacuum manifold (Millipore, Bedford, MA, USA) with different sorbent cartridges (100 mg C8, 100 mg C18, and 30 mg Oasis-HLB) from Waters (Milford, MA, USA) was used in the SPE procedure. To evaporate the eluates to dryness, a Turbovap LV Evaporator under a stream of nitrogen from Zymark Corporation (Hopkinton, MA, USA) was used. The pH of the running buffers was measured using a Titriprocessor, model 670, with a combined LL glass electrode from Metrohm (Herisau, Switzerland).. Electrophoresis 2001, 22, 2503–2511. 2.2 Reagents All chemicals were of analytical reagent grade and used as received. Phosphoric acid (H3PO4), and perchloric acid (70%) were purchased from Aldrich (Milwaukee, WI, USA); formic acid, dimethyl sulfoxide (DMSO), sodium hydroxide (NaOH) and hydrochloric acid (HCI) were supplied from Merck (Darmstadt, Germany); b-nicotinamide adenine dinucleotide phosphate tetrasodium salt in reduced form (b-NADPH) and Tris buffer (pH 7.4) were from Sigma (St. Louis, MO, USA), and phosphate-buffered saline (PBS) was purchased from Oxoid (Madrid, Spain). Methanol and acetonitrile were of HPLC-grade from Scharlab (Barcelona, Spain). The solutions for calibration of the pH electrode (pH 2.00, 3.00, and 4.00) were purchased from Panreac (Barcelona, Spain). Water was purified by using a Milli-Q system from Millipore. Standard of verapamil hydrochloride was purchased from Aldrich, ketoconazole and clotrimazole from Sigma, itraconazole from Janssen Pharmaceutica (Beerse, Belgium), fluconazole and voriconazole from Pfizer (New York, NY, USA). Molecular structures of these compounds are shown in Fig. 1. Finally, human liver microsomes were purchased from Xenotech (Kansas, KA, USA).. 2.3 Incubation procedure Incubations were carried out in 1.5-mL Eppendorf tubes. Each compound was incubated at a concentration of 10 mM with human liver microsomes and 2 mM b-NADPH for 30 and 60 min in a water bath at 377C under stirring (80 rpm). The incubation mixture contained 80 mL of the test compund (100 mM in 10% DMSO), 620 mL of the microsomal preparation in 0.1 M PBS (pH 7.4) with a protein concentration of 0.645 mg/mL, and 100 mL of 16 mM b-NADPH in 0.1 M Tris buffer (pH 7.4). A corresponding control sample without b-NADPH (only 100 mL of 0.1 M Tris buffer) was incubated in parallel to the active sample. In addition, an incubation mixture with 80 mL of 10% DMSO without the test compound was used as incubation blank. Incubation was terminated after 30 or 60 min by addition of 80 mL perchloric acid (30% in acetonitrile) at the incubation mixture and samples were centrifuged (3000 rpm for 10 min) to sediment the precipitated proteins prior to SPE.. 2.4 SPE procedure All samples were extracted from the supernatant after incubation by SPE using different sorbent cartridges. These extractions were performed using a vacuum manifold. The following procedure was used: the sorbent was first conditioned with 1 mL of methanol and equilibrated.
(3) Electrophoresis 2001, 22, 2503–2511. Metabolism studies of antifungals by CZE. 2505. Figure 1. Molecular structures of the compounds studied.. with 1 mL of water. The sample solution was loaded, then the cartridge was washed off interferences present in the sample matrix with 1 mL of methanol/water (5:95 v/v). The analytes of interest were eluted with 1 mL of eluent. The eluate was subsequently evaporated to dryness at 357C under a stream of nitrogen. Finally, the residues were reconstituted in 200 mL of methanol/water (50:50 v/v).. 2.5 Buffer and capillary preparation The phosphate buffers were prepared by adding appropriate aliquots of 0.5 M H3PO4 into water, adjusting to pH 2.2 with 0.1 M NaOH. Other running electrolytes were prepared by adding appropriate aliquots of formic acid into water, measuring their pHs. The hydro-organic running electrolytes were prepared daily by mixing methanol or acetonitrile with appropriate aliquots of 0.1 M phosphate buffer (pH 2.2) or formic acid into water (20:80 v/v). For the binary systems, the pH value given refers to that of an aqueous running electrolyte with the same composition. All electrolyte solutions were filtered through 0.45-mm pore size disposable nylon filters from Millipore. Before first use, a new capillary was preconditioned by rinsing with 1 M NaOH for 30 min, followed by a 15-min rinse with water. Before CE analysis, the capillary was conditioned with the running electrolyte for 15 min, and two blank injections of sample solvent (methanol/water. 50 : 50 v/v) were conducted to equilibrate the system. Between introduction of samples, the capillary was rinsed with the running electrolyte for 2 min. This rinsing step is needed to eliminate those components of the sample that could have not get out of capillary during the analysis time. At the end of each day, the capillary was rinsed with methanol for 2 min, 0.1 M NaOH for 2 min, 0.1 M HCl for 2 min, and water for 5 min.. 3 Results and discussion 3.1 Optimization of sample pretreatment When the in vitro microsomal incubations of each antifungal were analyzed by CZE using 0.3 M formic acid (pH 2.1) as running electrolyte (conditions close to those employed to analyze antifungal compounds in a previous work [25]) and simply injecting the filtered supernatant without further treatment, no peaks were detected. This was probably due to the high ionic strength originated by the sample matrix. Therefore, a sample pretreatment procedure for the analysis of these samples was studied using SPE with three different reversed-phase sorbents (100 mg C8, 100 mg C18 and 30 mg Oasis-HLB). The use of samples in 100% of organic solvents should be avoided (loss by evaporation may be significant in a short period of time and could affect the precision of the analy-.
(4) 2506. A. L. Crego et al.. Electrophoresis 2001, 22, 2503–2511. Figure 2. Bar-charts showing the recovery (%) obtained for five antifungals extracted from spiked human liver microsomes using different SPE procedures: three reversed-phase sorbents (100-mg C8, 100-mg C18, and 30-mg Oasis-HLB) and methanol alone or with 2% acetic acid as eluent.. sis [26]). Thus, standard solutions (1 mL) of all antifungals studied (10 mM in methanol) were evaporated using a gas vortex shearing technique (with a TurboVap workstation) and reconstituted in a mixture of methanol or acetonitrile with 50% water. Recoveries for all analyzed compounds were between 82.8% and 93.0% using acetonitrile (RSDn=5 = 6.9–11.7%), and between 93.7 and 105.3% using methanol (RSDn=5 = 3.2–5.6%). Therefore, due to the fact that the use of methanol as solvent in the reconstitution provides better and more reproducible recoveries, the following studies were performed using methanol/water (50:50 v/v) as solvent to reconstitute the samples in the final step of the SPE procedure. The recoveries obtained with the different SPE procedures were calculated using the same matrix of the in vitro samples spiked with known quantities of antifungal compounds. Two variables can affect the retention of these basic analytes in reversed-phase sorbents, the organic solvent concentration and the pH. Thus, the retention of the analytes decreases with an increase in the organic solvent concentration, being the basic analytes less retained at a lower pH, because they are ionized. Now then, the silica-based reversed-phase sorbents (e.g., C8 or C18 sorbent used) can not be used at pH 5 4, however, the Oasis sorbent is a divinylbenzene-based polymer which provides excellent pH stability across the entire pH range (0–14) [27]. In addition, this sorbent is a macroporous copolymer with hydrophilic-lipophilic balance which describes two major features: abilities to remain wetted with water, and to retain a wide spectrum. of both polar and nonpolar compounds. Figure 2 shows that the use of Oasis-HLB sorbent allowed to obtain recoveries higher than C8 or C18 sorbent, increasing the recovery when methanol containing 2% acetic acid (apparent pH 2.6) was used as eluent instead of methanol alone. The results of recoveries for all analyzed compounds were high (4 93.5%) and reproducible (RSDn=5 5 5.4%) except for itraconazole (74.5%). However, low (between 52.5 and 85.7% with C8, and between 37.5 and 75.6% with C 18) and less reproducible (RSDn=5 = 7.4–15.3%) recoveries were obtained with classical reversed-phase sorbents. These results are often obtained if these sorbents are accidentally run dry before loading the sample solution, a fact that never happens with an Oasis sorbent because it maintains its binding capacity even if drying occurs. Finally, an increase in the percentage of acetic acid added to methanol (5 and 10%, apparent pHs 2.35 and 2.15, respectively) did not have a major impact on recovery. In addition, the use of other eluents (acetonitrile, tetrahydrofurane, or ethyl acetate) instead of methanol led to similar recoveries but to less reproducible results when Oasis-HLB was used. Therefore, 2% acetic acid in methanol was the selected eluent in the SPE procedure used in this study. Representative electropherograms for human liver microsomes matrices after the off-line SPE procedure described are shown in Fig. 3. A wavelength of 198 nm was chosen for the analysis of all compounds studied because the majority of them (ketoconazole, clotrimazole, itraconazole, and verapamil) have the highest sensitivity,.
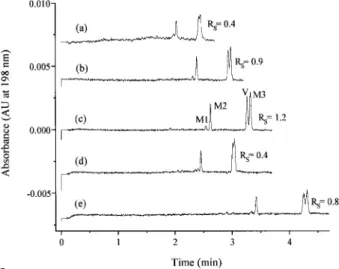
(5) Electrophoresis 2001, 22, 2503–2511. Figure 3. Electropherograms of extracts of a blank of human liver microsomes, and of human liver microsomes spiked with different antifungals and verapamil (2.5 mg/mL for each one of the compounds). Peaks: 1, ketoconazole, 2, clotrimazole, 3, verapamil, 4, itraconazole, 5, fluconazole, and 6, voriconazole. SPE procedure: 30 mg OasisHLB sorbent and methanol containing 2% acetic acid as eluent. Running electrolyte, 0.3 M formic acid (pH 2.1). Capillary, 27 cm (effective length 20 cm)650 mm ID. Applied voltage, 15 kV. UV-detection, 198 nm. Temperature, 307C. Hydrodynamic injection, 0.5 psi for 3 s.. and although an improved sensitivity for fluconazole and voriconazole was obtained at 190 nm, the important increase in the background noise advised against its use. Under these conditions, sample endogenous components do not interfere at the detection wavelength chosen. Therefore, there are three advantages of performing the sample pretreatment: (i) good peak shapes were obtained by CZE; (ii) no interfering peaks were observed; and (iii) a sample enrichment was achieved (a factor of about 4) because the final SPE eluates were reconstituted to a small volume.. Metabolism studies of antifungals by CZE. 2507. Figure 4 shows the electropherograms obtained when an incubated verapamil sample after its cleanup with the off line SPE method described was injected in the CZE system using different running electrolytes at pHs about 2.0. According to previous results [25], the best pH to perform the separation of several antifungals was between pH 2 and 2.5. At this acidic pH, the analytes must be fully ionized, and are separable by CZE with the electroosmotic flow virtually eliminated [28]. It can be seen that the nature of the running electrolyte, formic acid or phosphate buffer, has a major influence on the separation among unmetabolized verapamil and its metabolites. In fact, it was impossible to resolve all components with formic acid (pH 2.1), there was overlapping between unmetabolized verapamil and one of its main metabolites (M3, see Fig. 4a). On the other hand, the resolution between peaks increased when increasing the concentration of the phosphate buffer, but migration times and current intensities were also high, then limiting its concentration at a maximum of 0.05 M. The use of methanol or acetonitrile as additives in the running electrolyte (e.g., 0.025 M phosphate buffer) was also studied. Figure 4 shows that the use of 20% acetonitrile decreased significantly the resolution between the two main peaks (unmetabolized verapamil and its metabolite M3, see Fig. 4d), whereas 20% methanol increased the analysis time but it did not produce an improvement on the separation (see Fig. 4b and 4e). From these results, it can be stated that the best. 3.2 Optimization of the CZE method The optimization of the separation conditions of all components originated after incubation with human liver microsomes (unmetabolized parent drug and its metabolites) was achieved in two phases, using for it the samples of verapamil and clotrimazole because only these compounds suffered an important metabolism leading to a complex mixture of components. First, the composition of the running electrolyte (nature and concentration) was varied and the effect of the addition of organic solvents was studied. Second, the effect of the injection volume was investigated in order to obtain the best sensitivity.. Figure 4. Electropherograms of an incubated verapamil sample (incubation time, 30 min) after cleanup with the off-line SPE showing the effect of the composition of the running electrolyte on the CZE separation: (a) 0.3 M formic acid (pH 2.1); (b) 0.025 M phosphate buffer (pH 2.2); (c) 0.05 M phosphate buffer (pH 2.2); (d) 0.025 M phosphate buffer (pH 2.2)/acetonitrile (80:20 v/v); (e) 0.025 M phosphate buffer (pH 2.2)/methanol (80:20 v/v). M# metabolites; V, unmetabolized verapamil. Other conditions as in Fig. 3..
(6) 2508. A. L. Crego et al.. Electrophoresis 2001, 22, 2503–2511. Figure 5. Electropherograms of an incubated clotrimazole sample (incubation time, 30 min) after cleanup with the off-line SPE showing the effect of the composition of the running electrolyte on the CZE separation: (a) 0.3 M formic acid (pH 2.1); (b) 0.05 M phosphate buffer (pH 2.2). Other experimental conditions as in Fig. 3.. Figure 7. Electropherograms of an incubated clotrimazole sample (incubation time, 30 min) showing the effect of the injection time by hydrodynamic method (applied pressure, 0.5 psi). Running electrolyte, 0.05 M phosphate buffer (pH 2.2). Other experimental conditions as in Fig. 3.. separation for the mixture studied is obtained using a 0.05 phosphate running buffer (pH 2.2). On the other hand, although using a 0.3 M running electrolyte in formic acid (pH 2.1), it was possible to resolve the unmetabolized clotrimazole and its main metabolites derived from microsomal incubation; the employment of 0.05 M phosphate running buffer (pH 2.2) was chosen due to its better sensitivity (see Fig. 5). M. With regards to the effect of injected volume or injected plug length, which is proportional to injection time by hydrodynamic injection, values longer than 3 s caused a significant loss in resolution when verapamil samples were analyzed (Fig. 6). However, injection time up to 10 s did not cause a significant loss in resolution obtained for clotrimazole samples due to the excellent separation obtained for these samples (Fig. 7). Figure 6. Electropherograms of an incubated verapamil sample (incubation time, 30 min) showing the effect of the injection time by hydrodynamic method (applied pressure, 0.5 psi). Running electrolyte, 0.05 M phosphate buffer (pH 2.2). Other experimental conditions as in Fig. 3.. In conclusion, 0.05 M phosphate buffer (pH 2.2) is the best choice in order to obtain separations with better selectivity and sensitivity than with 0.3 M formic acid (pH 2.1). With regard to the injection, times longer than 3 s should be avoided unless an increase in sensitivity is needed and.
(7) Electrophoresis 2001, 22, 2503–2511. Metabolism studies of antifungals by CZE. 2509. Table 1. Analytical characteristics of the CZE method using 0.05 M phosphate running buffer (pH 2.2). Analysis time (min) Repeatabilitya) RSD (MT)c) RSD (PA)d) b) Reproducibility RSD (MT)c) RSD (PA)d) LOD (mg/mL) Robustnesse). Ketoconazole Clotrimazole Verapamil. Itraconazole Fluconazole Voriconazole. 2.3 0.2 2.1 0.7 3.3 1.0 1.3. 4.3 0.2 2.6 0.4 4.3 1.8 1.8. 2.7 0.2 1.4 0.4 2.1 0.5 2.1. 3.3 0.1 2.6 0.4 3.4 0.9 1.5. 8.2 0.2 4.4 0.5 5.3 3.0 2.3. 9.4 0.3 4.8 0.5 5.7 3.0 2.4. a) Repeatability was assessed on six consecutive injections (n=6) b) Reproducibility on five different days (each injection by duplicate) (n=10) c) MT, migration times d) PA, peak areas e) Robustness was measured as the RSD (n=5) for interday calibration slopes using peak areas Experimental conditions: capillary, 27 m (20 cm effective length) 650 mm ID; applied voltage, 15 kV; hydrodynamic injection, 0.5 psi for 3 s; UV-detection, 198 nm; temperature, 307C. the loss of resolution does not make impossible to carry out the separation. Under the above conditions it was possible to analyze in vitro microsomal incubations of other antifungal compounds, such as ketoconazole, itraconazole, fluconazole, and voriconazole. These antifungals are very stable with the microsomal incubation procedure described (their metabolic stabilities are shown in Section 3.3), and only the majority peak due to the unmetabolized parent drug was detected (Fig. 8). After optimization of the separation conditions, some analytical characteristics of the developed CZE method were investigated using standard solutions with the six tested compounds in methanol/water (50:50 v/v). The parameters involved were analysis time, precision (repeatability and reproducibility), linearity, limits of detection (LODs), and robustness (see Table 1). Precision was assessed for the same standard solution (10 mg/mL of each compound) on six consecutive injections, repeatability, or on five different days (each injection by duplicate), reproducibility. Performance (measured as RSD) obtained for the developed method in terms of repeatability (n=6) was from 0.1 to 0.3% for migration times, and from 1.4 to 4.8% for peak areas and reproducibility (n=10) was from 0.4 to 0.7% for migration times, and from 2.1 to 5.7% for peak areas. The calibration plots using peak areas of at least five standard solutions (each solution was injected twice) showed linear ranges for concentrations from 1.0 or 3.0 to 30 mg/mL with squared correlation coefficients (R2) bigger than 0.997. The values of the LODs were calculated from the calibration plots established with the peak heights: LOD is the concentration which equals the signal-to-noise ratio of 3. The noise was estimated as the largest deviation of detector signal from the baseline measured in a section of about 5 min in. the absence of analyte (1.5610-4 AU at 198 nm with 0.05 M phosphate running buffer). The lowest LOD was obtained for clotrimazole (0.5 mg/mL) and the highest value for fluconazole and voriconazole (3.0 mg/mL). The small LOD obtained for clotrimazole was a consequence of its strong UV-absorbing chromophore, while the high values obtained for fluconazole and voriconazole were a consequence of their weak UV-absorbing chromophore. Finally, the robustness of the method was measured as the RSD for interday calibration slopes using new phosphate running buffer every day (n = 5). Values from 1.3 to 2.4% were obtained using peak areas to establish the calibration plots.. Figure 8. Electropherograms of incubated antifungal samples (incubation time, 60 min) after cleanup with offline SPE. Running electrolyte, 0.05 M phosphate buffer (pH 2.2). Other experimental conditions as in Fig. 3..
(8) 2510. A. L. Crego et al.. Electrophoresis 2001, 22, 2503–2511. 3.3 Application of the SPE/CZE method to in vitro analysis of antifungals As an illustration of the applicability of the off-line SPE/ CZE method described for the analysis of drugs in vitro samples, reconstituted extracts of verapamil and five antifungals after incubation with human liver microsomes were analyzed together with the extracts of their corresponding control samples without b-NADPH (i.e., drug without metabolism). The individual drug concentration in the incubation samples was 10 mM (i.e., ranged from 3.0 to 7.1 mg/mL). Table 2 shows that an acceptable reproducibility in the “turnover” values (% of unmetabolized parent drug) for the different compounds studied after metabolism in microsomal incubations was obtained. The small turnover of verapamil shows the performance of the metabolizing system, in which only clotrimazole suffers an important metabolism, whereas the other antifungals are very stable in the microsomal incubation described. These results confirm the CE features for monitoring drug metabolic stability.. Table 2. Reproducibility of the “turnovers” for several antifungals and verapamil as reaction control in microsomal incubations Compounds. Incubation time 30 min. Verapamil Clotrimazole Ketocanozole Itraconazole Fluconazole Voriconazole. 35.1 (4.1 %) 50.6 (8.4 %) 96.2 (3.0 %) 96.4 (2.7 %) 100.4 (3.6 %) 98.3 (4.6 %). 60 min 19.2 (6.6 %) 32.5 (6.8 %) 91.5 (3.4 %) 92.6 (4.0 %) 99.1 (4.5 %) 97.4 (4.2 %). Average values for n = 5 with their relative standard deviation (RSD) in parentheses. Experimental conditions as in Table 1.. 4 Concluding remarks We have developed a novel off-line SPE/CZE method for the separation of antifungals and their metabolites in human liver microsomes. With the SPE method, high and consistent recoveries were obtained using a 30 mg OasisHLB sorbent. Enrichment was achieved by reconstituting the final SPE eluates to a small volume. For the CZE separation, good separation and good peak shapes were obtained with a simple running electrolyte using a fused-silica capillary. Separation conditions based on the use of 0.05 M phosphate running buffer (pH 2.2) have been developed that enable analysis by CZE of the com-. ponents originated by each tested drug after incubation with human liver microsomes (unmetabolized parent drug and its metabolites). Good performance was obtained in terms of precision, linearity, limits of detection, and robustness data suggesting the broad applicability of the method to the determination of drug components in pharmaceuticals, and also to the detection of basic drugs in in vitro samples. Finally, we conclude that the proposed method is rapid, specific, and sensitive enough to be used in monitoring antifungals to study their stability or in analysis in vitro in general. Dr. Crego thanks GlaxoWellcome for his stay at its R&D Center in Madrid (Spain) within a collaborative work with the Department of Analytical Chemistry of the University of Alcalá. Received December 6, 2000. 5 References [1] Saag, M. S., Dismukes, W. E., Antimicrob. Agents Chemother. 1988, 32, 1–8. [2] Bennett, J. E., in: Goodman, A., Gilman, A., Rall, T. W., Nies, A. S., Taylor, P. (Eds.), Goodman and Gilman’s The Pharmacological Basis of Therapeutics, Pergamon Press, New York 1990, pp. 1165–1181. [3] Daneshmend, T. K., Warnock, D. W., Clin. Pharmacokinet. 1983, 8, 17–42. [4] Joly, V., Bolard, J., Yeni, P., Antimicrob. Agents Chemother. 1992, 36, 1799–1804. [5] Terrel, C. L., Hughes, C. S., Mayo. Clin Proc. 1992, 67, 69– 91. [6] Como, J. A., Dismukes, W. E., New Engl. J. Med . 1994, 330, 263–272. [7] Kedor-Hackmann, E. R. M., Nery, M. M. F., Santoro, M. I. R. M., Anal. Lett. 1994, 27, 363–376. [8] Yuen, K. H., Peh, K. K., J. Chromatogr. B 1998, 715, 436– 440. [9] Valenta, C., Pharmazie 1992, 47, 641–642. [10] Allenmark, S., Edebo, A., Lindgren, K., J. Chromatogr. 1990, 532, 203–206. [11] Poirier, J. M., Lebot, M., Descamps, P., Levy, M., Cheymol, G., Ther. Drug Monit. 1994, 16, 596–601. [12] Rifai, N., Sakamoto, M., Platt, O., Brugnara, C., Ther. Drug Monit. 1995, 17, 522–525. [13] Compas, D., Touw, D. J., de Goede, P. N. F. C., J. Chromatogr. B 1996, 687, 453–456. [14] Hosotsubo, K. K., Hosotsubo, H., Nishijima, M. K., Okada, T., Taenaka, N., Yoshiya, I., J. Chromatogr. 1990, 529, 223– 228. [15] Inagaki, K., Takagi, J., Lor, E., Okamoto, M. P., Gill, M. A., Ther. Drug Monit. 1992, 14, 306–311. [16] Flores-Murrieta, F. J., Granados-Soto, V., Hong, E., J. Liq. Chromatogr. 1994, 17, 3803–3811. [17] Koks, C. H. W., Rosing, H., Meenhorst, P. L., Bult, A., Beijnen, J. H., J. Chromatogr. B 1995, 663, 345–351. [18] Ferretti, R., Gallinella, B., La Torre, F., Zanitti, L., Chromatographia 1998, 47, 649–654..
(9) Electrophoresis 2001, 22, 2503–2511 [19] Owens, P. K., Fell, A. F., Coleman, M. W., Berridge, J. C., Enantiomer 1999 4, 79–90. [20] Pratt W. B., Taylor P., Principles of Drug Action. The Basis of Pharmacology, 3rd ed., Churchill Livingstone, New York 1990, p. 836. [21] Zhang, C. X., Von Heeren, F., Thormann, W., Anal. Chem. 1995, 67, 2070–2077. [22] Von Heeren, F., Tanner, R., Theurillat, R., Thormann, W., J. Chromatogr. A 1996, 745, 165–172. [23] Arranz, A., Echevarria, C., Moreda, J. M., Cid, A., J. Chromatogr. A 2000, 871, 399–402.. Metabolism studies of antifungals by CZE. 2511. [24] Eichelbaum, M., Ende, M., Remberg, G., Schomerus, M., Dengler, H. J., Drug. Metab. Dispos. 1979, 7, 145–148. [25] Crego, A. L., Marina M. L., Lavandera J. L., J. Chromatogr. A 2001, 917, 337–345. [26] Moring, S. E., Colburn, J. C., Grossman, P. D., Lauer, H. H., LC-GC 1990, 8, 34–46. [27] Cheng, Y.-F., Phillips, D. J., Neue, U. D., Chromatographia 1997, 44, 187–190. [28] Schwer, C., Kenndler, E., Anal. Chem. 1991, 63, 1801–1807..
(10)
Figure


+3


Documento similar
Only a few of the studies made of the extraction of compounds from river water samples were developed in the on-line mode because the mobile phase used was the same as
The speciation of inorganic lead and organolead compounds in waters can be implemented by using a solid phase extraction unit in which the analytes were sorbed on C 60 fullerene
Different methods for removing interference by humic substances in the analysis of polar pollutants have been compared in the analysis of environmental water by solid-phase
Phase 2: SDSS pipeline for SFH and ex-situ population extraction Phase 3: Ex-situ population maps of resolved galaxies using MUSE. Schaye
We study the optical properties of double-layer graphene for linearly polarized evanescent modes and discuss the in-phase and out-of-phase plasmon modes for both, longitudinal
Three sample treatment methods, based on QuEChERS, solid-phase extraction (SPE) and solid-phase microextraction (SPME), were compared and evaluated in order to obtain the
The authors developed a simple and rapid method based on liquid chromatography in tandem with mass spectrometry (LC/MS-MS) with solid phase extraction (SPE)
2 EM simulation (dashed lines) and equivalent circuit (solid lines) results for the microstrip line loaded with an OISRR: (a) mag- nitude and (b) phase.. The first one is due to
