Interference of HTLV 1 Tax Protein with Cell Polarity Regulators : Defining the Subcellular Localization of the Tax DLG1 Interaction
19
0
0
Texto completo
(2) Viruses 2017, 9, 355. 2 of 19. intracellular secretory-like vesicles in HTLV-1 infected cells [15]. The viral protein can be released and the secreted form has been demonstrated to behave like an extracellular cytokine, possibly involved in pathogenic processes [16]. Most activities of Tax are based on interactions with cellular partners; Tax has the ability to interact with different proteins like transcription regulators and factors involved in cell signaling, including the PDZ (PSD-95/Discs Large/Z0-1) domain–containing proteins. PDZ proteins localize principally at the cell borders where they form complexes that regulate signal transduction and cell polarity, with potential oncosuppressor functions [17,18]. So far, several PDZ targets of Tax, such as the human homologue of the Drosophila discs large protein (DLG1), human Scribble (hScrib), and membrane-associated guanylate kinase with inverted orientation-1 and -3 (MAGI-1 and -3), have been identified [19–22]. In all of these cases, the interaction is mediated by a conserved PDZ binding motif (PBM, X-[T/S]-X-V) located at the C-terminal region of Tax [23,24]. It has been reported that Tax PBM may participate in the persistence of HTLV-1 infection and stimulation of both cell proliferation and genomic instability [7,25]. Interestingly, the Tax protein derived from HTLV-2, a closely related retrovirus which causes neither leukemia nor lymphoma in infected people, lacks the PBM and, therefore, the ability to interact with PDZ proteins [7,25,26]. This fact highlights the importance of the binding of Tax to PDZ domain-containing proteins in cellular transformation and pathogenesis during HTLV-1 infections. One of the most-characterized PDZ targets of Tax is DLG1, a member of the Scrib polarity complex. DLG1 functions related to the control of cell polarity were first described in Drosophila, where DLG1 also showed to be a regulator of cell proliferation. Additionally, functional loss of DLG1 has been associated with neoplastic transformation [27]. In mammalian epithelial cells, DLG1 participates in the formation of adherens junctions where it has a role in regulating cell polarity and proliferation [28,29]. In T cells, the target cells of HTLV-1, DLG1 associates with the cytoskeleton, facilitates cell polarization, participates in the immune synapses, and controls cell morphology and migration [30,31]. Furthermore, DLG1 overexpression induces cell cycle arrest, which can be overcome by the expression of Tax, suggesting that the binding of Tax may subvert the negative growth control of DLG1 by a mechanism not completely understood [22]. The Tax-DLG1 interaction results in the misdistribution of DLG1 from a detergent soluble to a detergent insoluble fraction [32]. This effect has also been observed for other Tax PDZ targets like hScrib and MAGI-1 and 3, showing a co-localization pattern in the cytoplasm that resembles vesicular aggregates [19–21]. Interestingly, it is unknown whether the targeting of DLG1 by Tax takes place solely to abolish the tumor suppressor functions of DLG1, or alternatively, whether or not it could represent a viral strategy to stimulate potential oncogenic activity of DLG1 that may facilitate viral replication or cell transformation. In line with this, the PBM-dependent binding of Human adenovirus E4-ORF1 to DLG1 results in the promotion of DLG1 oncogenic functions that contribute to E4-ORF1-mediated phosphatidylinositol-4,5-bisphosphate 3-kinase signaling activation, uncovering unexplored potential tumor activities of DLG1 [33,34]. Therefore, although the Tax-DLG1 interaction has been investigated using different experimental models and approaches, key questions remain to be answered, especially, where is the precise cell localization of this interaction? In order to gain more insight into this issue and the role of PDZ polarity proteins in HTLV-1 cell transformation, in this study we investigated the relationship between Tax and DLG1 more profoundly. By fluorescence resonance energy transfer (FRET) methodology, we were able to show, for the first time, the direct binding of Tax to DLG1 within the cell. We analyzed the subcellular localization of Tax-DLG1 complexes induced by the viral protein in a PBM-dependent manner in depth [32]. We also studied different cellular structures according to previously reported biological features for both proteins, demonstrating that the reported aggregates distribute into the Golgi apparatus region in spatial association with the microtubule-organizing center (MTOC)..
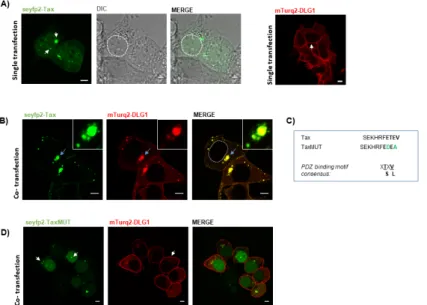
(3) Viruses 2017, 9, 355 Viruses 2017, 9, 355. 3 of 19 3 of 19. 2. Material and Methods 2. Material and Methods 2.1. Plasmids 2.1. Plasmids The sequence encoding the HTLV-1 Tax oncoprotein was cloned into the pmTurquoise2 The sequence encoding thethe HTLV-1 Tax oncoprotein cloned into theprotein, pmTurquoise2 (expression plasmid encoding enhanced version ofwas cyan fluorescent named(expression hereafter plasmid encoding the enhanced version of cyan fluorescent protein, named hereafter pmTurq2) and pmTurq2) and pseyfp2 (expression plasmid encoding the super enhanced yellow fluorescent protein pseyfp2 (expression plasmid encoding the super enhanced yellow fluorescent protein 2). pGW-HA-Tax 2). pGW-HA-Tax (HA, human influenza hemagglutinin epitope) was used to express a version of (HA, human to express a version of introduced Tax proteininto not Tax protein notinfluenza fused to ahemagglutinin fluorescent tag.epitope) Specificwas pointused mutations (Figure 1C) were fused to a fluorescent tag. Specific point mutations (Figure 1C) were introduced into the PBM of the PBM of the Tax protein by PCR-directed mutagenesis. The coding sequence of rat DLG1 was the Taxinto protein by PCR-directed mutagenesis. coding sequence of ratplasmids. DLG1 was cloned into cloned the pmTurq2 and pegfp-C1 (enhancedThe green fluorescent protein) The pcDNAthe pmTurq2 and pegfp-C1 green fluorescent protein) The pcDNA-HA-DLG1 HA-DLG1 expression vector(enhanced was previously described [35]. The plasmids. pmTurq2 and pseyfp2 plasmids expression vectorprovided was previously [35]. The pmTurq2 andofpseyfp2 plasmids were generously were generously by Dr.described Joachim Goedhart (University Amsterdam, Netherlands) [36]. provided by Dr. Joachimgreen Goedhart (University of Amsterdam, Netherlands) [36].were The plasmids encoding The plasmids encoding fluorescent protein (gfp)-RAB5 and gfp-RAB7 kindly provided green fluorescent protein (gfp)-RAB5 and gfp-RAB7 wereDC, kindly provided D Stahl by Dr. Phillip D Stahl (University of Washington, Seattle, USA) [37] andby byDr. Dr.Phillip Bo vanDeurs (University of Washington, Seattle, WA, USA) [37] and by Dr. Bo vanDeurs (University of Copenhagen, (University of Copenhagen, Copenhagen, Denmark) [38], respectively. Finally, the plasmid encoding Copenhagen, Denmark) [38], respectively. Finally, the plasmid encoding rfp (reddefluorescence rfp (red fluorescence protein)-LC3 was a gift from Dr. María Isabel Colombo (Instituto Histología was Mario a gift H. from Dr. María Isabel Colomboand (Instituto de Histología y Embriología yprotein)-LC3 Embriología “Dr. Burgos”, Mendoza, Argentina) its construction is described in Fader “Dr. et al. Mario [39]. H. Burgos”, Mendoza, Argentina) and its construction is described in Fader et al. [39].. Figure Figure1.1.Simultaneous Simultaneousoverexpression overexpressionofofdiscs discslarge largehomolog homolog11(DLG1) (DLG1)and andhuman humanTTcell cellleukemia leukemia virus (HTLV)-1 Tax (Tax) proteins generates a well-defined co-localization pattern. (A) Subcellular virus (HTLV)-1 Tax (Tax) proteins generates a well-defined co-localization pattern. (A) Subcellular distribution distributionofofDLG1 DLG1and andTax Tax proteins. proteins. Human HumanEmbryonic EmbryonicKidney Kidney293 293(HEK293) (HEK293)cells cellstransiently transiently transfected with pseyfp2-Tax (green, left panel) or pmTurq2 -DLG1 (red, right panel) transfected with pseyfp2-Tax (green, left panel) or pmTurq2 -DLG1 (red, right panel)were werefixed fixedand and protein proteinexpression expressionwas wasexamined examinedby byconfocal confocalmicroscopy. microscopy.The Thedifferential differentialinterference interferencecontrast contrast(DIC) (DIC) image imageisisshown shownfor forbetter betterinterpretation interpretationofofnuclear nuclearlocalization; localization;(B) (B)Co-localization Co-localizationanalysis analysisofofDLG1 DLG1 and Tax. The pseyfp2-Tax and pmTurq2-DLG1 plasmids were simultaneously transfected into and Tax. The pseyfp2-Tax and pmTurq2-DLG1 plasmids were simultaneously transfected into HEK293 HEK293 cells and DLG1-Tax co-localization was assessed. The dashed circle delineates the nuclear cells and DLG1-Tax co-localization was assessed. The dashed circle delineates the nuclear region; region; (C) C-terminal sequence of Tax. PBM the Tax is highlighted with bold letters. (C) C-terminal sequence of Tax. The PBMThe of the Taxofprotein is protein highlighted with bold letters. Amino acid Amino acid substitutions (green letters) into introduced PBMwith are respect shown to with to the substitutions (green letters) introduced the Tax into PBMthe areTax shown therespect wild type Tax wild type Tax sequence. The consensus PBM sequence is also shown; (D) Co-localization analysis of sequence. The consensus PBM sequence is also shown; (D) Co-localization analysis of DLG1 and Tax DLG1 and Tax C-terminal mutant derivative (TaxMUT). The pseyfp2-TaxMUT (green) was C-terminal mutant derivative (TaxMUT). The pseyfp2-TaxMUT (green) was transfected in HEK293 cells transfected in HEK293 cells along with(red). the The pmTurq2-DLG1 plasmid The co-localization along with the pmTurq2-DLG1 plasmid co-localization between(red). the proteins was assessed between the microscopy. proteins wasInassessed bywhite confocal microscopy. In (A,D), the white arrows the by confocal (A,D), the arrows show the particular expression of each show protein as particular described the text.the In co-localization (B), the light blue arrows indicateinthe describedexpression in the text.ofIneach (B), protein the lightasblue arrowsinindicate region amplified the co-localization region indicate amplified in theregions. inset. Dashed circles indicate nuclear inset. Dashed circles nuclear All scale bars represent 5 µm. regions. All scale bars represent 5 µm..
(4) Viruses 2017, 9, 355. 4 of 19. 2.2. Antibodies The antibodies used were mouse monoclonal anti-DLG1 (2D11), mouse anti-transferrin receptor (TR) (3B82A1) (Santa Cruz Biotechnology, Santa Cruz, CA, USA), mouse monoclonal anti-gfp (11E5) (ThermoFisher Scientific, Rockford, IL, USA), rabbit polyclonal anti-PAR3 (H70) (Millipore, Temecula, CA, USA), mouse monoclonal anti-HA (12CA5), mouse monoclonal anti-γ tubulin (T6557) (Sigma Aldrich, St. Louis, MO, USA), and rabbit monoclonal anti-GM130 (EP892Y) (Abcam, Cambridge, UK). 2.3. Cell Culture and Transfections HEK293 epithelial cells (Human Embryonic Kidney 293, ATCC #CRL-1573) were cultured in Dulbecco’s modified Eagle’s medium (DMEM) (Gibco, Grand Island, New York, NY, USA) and Jurkat cells (human T cell leukaemia, ATCC® TIB152) in RPMI1640 medium (Gibco, Grand Island, New York, NY, USA). Both media were supplemented with 10% (v/v) fetal bovine serum (Natocor, Argentina). All cultures were maintained at 37 ◦ C, in 5% CO2 atmosphere. The calcium phosphate method was used to transfect HEK293 cells (250,000 cells/35 mm diameter dish) as previously described [35] whereas Jurkat cells (106 cells) were transfected with the Dreamfect Gold reagent (OZ bioscience, Marseille, France) following the manufacturer’s instructions. In general, 2 µg of DLG1 and 1 µg of Tax coding plasmids were used for the different experiments. 2.4. Cell Protein Extracts and Western Blot At 24 h post transfection, the cells were harvested in E1A lysis buffer (4-(2-hydroxyethyl)1-piperazineethanesulfonic acid (HEPES) 50 mM, NaCl 250 mM, MgCl2 1 mM, NP-40 0.1%) containing 1% Halt Protease inhibitor cocktail (Thermo Scientific Pierce, Rockford, IL, USA). The extract was centrifuged at high speed and the supernatant was used as the detergent soluble fraction. The remaining pellet representing the insoluble fraction was directly treated with SDS-sample buffer (125 mM Tris–HCl (pH 6.8), 2% SDS, 20% glycerol, 0.01% bromophenol blue, and 10% b-mercaptoethanol). For total extracts the cells were suspended directly in sample buffer. These samples were used in Western blot analysis as described previously [35]. Equal amounts of proteins were separated by SDS-PAGE and transferred onto nitrocellulose membranes. Specific protein levels were determined by immunoblot analysis using the appropriate primary antibodies, as indicated in the text. Blots were developed with the SuperSignal West Pico Chemiluminescent Substrate reagent (Thermo Scientific Pierce, Rockford, IL, USA). 2.5. Immunofluorescence HEK293 cells were grown on glass coverslips (250,000 cells/35 mm diameter dish), transfected or not, and after 24 h fixed using 3.7% paraformaldehyde in phosphate-buffered saline (PBS) for 15 min at room temperature. Jurkat cells (106 ) were seeded onto polylysine coated slides and fixed as described above. In both cases, after two washes with PBS, the cells were permeabilized with TritonX-100 0.1% in PBS, washed again, and incubated overnight with primary antibodies. Endogenous DLG1, GM130, and γ-Tubulin were visualized using anti-DLG1 (2D11 clone, Santa Cruz Biotechnologies, USA), anti-GM130 (EP892Y, Abcam, UK), and anti-γ-Tubulin (GTU-88, Sigma Aldrich, USA), respectively. HA-DLG1 was detected using an anti-HA (12CA5 clone, Sigma Aldrich, USA). Secondary antibodies used were Alexa 488-conjugated goat anti-rabbit IgG (Molecular Probes, Grand Island, NY, USA) and Cy3 conjugated anti-mouse IgG (Chemicon International, Temecula, CA, USA). 2.6. Confocal Microscopy Fluorescence detection was carried out using a Carl Zeiss LSM 880 microscope equipped with a spectral detector and a 63× NA 1.4 plan apochromat oil immersion objective (Zeiss, Oberkochen, Germany). Enhanced green fluorescent protein and Alexa 488 fluorophores were excited by a 488 nm argon laser line and its emission was detected in a range of 490–543 nm. The Helium laser line of 546 nm.
(5) Viruses 2017, 9, 355. 5 of 19. and a detection range of 549–626 nm were used to detect Cy3 fluorophore emission. The mTurq2 and seyfp2 fluorescent proteins were excited by 458 and 514 nm argon laser lines, respectively. A detection range of 456–510 nm for mTurq2 and 516–561 nm for seyfp2 were used. Cross-excitation of all these fluorophores was negligible and cross-emission was eradicated by using the multi-track mode. In these experiments, although the fluorescent proteins fused to Tax or DLG1 changed and had different spectral properties among the experiments, in all cases the Tax expression was shown in green and the DLG1 expression in red. The same strategy was followed for the organelle markers, whose expression was shown in blue. The co-localization among proteins was assessed by the superposition of images obtained in the same confocal sections. 2.7. Acceptor Photobleaching FRET Microscopy FRET was evaluated by the loss of quenching of mTurq2 (donor) after seyfp2 (acceptor) photobleaching. Photobleaching was carried out in a region of interest (ROI) by scanning 100 times with the 514 laser line at a high potency. To calculate FRET efficiency (FRET Ef ) between mTurq2and seyfp2-tagged proteins, at first the mean fluorescence intensity (Id) of mTurq2 was assessed in each ROI before and after photobleaching. Then, the formula previously described by Karpova et al., was used: FRET Ef = (Id post-Id pre) × 100/Id post [40]. 2.8. Statistical Analysis The normal distribution of FRET efficiency values was tested by a Shaphiro-Wilk test [41]. Subsequently, statistical significance of the differences was assessed performing a One Tailed Student´s t-test. A p-value of less than 0.05 was considered significant. 3. Results 3.1. Tax-DLG1 Interaction Specifically Alters the Subcellular Localization of Both Proteins Previous studies have described the Tax-DLG1 association in terms of inactivation of the DLG1 oncosuppressor functions, thereby promoting Tax-mediated cell transformation [42]. However, no attention has been given to the effects that DLG1 could have on Tax expression and functions as well as to the particular localization of the Tax-DLG1 aggregates. These subjects might be relevant to discovering new functions of this association during the HTLV-1 infection. In order to investigate this interesting issue in detail, we used vectors for the expression of both Tax and DLG1 fused to fluorescent tagging proteins. Some reports have already followed this strategy and have shown that fusion proteins have, indeed, the same subcellular distribution as the non-tagged versions [14]. Here, we employed the novel fluorescent proteins mTurq2 and seyfp2 (see Experimental Procedures) as fluorophores since their spectral properties make them suitable for localization analysis and other microscopy techniques such as FRET. The pseyfp2-Tax and pmTurq2-DLG1 vectors were separately transfected into HEK293 cells and the protein distribution was examined. HEK293 cells were selected for the study since they proved to be useful in Tax-PDZ interaction studies and fluorescence microscopy [16,32]. As seen in Figure 1A, seyfp2-Tax (green) was localized mainly in the nucleus and in the cytoplasm with a specked archetype, as previously reported [16,43], whereas, mTurq2-DLG1 (red) expression was preferentially located at the cell borders and in the cytoplasm, as described before [29]. Next, HEK293 cells were co-transfected with these two vectors and a drastic change in the localization of both proteins was observed. Indeed, the loss of Tax from the nucleus and the reduction of DLG1 expression at the cell borders were remarkable. More importantly, it was possible to appreciate a striking vesicle-like co-localization between these proteins in structures close to the nucleus and, to a lesser extent, to the cell borders (Figure 1B). The same expression pattern was obtained when HEK293 cells were co-transfected with mTurq2-DLG1 and pGW-HA-Tax (coding for a Tax protein not fused to a fluorescence protein) (Figure S1). This suggests the results are not influenced by the presence of the.
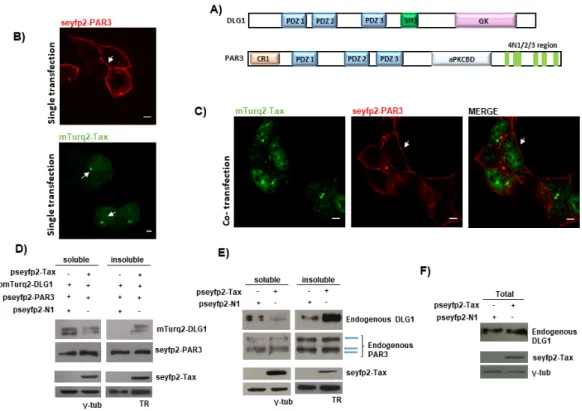
(6) Viruses 2017, 9, 355. 6 of 19. fluorescent protein tags, highlighting the good performance of the fluorescent vectors and encouraging us to make use of them for the rest of our studies. To test the PDZ domain-dependence, we repeated the experiment, by using a Tax C-terminal mutant derivative (TaxMUT) in which the PBM sequence ETEV had been mutated to EDEA (Figure 1C) since changes in these amino acids are detrimental for Tax PBM functions [32]. In this case, seyfp2-TaxMUT accumulated in the nucleus and was barely expressed in the cytoplasm (Figure 1D) reminiscent of the single transfection experiment. At the same time, neither changes in mTurq2-DLG1 subcellular distribution nor co-localization of both proteins in defined structures were observed (Figure 1D). In order to elucidate whether the vesicle-like co-localization was specific or artificial, considering the overexpression of the PDZ protein, we evaluated the distribution of Partitioning defective 3 (PAR3), another polarity regulator, when overexpressed in the presence of Tax. This protein represented an adequate control because it bears three PDZ domains and the phenotype under study was shown to be PDZ-dependent Figure 2A). Moreover, detection of binding of PAR3 to Tax was not possible through biochemical techniques such as Glutathione S-transferase (GST)-pull down or co-immunoprecipitation in HEK293 cells (data not shown). For this experiment, we first constructed a vector for the expression of PAR3 fused to seyfp2 (pseyfp2-PAR3). As observed in Figure 2B, seyfp2-PAR3 was localized at the cell borders in agreement with previously reported studies [44]. However, the presence of mTurq2-Tax (Figure 2C) did not evidently change the localization of seyfp2-PAR3 (compare Figure 2B,C) and, moreover, mTurq2-Tax also maintained its nuclear distribution (comparison of mTurq2-Tax expression in single versus co-transfection experiments in Figure 2). Interestingly, despite the overexpression of PAR3, the dots in the cytoplasm indicating co-localization of cellular and viral proteins were not observed. These data suggest that the Tax-DLG1 structures shown before are due to specific binding of Tax to DLG1 and not to overexpression of a PDZ protein. To confirm and extend these findings, we evaluated the expression of ectopic DLG1 and PAR3 proteins in the presence of Tax in extracts from different cell pools, since it has been demonstrated that Tax is able to promote a re-distribution of DLG1 from detergent soluble to insoluble subcellular fractions [32]. To do this, the pseyfp2-Tax together with pmTurq2-DLG1 or pseyfp2-PAR3 expressing vectors were transfected into HEK293 cells and protein extracts were separated in detergent soluble or insoluble pools. The levels of ectopic DLG1 and PAR3 protein expression in each fraction were ascertained by Western blotting using an anti-gfp antibody which recognizes the tagging of fluorescent proteins. The results in Figure 2D show that DLG1 levels were clearly increased in the insoluble fraction while reduced in the respective soluble portion in Tax expressing cells when compared with cells transfected with the empty vector (psyfp1-N1, control) (Figure 2D). However, no changes in the distribution of PAR3 were observed in the presence of the viral protein (Figure 2D), suggesting that PAR3 is not a PDZ target of Tax, in agreement with our protein binding experiments (data not shown). The same experiment was carried out to evaluate potential changes in the subcellular distribution of the endogenous PDZ proteins in the presence of Tax and analogous results were obtained (Figure 2E). Importantly, the total levels of DLG1 are not modified in the presence of Tax (Figure 2F), supporting the fact that the viral protein induces a re-localization of DLG1 to the insoluble fraction rather than an increase of DLG1 protein abundance. Taken together, these findings confirm the specific effects of Tax over endogenous or over-expressed DLG1 protein, and clearly show that Tax-DLG1 creates a very well-defined and specific co-localization pattern where the association of both proteins really affects the cell distribution of not only DLG1 but also Tax..
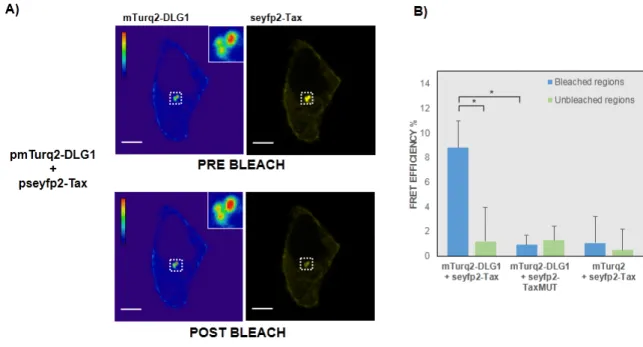
(7) Viruses 2017, 9, 355 Viruses 2017, 9, 355. 7 of 19 7 of 19. Figure 2.2.The TheDLG1-Tax DLG1-Tax co-localization pattern not from arisean from an overabundance of PDZ Figure co-localization pattern doesdoes not arise overabundance of PDZ domains domains inside the cell. (A) Schematic representation of DLG1 and PAR3 proteins, showing that both inside the cell. (A) Schematic representation of DLG1 and PAR3 proteins, showing that both proteins proteins bear three PDZ domains. SH3, interaction Src homology GK, homologous the bear three PDZ domains. SH3, interaction domaindomain Src homology 3; GK, 3; homologous to the to yeast yeast guanylate kinase enzyme; CR1, oligomerization domain; aPKCBD, atypical protein kinase C guanylate kinase enzyme; CR1, oligomerization domain; aPKCBD, atypical protein kinase C binding binding domain; (B) Subcellular distribution of the PAR3 PDZ-containing protein and Tax in domain; (B) Subcellular distribution of the PAR3 PDZ-containing protein and Tax in epithelial cells. epithelial A plasmid seyfp2 tagged PAR3 mTurq2 tagged Tax transfected in A plasmidcells. encoding seyfp2encoding tagged PAR3 or mTurq2 taggedorTax was transfected inwas HEK293 cells and HEK293 cells was and analyzed its expression was analyzed by (red); confocal (red); (C) Simultaneous its expression by confocal microscopy (C) microscopy Simultaneous overexpression of Tax overexpression of Tax and PAR3 proteins in epithelial cells. The plasmids encoding seyfp2-PAR3 and PAR3 proteins in epithelial cells. The plasmids encoding seyfp2-PAR3 (red) and mTurq2-Tax (red) and(green) mTurq2-Tax proteins (green) were co-transfected in HEK293 cells and co-localization proteins were co-transfected in HEK293 cells and co-localization between both proteins between both proteins was tested. In (B,C), the white arrows indicate the expression the overwas tested. In (B,C), the white arrows indicate the expression of the over-expressed of proteins as expressed in proteins as described in the text. All scale bars are 5ofµm; Influenceover of Tax expression described the text. All scale bars are 5 µm; (D) Influence Tax(D) expression ectopic DLG1 overPAR3 ectopic DLG1 anddistribution. PAR3 subcellular distribution. HEK293with cellspseyfp2-Tax transfected with pseyfp2-Tax or and subcellular HEK293 cells transfected or with the control with the control empty vector pseyfp2-N1 together with the pmTurq2-DLG1 or pseyfp2-PAR3 empty vector pseyfp2-N1 together with the pmTurq2-DLG1 or pseyfp2-PAR3 expressing plasmids expressing plasmids harvested, andand detergent soluble and insoluble fractions by were separated by were harvested, andwere detergent soluble insoluble fractions were separated centrifugation. centrifugation. The seyfp2-PAR3, mTurq2-DLG1, seyfp2-PAR3, and seyfp2-Tax levelswere in each fraction The mTurq2-DLG1, and seyfp2-Tax expression levels expression in each fraction assessed by were assessed by Western blotfluorescent using anti-green protein (anti-gfp) antibody; (E)expression Influence Western blot using anti-green proteinfluorescent (anti-gfp) antibody; (E) Influence of Tax of Tax expression over DLG1distribution. and PAR3HEK293 subcellular distribution. HEK293 cells over endogenous DLG1 andendogenous PAR3 subcellular cells transfected with pseyfp2-Tax transfected with pseyfp2-Tax or with the control empty vector pseyfp2-N1 were harvested, and or with the control empty vector pseyfp2-N1 were harvested, and detergent soluble and insoluble detergentwere soluble and insoluble fractions were separated DLG1 by centrifugation. Endogenous DLG1 and fractions separated by centrifugation. Endogenous and PAR3 expression levels in each PAR3 expression levelsbyinWestern each fraction wereanti-DLG1 assessed by Western blot antibodies. using anti-DLG1 and antifraction were assessed blot using and anti-PAR3 The seyfp2-Tax PAR3 antibodies. The seyfp2-Tax was ascertained anti-gfp antibody. For (C,D), expression was ascertained usingexpression an anti-gfp antibody. For using (C,D),anthe γ-tubulin and Transferrin the γ-tubulin and Transferrin receptor (TR) expression, which were detected with anti-γ-tubulin receptor (TR) expression, which were detected with anti-γ-tubulin and anti-TR antibodies, were usedand as anti-TR control; antibodies, were used control; Influence of Tax expression DLG1 with total loading (F) Influence of as Taxloading expression over(F) DLG1 total levels. HEK293 cells over transfected levels. HEK293 cells the transfected with pseyfp2-Tax or with the control emptyand vector were pseyfp2-Tax or with control empty vector pseyfp2-N1 were harvested, totalpseyfp2-N1 protein extracts were separated SDS-PAGE. endogenous DLG1 expression level was assessed by Western blot harvested, andbytotal protein The extracts were separated by SDS-PAGE. The endogenous DLG1 using anti-DLG1, and seyfp2-Tax using an anti-gfp antibody. expression level was assessed byexpression Western was blot ascertained using anti-DLG1, and seyfp2-Tax expression was ascertained using an anti-gfp antibody.. 3.2. FRET-Based Confirmation of the Interaction between Tax with DLG1 Protein 3.2. FRET-Based Confirmation of the Interaction between Tax with DLG1 Protein To further confirm the results, and with the aim of evaluating a direct interaction between Tax To further results, and with the (Figure aim of evaluating a direct interaction between Tax and DLG1 in theconfirm speckledthe cytoplasmic aggregates 1B), we applied an acceptor photobleaching and DLG1 in the speckled cytoplasmic aggregates (Figure 1B), we applied an acceptor photobleaching FRET protocol. To this end, we made use of the FRET properties of mTurq2 (donor).
(8) Viruses 2017, 9, 355. 8 of 19. Viruses 2017, 9, 355. 8 of 19. FRET protocol. To this end, we made use of the FRET properties of mTurq2 (donor) and seyfp2 (acceptor) [36]. Vector plasmids were co-transfected intoco-transfected HEK293 cells and fluorescence and seyfp2 (acceptor) [36]. Vector plasmids were into the HEK293 cells intensity and the of mTurq2-DLG1 (multicolored) was assessed before and after photobleaching seyfp2-Tax (yellow) fluorescence intensity of mTurq2-DLG1 (multicolored) was assessed before andofafter photobleaching in the same region. As shown in Figure 3A, an increase in mTurq2-DLG1 fluorescence (left panels) was of seyfp2-Tax (yellow) in the same region. As shown in Figure 3A, an increase in mTurq2-DLG1 observed after photobleaching of seyfp2-Tax (right panels), evidencing the presence of FRET signals fluorescence (left panels) was observed after photobleaching of seyfp2-Tax (right panels), evidencing between Tax and DLG1. To analyze thisTax more accurately, weanalyze quantify themore FRETaccurately, efficiency in series of the presence of FRET signals between and DLG1. To this wea quantify prebleaching and postbleaching images, as described in Experimental Procedures, obtaining a mean the FRET efficiency in a series of prebleaching and postbleaching images, as described in value of 8.8% (Figure 3B). This result awas far value higherofthan that obtained seyfp2-TaxMUT mutant Experimental Procedures, obtaining mean 8.8% (Figure 3B). for Thisthe result was far higher than derivate (0.9%) a FRET negative control which the vector was control co-transfected that obtained fororthe seyfp2-TaxMUT mutantinderivate (0.9%) or aseyfp2-Tax FRET negative in whichwith the mTurq2 empty vector (1.07%), as expected. vector seyfp2-Tax was co-transfected with mTurq2 empty vector (1.07%), as expected.. Figure 3. Detection Figure 3. Detection of of the the DLG1-Tax DLG1-Tax interaction interaction by by fluorescence fluorescence resonance resonance energy energy transfer transfer (FRET) (FRET) microscopy. (A) Acceptor photobleaching FRET experiments. HEK293 epithelial cells transiently microscopy. (A) Acceptor photobleaching FRET experiments. HEK293 epithelial cells transiently transfected withpmTurq2-DLG1 pmTurq2-DLG1and and pseyfp2-Tax were submitted toacceptor the acceptor photobleaching transfected with pseyfp2-Tax were submitted to the photobleaching FRET FRET protocol described in Experimental Procedures. in the intensity of mTurq2-DLG1 protocol described in Experimental Procedures. ChangesChanges in the intensity of mTurq2-DLG1 emission emission can be appreciated (donor, leftinpanel) in the of region of interest (ROI) under and can be appreciated (donor, left panel) the region interest (ROI) under study study beforebefore and after after photobleaching of the seyfp2-Tax emission (acceptor, right panel). The mTurq2-DLG1 photobleaching of the seyfp2-Tax emission (acceptor, right panel). The mTurq2-DLG1 fluorescence fluorescence emission shown in a pseudocolored which for a better visualization of the emission is shown in aispseudocolored table which table allows for a allows better visualization of the changes in changes in fluorescence intensity. vertical on the left displays to highfrom intensities from fluorescence intensity. The verticalThe scale on thescale left displays low to highlow intensities bottom-up. bottom-up. The representative ROI is under studyinisa delimited in aand white square and is shown The representative ROI under study delimited white square is shown magnified in the magnified in the bars are 10 of µm; Quantification of the FRET efficiency in inset. All scale barsinset. are 10 All µm;scale (B) Quantification the(B) FRET efficiency in photobleaching experiments. photobleaching experiments. The mTurq2-DLG1 mean fluorescence intensity in the ROI under study The mTurq2-DLG1 mean fluorescence intensity in the ROI under study was determined before and after was determinedofbefore and after photobleaching of seyfp2-Tax emission. These two values were photobleaching seyfp2-Tax emission. These two values were introduced into the formula described introduced into the formulaand described in Experimental and the FRET (%)= for in Experimental Procedures the FRET efficiency (%) Procedures for that particular ROI wasefficiency obtained (n 15, that particular ROI To was obtained = 15, left side, blue bar). Tothis ascertain thewas background FRET left side, blue bar). ascertain the(nbackground FRET efficiency, protocol simultaneously efficiency, this protocolnon was simultaneously over a random photobleached ROI On inside applied over a random photobleached ROIapplied inside the same cell (n =non 15, left side, green bar). the the same cellas(nnegative = 15, leftbiological side, green bar). On otherprocedure hand, as negative the whole other hand, controls, thethe whole was also biological carried outcontrols, in cells expressing mTurq2-DLG1 (n =expressing 8, middle mTurq2-DLG1 blue and green and bars)seyfp2-TaxMUT or control mTurq2 with procedure was and alsoseyfp2-TaxMUT carried out in cells (n =along 8, middle seyfp2-Tax (n = bars) 8, right side, blue and green each condition, efficiency % are shown as blue and green or control mTurq2 alongbars). withIn seyfp2-Tax (n = 8, FRET right side, blue and green bars). Mean ± SD. Conditions for statistical are shown horizontal linesfor andstatistical assessed In each condition, FRETtested efficiency % are significance shown as Mean ± SD.with Conditions tested by a One-tailed Studentwith t-test. * p < 0.05lines was and considered beasignificant. significance are shown horizontal assessedtoby One-tailed Student t-test. * p < 0.05 was considered to be significant.. Altogether, these data demonstrate, for the first time, that Tax and DLG1 directly interact inside the cell, in a PDZ-dependent manner, at least in structures close to the nucleus which were worthy of being identified..
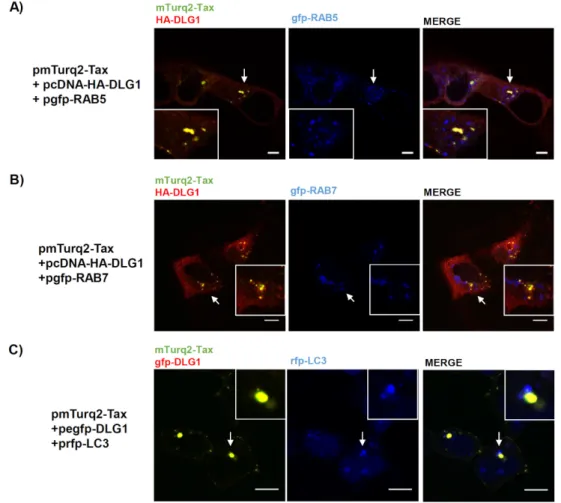
(9) Viruses 2017, 9, 355. 9 of 19. Altogether, these data demonstrate, for the first time, that Tax and DLG1 directly interact inside the cell, in a PDZ-dependent manner, at least in structures close to the nucleus which were worthy of being identified. 3.3. Analysis of the Localization of Tax-DLG1 Aggregates into Cellular Structures The co-localization of Tax and DLG1 entails the arrangement of vesicle-like structures around the nucleus that appear to extend to the cell periphery. Even though other reports have described this issue previously, the nature of such aggregates has not been investigated. It is possible that the transient co-expression of both proteins could exacerbate some specific biological mechanisms in which these proteins participate. Hence, we initiated a series of studies to elucidate the potential association of the Tax-DLG1 complexes with different cellular components. Based on our findings, we hypothesized that a portion of the aggregate forms of Tax-DLG1 observed in the cytoplasm may be taking part in intracellular trafficking pathways. To begin examining this hypothesis, we used the RAB endosome markers: RAB5 (early endosomes) and RAB7 (late endosomes). These small GTPases interact with proteins involved in vesicular transport and protein complexes that regulate vesicle fusion [45]. Moreover, these proteins are components of the exosomes as they are structures that derive from the invagination of endosomes [46]. This is worth investigating since recent reports have associated Tax with exosomes and have demonstrated its importance for viral pathogenesis [47]. Besides, new data suggests that DLG1 may also participate in the intracellular trafficking machinery, recruiting components of the vesicles in both endocytic and exocytic pathways [48]. Considering this, we performed tripartite co-localization analysis in HEK293 cells co-transfected with pmTurq2-TaxHA-DLG1 and pgfp-RAB5 (Figure 4A) or pgfp-RAB7 (Figure 4B) by confocal fluorescence microscopy. The expression of these endosome markers in HEK293 cells was first evaluated by fluorescence as it can be appreciated in Figure S2. The results presented in Figure 4A,B show, in concordance with the previous results, the DLG1 and Tax dotted co-localization (left panels). However, no co-localization of these complexes with the RAB markers was observed (Figure 4B,C, right panels). The Tax protein was shown to participate in autophagy deregulation, increasing the number of autophagosomes where it can localize [49]. Hence, we wanted to address if the formation of the speckled Tax-DLG1 aggregates could be an exacerbation of this activity of Tax due to its interaction with DLG1. To test this possibility, mTurq2-Tax and egfp–DLG1 were co-expressed with the rfp-LC3 autophagosome marker in HEK293 cells. As shown in Figure 4C, the punctuated dots of the Tax-DLG1 complexes do not co-localize with LC3. On the other hand, Tax can be observed forming clusters close to the Golgi apparatus where it may have oncogenic functions [50]. Moreover, Tax may pass through the Golgi apparatus as part of the course to exocytosis [43,51]. Interestingly, DLG1 also associates with the cis and post-Golgi components in concordance with trafficking processes [52]. Therefore, we performed studies to determine if the Tax-DLG1 complexes may distribute with the cis-Golgi compartment. We transfected HEK293 cells with both pmTurq2-Tax and pcDNA-HA-DLG1 and analyzed protein expression by fluorescence microscopy. The Golgi apparatus was stained with antibodies directed against the Golgi matrix protein 130 (GM130). As seen in Figure 5A, three color confocal imaging analysis indicates that there is a partial co-distribution of Tax-DLG1 with GM130, especially in the perinuclear region. To further confirm this result, we also analyzed this issue in cells transfected only with p mTurq2-Tax vector. Figure 5B (left panel) shows that Tax can also target endogenous DLG1 to form speckled dots, though to a lesser extent than when DLG1 is over-expressed, and in agreement with the data shown in Figure 2E about endogenous DLG1 redistribution. Interestingly, Tax-DLG1 partial co-localization with GM130 is also observed in this condition, indicating the association of the observed aggregates with the Golgi apparatus. Taken together, these data suggest that the association of Tax and DLG1 may perturb their cellular distribution, enhancing their retention at Golgi structures following direct protein binding..
(10) Viruses 2017, 9, 355. 10 of 19. In addition, it was reported that Tax localizes at the microtubule-organizing center (MTOC), a structure closely associated with the cis-Golgi compartment, where the viral protein can regulate the polarization of microtubules to favor the virological synapse along with signal transduction activation [43,53]. Remarkably, DLG1 expression was detected in mitotic centrosome recruiting Viruses 2017, 9, 355 10 of 19 factors which facilitate centrosome motility [54,55]. Then, we evaluated if the Tax-DLG1 aggregates could be associated with MTOC arrangement in the perinuclear region. For this, HEK293 cells transiently transfected with pmTurq2-Tax vector were stained with antibodies directed against DLG1 transiently transfected with pmTurq2-Tax vector were stained with antibodies directed against DLG1 and γ-tubulin, a component of the MTOC. As it can be appreciated in Figure 6, there is a clear and γ-tubulin, a component of the MTOC. As it can be appreciated in Figure 6, there is a clear association of the Tax-1-DLG1 complexes with the γ-tubulin marker. This result suggests that part of association of the Tax-1-DLG1 complexes with the γ-tubulin marker. This result suggests that part the protein aggregates close to the nucleus is associated with the MTOC, and their distribution is of the protein aggregates close to the nucleus is associated with the MTOC, and their distribution is closely juxtaposed with the Golgi compartment. closely juxtaposed with the Golgi compartment.. Figure 4. The DLG1-Tax complexes do not co-localize in endosomes or autophagosomes. (A and B) Figure 4. The DLG1-Tax complexes do not co-localize in endosomes or autophagosomes. (A) Evaluation of co-localization between the DLG1-Tax complexes and endosomal markers. HEK293 cells Evaluation of co-localization between the DLG1-Tax complexes and endosomal markers. HEK293 were transiently transfected with pcDNA-HA-DLG1 (HA, human influenza hemagglutinin epitope) cells were transiently transfected with pcDNA-HA-DLG1 (HA, human influenza hemagglutinin and pmTurq2-Tax plasmids, along with a pgfp-RAB5 (A) or pgfp-RAB7 (B). The HA-DLG1 expression epitope) and pmTurq2-Tax plasmids, along with a pgfp-RAB5 (upper panel) or pgfp-RAB7 (bottom was detected by immunofluorescence using an anti-HA antibody. The DLG1-Tax co-localization pattern panel). The HA-DLG1 expression was detected by immunofluorescence using an anti-HA antibody. is shown in yellow and RAB expression is shown in blue; (C) Assessment of co-localization between The DLG1-Tax co-localization pattern is shown in yellow and RAB expression is shown in blue; (B) the DLG1-Tax complexes and the autophagosome marker LC3. The prfp-LC3 plasmid was transfected Assessment of co-localization between the DLG1-Tax complexes and the autophagosome marker in HEK293 cells along with both pmTurq2-Tax and pegfp-DLG1 plasmids. Each protein expression was LC3. The prfp-LC3 plasmid was transfected in HEK293 cells along with both pmTurq2-Tax and pegfpobserved by direct emission of the tagging fluorescent proteins. The DLG1-Tax colocalization pattern is DLG1 plasmids. Each protein expression was observed by direct emission of the tagging fluorescent shown in yellow and LC3 expression is shown in blue. In (A–C) the white arrow indicates the region proteins. The DLG1-Tax colocalization pattern is shown in yellow and LC3 expression is shown in magnified in the inset. All scale bars represent 10 µm. blue. In (A–C) the white arrow indicates the region magnified in the inset. All scale bars represent 10 µm..
(11) Viruses 2017, 9, 355 Viruses 2017, 9, 355. 11 of 19 11 of 19. Figure TheDLG1-Tax DLG1-Taxcomplexes complexesco-distribute co-distributewith withthe theGolgi Golgiapparatus. apparatus. Evaluation of Figure 5. 5. The (A)(A) Evaluation of coco-localization of the perinuclear DLG1-Tax complexes with GM130 in overexpression experiments. localization of the perinuclear DLG1-Tax complexes with GM130 in overexpression experiments. HEK293 and pmTurq2-Tax pmTurq2-Tax plasmids HEK293 cells cells transiently transiently transfected transfected with with pcDNA-HA-DLG1 pcDNA-HA-DLG1 and plasmids were were immunostained to detect detectGM130 GM130expression expression using a monoclonal anti-GM130 antibody (blue). immunostained to using a monoclonal anti-GM130 antibody (blue). HAHA-DLG1 expression was detected using an anti-HA antibody (red) and mTurq2-Tax expression DLG1 expression was detected using an anti-HA antibody (red) and mTurq2-Tax expression was was observed directly through the mTurq2 emission (green). Dashed circles indicate nuclear regions. observed directly through the mTurq2 emission (green). Dashed circles indicate nuclear regions. The The DLG1-Tax complexes are shown in yellow; (B) Analysis of co-localization of the endogenous DLG1-Tax complexes are shown in yellow; (B) Analysis of co-localization of the endogenous DLG1DLG1-Tax complexes with GM130. HEK293 cells transiently were transiently transfected with mTurq2-Tax (green), Tax complexes with GM130. HEK293 cells were transfected with mTurq2-Tax (green), and and endogenous DLG1 (red) and GM130 (Blue) were detected using specific antibodies. In (A,B), endogenous DLG1 (red) and GM130 (Blue) were detected using specific antibodies. In (A,B), the light the blue arrow indicates thewhich regioniswhich is amplified in theindicating inset, indicating the DLG1-Tax-GM130 bluelight arrow indicates the region amplified in the inset, the DLG1-Tax-GM130 triple triple co-distribution. All scale bars are 10 µm. co-distribution. All scale bars are 10 µm.. The finding of co-distribution co-distribution of the Tax-DLG1 aggregates aggregates with with MTOC and and cis-Golgi cis-Golgi may be explained by the fact that the Golgi stacks consist of an interconnected network in the region around and in inclose closeproximity proximityofof MTOC. therefore, wanted to address such co-distribution also and thethe MTOC. We,We, therefore, wanted to address if suchifco-distribution also occurs occurs in human T cells, thecells target cells of HTLV-1. we evaluated the expression of endogenous in human T cells, the target of HTLV-1. First, weFirst, evaluated the expression of endogenous DLG1 in DLG1 cells in Jurkat cells by immunofluorescence and, it can beinobserved in DLG1 Figurelocalizes 7A, DLG1 localizes Jurkat by immunofluorescence and, as it can beas observed Figure 7A, diffusely in diffusely in the cytoplasm with a patched pattern at the cell borders in [56]. inTax, the the cytoplasm together withtogether a patched pattern at the cell borders [56]. However, theHowever, presence of of Tax, a clearofco-localization of vesicle both proteins in vesicle liketo structures close to athe nucleus apresence clear co-localization both proteins in like structures close the nucleus and reduction and a reduction of cell DLG1 from(Figure the cell7B) border (Figure can be seen, ascells with(Figure HEK293 of DLG1 from the border can be seen,7B) as with HEK293 5B,cells left (Figure panel). 5B, left panel). Afterwards, we assessed if in Jurkat cells the Tax-DLG1 complexes could be Afterwards, we assessed if in Jurkat cells the Tax-DLG1 complexes could be also associated toalso the associated to the(Figure Golgi apparatus or the (Figure 8B). The indicate that the Golgi apparatus 8A) or the(Figure MTOC 8A) (Figure 8B).MTOC The results indicate thatresults the protein complexes protein complexes distribute into the and clearly co-localize with component the γ-tubulin distribute into the Golgi apparatus andGolgi clearlyapparatus co-localize with the γ-tubulin MTOC as MTOC component asquantification demonstratedanalysis by the quantification analysis shown in Figure S3 absence [57]. However, demonstrated by the shown in Figure S3 [57]. However, in the of Tax, in the absenceDLG1 of Tax, endogenous did not show a co-distribution with Golgi endogenous did not show aDLG1 co-distribution either with the Golgieither marker orthe with the marker MTOC or with the MTOC structure (Figure S4). structure (Figure S4)..
(12) Viruses 2017, 9, 355 Viruses 2017, 9, 355 Viruses 2017, 9, 355. 12 of 19 12 of 19. 12 of 19. Figure 6. The DLG1-Tax complexes associate with MTOC. HEK293 cells were transiently transfected with mTurq2-Tax (green), and endogenous DLG1 (red)HEK293 and γ-tubulin (blue) were transfected detected using Figure 6. The The DLG1-Tax DLG1-Tax complexes associate with MTOC. HEK293 cells were transiently transfected Figure complexes associate with MTOC. cells were transiently specific antibodies. The DLG1-Tax-γ-tubulin triple co-localization is shown in white. The light blue withmTurq2-Tax mTurq2-Tax(green), (green),and andendogenous endogenousDLG1 DLG1 (red) and γ-tubulin (blue) were detected using with (red) and γ-tubulin (blue) were detected using specific arrow indicates the triple co-localization region which is amplified in the inset. All scale bars are 10 specific antibodies. The DLG1-Tax-γ-tubulin co-localization is shown in white. light blue antibodies. The DLG1-Tax-γ-tubulin tripletriple co-localization is shown in white. TheThe light blue arrow µm. arrow indicates the co-localization triple co-localization is amplified the inset. All scale areµm. 10 indicates the triple regionregion whichwhich is amplified in theininset. All scale barsbars are 10 µm.. 7. Tax-mediatedalteration alteration DLG1 expression inT-cells. T-cells. (A) Analysis DLG1 expression Figure alteration DLG1 expression Analysis of of DLG1 expression Figure 7. 7. Tax-mediated Tax-mediated ofofof DLG1 expression in in T-cells. (A)(A) Analysis of DLG1 expression in in in Jurkat T cells. The expression of endogenous DLG1 indicated with white arrows was assayed by Jurkat T cells. The expression of endogenous DLG1 indicated with white arrows was assayed Jurkat T The expression of endogenous DLG1 indicated with white arrows was assayed by by 0 ,6-diamidino-2immunfluorescence using an anti-DLG1 antibody (red). The nucleus was stained with 4 immunfluorescence usingan ananti-DLG1 anti-DLG1antibody antibody (red). The nucleus stained 4′,6-diamidinoimmunfluorescence using (red). The nucleus waswas stained withwith 4′,6-diamidinophenylindole Expression DLG1 the presence Jurkat T-cells 2-phenylindole(DAPI) (DAPI) (blue); inin the presence of of Tax. Jurkat T-cells werewere 2-phenylindole (DAPI)(blue); (blue);(B) (B)Expression ExpressionofofofDLG1 DLG1 in the presence of Tax. Tax. transfected withpmTurq2-Tax pmTurq2-Taxand endogenous DLG1 expression was assayed byThe IF. The transfected with DLG1 expression waswas assayed by IF. lightlight blueblue transfected pmTurq2-Tax andendogenous endogenous DLG1 expression assayed by IF. arrows indicate the co-localization co-localizationregion region(yellow) (yellow) which is amplified in inset. All scale scale bars arrows indicate indicate the which is is amplified in the inset. All All scale bars bars arrows the co-localization region (yellow) which amplified in the the inset. represent µm. represent 5 represent 5 µm.. These data reinforce reinforce the findings described above and indicate the Golgi/MTOC interphase as as These interphase These data data reinforce the thefindings findingsdescribed describedabove aboveand andindicate indicatethe theGolgi/MTOC Golgi/MTOC interphase the particular cell region where DLG1 may be retained in Tax-expressing cells with potential the particular cellcell region where DLG1 as the particular region where DLG1may maybeberetained retainedininTax-expressing Tax-expressing cells cells with with potential potential functional consequences. functional functional consequences. consequences..
(13) Viruses 2017, 9, 355 Viruses 2017, 9, 355. 13 of 19 13 of 19. DLG1-Tax complexes complexes with with the the Golgi/MTOC Golgi/MTOC region in T-cells. Evaluation of Figure 8. Association of DLG1-Tax blue) and γ-tubulin ((B), blue) by co-localization of of Tax-DLG1 Tax-DLG1complexes complexes(yellow) (yellow)with withGM130 GM130((A), ((A), blue) and γ-tubulin ((B), blue) confocal microscopy. Endogenous DLG1, GM130, and γ-tubulin were detected by IF using their by confocal microscopy. Endogenous DLG1, GM130, and γ-tubulin were detected by IF using respective specific specificantibodies. antibodies.The Thewhite white(A) (A)and andlight lightblue blue(B) (B)arrows arrows indicate region amplified respective indicate thethe region amplified in in the inset, showing protein co-localization. scale bars represent 5 µm. the inset, showing thethe protein co-localization. AllAll scale bars represent 5 µm.. 4. Discussion 4. Discussion A number number of of studies studies have have shown shown the importance of protein functions functions and and the the A the importance of the the PBM PBM in in Tax Tax protein targeting of PDZ proteins during viral transformation. The main observation in those studies was the targeting of PDZ proteins during viral transformation. The main observation in those studies was the re-localization ofofthe the PDZ protein its normal distribution to punctate aggregates in the re-localization PDZ protein fromfrom its normal distribution to punctate aggregates in the cytoplasm cytoplasm as a consequence of the interaction with Tax [32]. Although an impact of this reas a consequence of the interaction with Tax [32]. Although an impact of this re-localization on the localization on the cell proliferation rate was initially suggested, the exact distribution of such cell proliferation rate was initially suggested, the exact distribution of such aggregates is still not aggregates is report, still notwe clear. In this report, we of carried out atoseries of analyses to investigate the nature clear. In this carried out a series analyses investigate the nature of the aggregates, of the aggregates, with a focus on the interaction of Tax with the PDZ protein DLG1, whose activities with a focus on the interaction of Tax with the PDZ protein DLG1, whose activities are important in are important in tumor suppression HTLV-1 life investigated cycle [58,59].theWe first investigated the tumor suppression and the HTLV-1 life and cyclethe [58,59]. We first localization of Tax in the localization of Tax in the presence high levels thewe cellular partner DLG1, we observed presence of high levels of the cellularof partner DLG1,of and observed a clear loss ofand nuclear expressiona clear loss of nuclear expression in parallel with an increase in cytoplasmic speckled structures, and in parallel with an increase in cytoplasmic speckled structures, and this redistribution was totally this redistribution was totally PDZ-binding dependent. It is wellthe known that shuttles from the PDZ-binding dependent. It is well known that Tax shuttles from nucleus to Tax the cytoplasm [15,43] nucleus to the cytoplasm [15,43] and is also localized to several organelles. It was suggested that the and is also localized to several organelles. It was suggested that the balance of Tax import-export from balance of Tax from the Tax nucleus may [60]. playTherefore, a role in itregulating [60]. the nucleus mayimport-export play a role in regulating functions is possibleTax thatfunctions the binding to Therefore, it is possible that the binding to DLG1 in the cytoplasm could favor the accumulation of DLG1 in the cytoplasm could favor the accumulation of Tax in these dot aggregates, whereby regulating Taxactivity. in these dot aggregates, whereby regulating its activity. its Along with withthese theseexperiments, experiments, evaluated whether the observed structures could be an Along wewe evaluated whether the observed structures could be an artefact artefact rather than a consequence of a direct specific protein interaction. For this, we made use the rather than a consequence of a direct specific protein interaction. For this, we made use of theofPDZ PDZ polarity protein PAR3. PAR3 is necessary for both tight junction formation and spatial polarity protein PAR3. PAR3 is necessary for both tight junction formation and spatial organization of organization of signaling pathways epithelial cellsPAR3 [61]. has Moreover, PAR3 hastoalso been shown to signaling pathways in epithelial cellsin [61]. Moreover, also been shown have an important have an important role in the cytokine-mediated polarization of T-cells, the target cells of HTLV-1 role in the cytokine-mediated polarization of T-cells, the target cells of HTLV-1 [62]. We have lately [62]. We have lately described that Human Papillomavirus (HPV) E6 protein can target PAR3 through described that Human Papillomavirus (HPV) E6 protein can target PAR3 through the PBM [63]; the PBM [63]; however, even though PAR3 bears three PDZ domains with high homology to those however, even though PAR3 bears three PDZ domains with high homology to those present in DLG1, present innot DLG1, not find an interaction between PAR3 and Taxinusing in vitro and we could findwe an could interaction between PAR3 and Tax using different vitrodifferent and in vivo binding in vivo binding assays. This may suggest that other sequences apart from the PDZ domains may be required for a proper interaction with Tax. Interestingly, the expression of Tax induced neither the formation of aggregates nor the subcellular re-localization of PAR3 (Figure 2), as was identified for.
(14) Viruses 2017, 9, 355. 14 of 19. assays. This may suggest that other sequences apart from the PDZ domains may be required for a proper interaction with Tax. Interestingly, the expression of Tax induced neither the formation of aggregates nor the subcellular re-localization of PAR3 (Figure 2), as was identified for other PDZ proteins. Hence, we demonstrated that PAR3 is not a PDZ target of Tax. In addition, these data indicate that the speckled dots observed for DLG1 are due to a specific protein interaction. To further confirm this, we verified, for the first time, the direct interaction of DLG1-Tax within the cell. By applying an acceptor photobleaching FRET protocol we were able to establish the closeness of the proteins under study and confirm that the binding takes place within the speckled aggregates in a PDZ-dependent manner. It is to be noted that DLG1 experiences a clear redistribution from the cell borders to the cytoplasm in the presence of Tax, and the mislocalization of this protein may have an important impact on its oncosuppressor functions [29]. Indeed, changes in the cellular distribution of DLG1 were observed in different tumors and we have recently reported this issue in an oncogenic HPV model using organotypic cultures [17,64]. The fluorescent signals revealed that the Tax-DLG1 complexes form vesicular-like assemblies. In fact, Tax was shown to localize in several cell organelles [43,51,60], and, therefore, we wanted to know whether Tax would have the ability to recruit DLG1 to some of these cell compartments. Both Tax and DLG1 have been related to intracellular trafficking and, in particular, DLG1 has been reported to form protein complexes associated with endosomes [65] and to be included into endocytic vesicles [66]. It was possible that the interaction of both proteins, when overexpressed, enhances their distribution to such vesicles, considering that alterations in endo and exocytic pathways can be produced during viral infection. However, no co-localization signals between the Tax-DLG1 aggregates and the RAB endosomal proteins were observed, suggesting that their assembly is not targeted to those vesicles. In view of the fact that both Tax and DLG1 proteins were separately reported to localize at the Golgi apparatus [16,43,50,67,68], we investigated whether some of the speckled DLG1-Tax dots, especially those in the perinuclear regions, could be associated with such organelles. Triple Tax/DLG1/GM130 staining and confocal microscopy analysis in HEK293 cells showed a partial overlapping of DLG1-Tax with GM-130 staining. The same results were also observed in Jurkat T cells, therefore, the accumulation of these proteins in this region may have different implications in the virus lifecycle and pathogenesis. In this regard, DLG1 was shown to be located in intracellular membranes, prior to its localization at the cell borders, by association with cell partners [52]. Furthermore, it was indicated that DLG1 and other PDZ proteins might functionally interact with components of the vesicular transport apparatus. Therefore, it is likely that Tax actively interferes with the binding of DLG1 to cell partners in order to prevent the PDZ protein transport and proper localization at the borders, sequestering DLG1 in this cell structure. On the other hand, our experiments revealed a close association of the Tax-DLG1 complexes with the MTOC. It is tempting to speculate that Tax may recruit the polarity protein in order to support the Tax-mediated microtubule polarization event [43], by taking advantage of the DLG1 polarization functions and its association with the cytoskeleton. In this sense, the association of DLG1 with the microtubule-based cytoskeleton in lymphocytes and its importance in intracellular trafficking was previously reported [56]. Curiously, the Golgi/MTOC cellular region serves as a platform for signal transduction mechanisms where Tax is able to stimulate cell proliferation pathways [53,69]. Therefore, the targeting of DLG1 to this system could also exacerbate oncogenic traits of DLG1. It is possible that the interaction with Tax not only interferes with DLG1 regulatory functions, but also induces some activities that contribute to Tax functions involved in the viral cycle and pathogenesis, as reported for other viral oncoproteins in HPV and adenovirus infections [33,70]. Even though previous studies have shown that a fraction of extranuclear Tax co-localizes with the Golgi apparatus in association with the MTOC [16,43,69], this is the first analysis describing that.
(15) Viruses 2017, 9, 355. 15 of 19. such viral protein distribution may imply the association with DLG1. Nevertheless, it is not possible to exclude that the DLG1-Tax protein assemblies may also be distributed into other cell compartments yet to be investigated. Moreover, it was shown that Tax also induces the cellular redistribution of other PDZ proteins like MAGI-1 and MAGI-3 as spot aggregates in the perinuclear area [20,21]. No data are available about the localization of these proteins at the Golgi apparatus or their association with the MTOC, as far as we know. However, it is possible to speculate that Tax has a common strategy for recruiting PDZ proteins in these subcellular regions, either to abolish their oncosuppressor functions or to exacerbate different signal transduction pathways [53]. In summary, we were able to demonstrate, for the first time, the binding of Tax to a PDZ protein within the cell. We also shed light on the localization of this interaction, having shown that the Tax-DLG1 complexes take part at the Golgi/MTOC region. These findings constitute a significant step towards understanding Tax functions in relationship to its interaction with PDZ proteins and the possible biological significance of these protein associations. However, further studies are necessary to completely elucidate its potential role in viral pathogenesis. Supplementary Materials: The following are available online at www.mdpi.com/1999-4915/9/11/355/s1. Acknowledgments: We acknowledge María Isabel Colombo (Instituto de Histología y Embriología “Mario H. Burgos”, Mendoza, Argentina) and Eleonora García Vescovi (Instituto de Biología Molecular y Celular de Rosario-CONICET) for kindly and generously providing us with molecular biology tools. We thank María Robson, Mariana de Sanctis, Geraldine Raimundo, Romina Ricardo, and Carolina Perret from the English Department (Facultad de Ciencias Bioquímicas y Farmacéuticas, UNR) for the English language editing of the manuscript. We also gratefully acknowledge Dolores Campos and Rodrigo Vena for excellent technical support/help with cell culture and confocal laser microscopy/image software, respectively. We also thank Fundación Bunge Born for the Oster Fellowship to FM. This work was partially supported by a grant from the Instituto Nacional del Cáncer, Ministerio de Salud de la República Argentina to DG. Author Contributions: F.M., M.B.V. and C.B.A. performed the experiments. L.M. contributed to data analysis. F.M., A.L.C. and D.G. designed the experiments, analyzed the data, and wrote the paper. Conflicts of Interest: The authors declare no conflicts of interest.. Abbreviations ATL DLG1 egfp FRET FRET Ef HA HPV hScrib HTLV-1 MAGI MTOC mTurq2 PAR PBM PDZ rfp ROI. adult T-cell leukaemia human Disc large protein enhanced green fluorescent protein fluorescence resonance energy transfer FRET efficiency Influenza virus Haemagglutinin epitope Human Papillomavirus human Scribble Human T cell leukemia virus type 1 membrane-associated guanylate kinase with inverted orientation microtubule-organizing center enhanced version of cyan fluorescent protein Partitioning defective PDZ-binding motif PSD-95/DLG/ZO-1 domains red fluorescence protein region of interest, seyfp2, super enhanced yellow fluorescent protein.
(16) Viruses 2017, 9, 355. 16 of 19. References 1. 2.. 3.. 4. 5.. 6. 7. 8.. 9.. 10.. 11. 12. 13. 14.. 15.. 16. 17.. 18. 19.. 20.. Gessain, A.; Cassar, O. Epidemiological Aspects and World Distribution of HTLV-1 Infection. Front. Microbiol. 2012, 3, 388. [CrossRef] [PubMed] Hinuma, Y.; Nagata, K.; Hanaoka, M.; Nakai, M.; Matsumoto, T.; Kinoshita, K.I.; Shirakawa, S.; Miyoshi, I. Adult T-cell leukemia: Antigen in an ATL cell line and detection of antibodies to the antigen in human sera. Proc. Natl. Acad. Sci. USA 1981, 78, 6476–6480. [CrossRef] [PubMed] Poiesz, B.J.; Ruscetti, F.W.; Gazdar, A.F.; Bunn, P.A.; Minna, J.D.; Gallo, R.C. Detection and isolation of type C retrovirus particles from fresh and cultured lymphocytes of a patient with cutaneous T-cell lymphoma. Proc. Natl. Acad. Sci. USA 1980, 77, 7415–7419. [CrossRef] [PubMed] Zhao, T.; Matsuoka, M. HBZ and its roles in HTLV-1 oncogenesis. Front. Microbiol. 2012, 3, 247. [CrossRef] [PubMed] Currer, R.; Van Duyne, R.; Jaworski, E.; Guendel, I.; Sampey, G.; Das, R.; Narayanan, A.; Kashanchi, F. HTLV tax: A fascinating multifunctional co-regulator of viral and cellular pathways. Front. Microbiol. 2012, 3, 406. [CrossRef] [PubMed] Grassmann, R.; Aboud, M.; Jeang, K.T. Molecular mechanisms of cellular transformation by HTLV-1 Tax. Oncogene 2005, 24, 5976–5985. [CrossRef] [PubMed] Higuchi, M.; Fujii, M. Distinct functions of HTLV-1 Tax1 from HTLV-2 Tax2 contribute key roles to viral pathogenesis. Retrovirology 2009, 6, 117. [CrossRef] [PubMed] Grassmann, R.; Berchtold, S.; Radant, I.; Alt, M.; Fleckenstein, B.; Sodroski, J.G.; Haseltine, W.A.; Ramstedt, U. Role of human T-cell leukemia virus type 1 X region proteins in immortalization of primary human lymphocytes in culture. J. Virol. 1992, 66, 4570–4575. [PubMed] Tanaka, A.; Takahashi, C.; Yamaoka, S.; Nosaka, T.; Maki, M.; Hatanaka, M. Oncogenic transformation by the tax gene of human T-cell leukemia virus type I in vitro. Proc. Natl. Acad. Sci. USA 1990, 87, 1071–1075. [CrossRef] [PubMed] Hajj, H.E.; Nasr, R.; Kfoury, Y.; Dassouki, Z.; Nasser, R.; Kchour, G.; Hermine, O.; de Thé, H.; Bazarbachi, A. Animal models on HTLV-1 and related viruses: What did we learn? Front. Microbiol. 2012, 3, 333. [CrossRef] [PubMed] Smith, M.R.; Greene, W.C. Characterization of a novel nuclear localization signal in the HTLV-I tax transactivator protein. Virology 1992, 187, 316–320. [CrossRef] Chlichlia, K.; Khazaie, K. HTLV-1 Tax: Linking transformation, DNA damage and apoptotic T-cell death. Chem. Biol. Interact. 2010, 188, 359–365. [CrossRef] [PubMed] Yang, L.; Kotomura, N.; Ho, Y.-K.; Zhi, H.; Bixler, S.; Schell, M.J.; Giam, C.-Z. Complex cell cycle abnormalities caused by human T-lymphotropic virus type 1 Tax. J. Virol. 2011, 85, 3001–3009. [CrossRef] [PubMed] Meertens, L.; Chevalier, S.; Weil, R.; Gessain, A.; Mahieux, R. A 10-amino acid domain within human T-cell leukemia virus type 1 and type 2 tax protein sequences is responsible for their divergent subcellular distribution. J. Biol. Chem. 2004, 279, 43307–43320. [CrossRef] [PubMed] Alefantis, T.; Jain, P.; Ahuja, J.; Mostoller, K.; Wigdahl, B. HTLV-1 Tax nucleocytoplasmic shuttling, interaction with the secretory pathway, extracellular signaling, and implications for neurologic disease. J. Biomed. Sci. 2005, 12, 961–974. [CrossRef] [PubMed] Alefantis, T.; Mostoller, K.; Jain, P.; Harhaj, E.; Grant, C.; Wigdahl, B. Secretion of the human T cell leukemia virus type I transactivator protein tax. J. Biol. Chem. 2005, 280, 17353–17362. [CrossRef] [PubMed] Facciuto, F.; Cavatorta, A.L.; Valdano, M.B.; Marziali, F.; Gardiol, D. Differential expression of PDZ domain-containing proteins in human diseases—Challenging topics and novel issues. FEBS J. 2012, 279, 3538–3548. [CrossRef] [PubMed] Fanning, A.S.; Anderson, J.M. PDZ domains: Fundamental building blocks in the organization of protein complexes at the plasma membrane. J. Clin. Investig. 1999, 103, 767–772. [CrossRef] [PubMed] Arpin-Andre, C.; Mesnard, J.M. The PDZ domain-binding motif of the human T cell leukemia virus type 1 tax protein induces mislocalization of the tumor suppressor hScrib in T cells. J. Biol. Chem. 2007, 282, 33132–33141. [CrossRef] [PubMed] Makokha, G.N.; Takahashi, M.; Higuchi, M.; Saito, S.; Tanaka, Y.; Fujii, M. Human T-cell leukemia virus type 1 Tax protein interacts with and mislocalizes the PDZ domain protein MAGI-1. Cancer Sci. 2013, 104, 313–320. [CrossRef] [PubMed].
(17) Viruses 2017, 9, 355. 21.. 22.. 23. 24.. 25.. 26.. 27. 28.. 29. 30.. 31.. 32.. 33.. 34.. 35.. 36.. 37. 38. 39.. 17 of 19. Ohashi, M.; Sakurai, M.; Higuchi, M.; Mori, N.; Fukushi, M.; Oie, M.; Coffey, R.J.; Yoshiura, K.; Tanaka, Y.; Uchiyama, M.; et al. Human T-cell leukemia virus type 1 Tax oncoprotein induces and interacts with a multi-PDZ domain protein, MAGI-3. Virology 2004, 320, 52–62. [CrossRef] [PubMed] Suzuki, T.; Ohsugi, Y.; Uchida-Toita, M.; Akiyama, T.; Yoshida, M. Tax oncoprotein of HTLV-1 binds to the human homologue of Drosophila discs large tumor suppressor protein, hDLG, and perturbs its function in cell growth control. Oncogene 1999, 18, 5967–5972. [CrossRef] [PubMed] Javier, R.T.; Rice, A.P. Emerging theme: Cellular PDZ proteins as common targets of pathogenic viruses. J. Virol. 2011, 85, 11544–11556. [CrossRef] [PubMed] Kiyono, T.; Hiraiwa, A.; Fujita, M.; Hayashi, Y.; Akiyama, T.; Ishibashi, M. Binding of high-risk human papillomavirus E6 oncoproteins to the human homologue of the Drosophila discs large tumor suppressor protein. Proc. Natl. Acad. Sci. USA 1997, 94, 11612–11616. [CrossRef] [PubMed] Xie, L.; Yamamoto, B.; Haoudi, A.; Semmes, O.J.; Green, P.L. PDZ binding motif of HTLV-1 Tax promotes virus-mediated T-cell proliferation in vitro and persistence in vivo. Blood 2006, 107, 1980–1988. [CrossRef] [PubMed] Bertazzoni, U.; Turci, M.; Avesani, F.; Di Gennaro, G.; Bidoia, C.; Romanelli, M.G. Intracellular localization and cellular factors interaction of HTLV-1 and HTLV-2 Tax proteins: Similarities and functional differences. Viruses 2011, 3, 541–560. [CrossRef] [PubMed] Bilder, D. Epithelial polarity and proliferation control: Links from the Drosophila neoplastic tumor suppressors. Genes Dev. 2004, 18, 1909–1925. [CrossRef] [PubMed] Lue, R.A.; Marfatia, S.M.; Branton, D.; Chishti, A.H. Cloning and characterization of hdlg: The human homologue of the Drosophila discs large tumor suppressor binds to protein 4.1. Proc. Natl. Acad. Sci. USA 1994, 91, 9818–9822. [CrossRef] [PubMed] Roberts, S.; Delury, C.; Marsh, E. The PDZ protein discs-large (DLG): The “Jekyll and Hyde” of the epithelial polarity proteins. FEBS J. 2012, 279, 3549–3558. [CrossRef] [PubMed] Round, J.L.; Tomassian, T.; Zhang, M.; Patel, V.; Schoenberger, S.P.; Miceli, M.C. Dlgh1 coordinates actin polymerization, synaptic T cell receptor and lipid raft aggregation, and effector function in T cells. J. Exp. Med. 2005, 201, 419–430. [CrossRef] [PubMed] Xavier, R.; Rabizadeh, S.; Ishiguro, K.; Andre, N.; Ortiz, J.B.; Wachtel, H.; Morris, D.G.; Lopez-Ilasaca, M.; Shaw, A.C.; Swat, W.; et al. Discs large (Dlg1) complexes in lymphocyte activation. J. Cell Biol. 2004, 166, 173–178. [CrossRef] [PubMed] Hirata, A.; Higuchi, M.; Niinuma, A.; Ohashi, M.; Fukushi, M.; Oie, M.; Akiyama, T.; Tanaka, Y.; Gejyo, F.; Fujii, M. PDZ domain-binding motif of human T-cell leukemia virus type 1 Tax oncoprotein augments the transforming activity in a rat fibroblast cell line. Virology 2004, 318, 327–336. [CrossRef] [PubMed] Frese, K.K.; Latorre, I.J.; Chung, S.-H.; Caruana, G.; Bernstein, A.; Jones, S.N.; Donehower, L.A.; Justice, M.J.; Garner, C.C.; Javier, R.T. Oncogenic function for the Dlg1 mammalian homolog of the Drosophila discs-large tumor suppressor. EMBO J. 2006, 25, 1406–1417. [CrossRef] [PubMed] Kong, K.; Kumar, M.; Taruishi, M.; Javier, R.T. The Human Adenovirus E4-ORF1 Protein Subverts Discs Large 1 to Mediate Membrane Recruitment and Dysregulation of Phosphatidylinositol 3-Kinase. PLoS Pathog. 2014, 10. [CrossRef] [PubMed] Gardiol, D.; Kuhne, C.; Glaunsinger, B.; Lee, S.S.; Javier, R.; Banks, L. Oncogenic human papillomavirus E6 proteins target the discs large tumour suppressor for proteasome-mediated degradation. Oncogene 1999, 18, 5487–5496. [CrossRef] [PubMed] Goedhart, J.; von Stetten, D.; Noirclerc-Savoye, M.; Lelimousin, M.; Joosen, L.; Hink, M.A.; van Weeren, L.; Gadella, T.W., Jr.; Royant, A. Structure-guided evolution of cyan fluorescent proteins towards a quantum yield of 93%. Nat. Commun. 2012, 3, 751. [CrossRef] [PubMed] Barbieri, M.A.; Kohn, A.D.; Roth, R.A.; Stahl, P.D. Protein Kinase B/akt and Rab5 Mediate Ras Activation of Endocytosis. J. Biol. Chem. 1998, 273, 19367–19370. [CrossRef] [PubMed] Bucci, C.; Thomsen, P.; Nicoziani, P.; McCarthy, J.; van Deurs, B. Rab7: A key to lysosome biogenesis. Mol. Biol. Cell 2000, 11, 467–480. [CrossRef] [PubMed] Fader, C.M.; Sánchez, D.G.; Mestre, M.B.; Colombo, M.I. TI-VAMP/VAMP7 and VAMP3/cellubrevin: Two v-SNARE proteins involved in specific steps of the autophagy/multivesicular body pathways. Biochim. Biophys. Acta Mol. Cell Res. 2009, 1793, 1901–1916. [CrossRef] [PubMed].
Figure
+4


Documento similar
dsDNA viral packaging; portal protein; T7 bacteriophage; structural biology; X-ray crystallography; cryo-electron
In con- trast, TSP-1 protein levels were significantly decreased in total cell lysates from the different ccRCC parental cell lines (786-O, RCC4 and RCC10) compared to the
Deficiency or inhibition of AurkA in the MDCK cell system of cell polarity, also leads to the loss of the cortical localization of aPKC and Par3, as well loss of
11 Deciphering the role of protein-protein interaction networks in the functional profiling of high-throughput experiments 81 11.1 Ppi networks in Gene Ontology
The development of this platform includes reporter cell lines that monitor CRM1 activity by using red fluorescent protein or green fluorescent protein-labeled HIV-1 Rev protein with
The existence of a large number of checkpoints opens the door to a specific treat- ment according to cell surface protein expression pattern of tumor cells, in
Taken together, this study demonstrates how a T cell vaccine based on a DNA prime/poxvirus boost strategy containing multiple human influenza virus epitopes can reduce viral load
To investigate whether, in our system, PLP is stored in late endosomes/lysosomes (LEs/Lys) after its internalization into the cells in the absence of neurons, as it occurs in
