Emotional eating scale for children and adolescents: psychometric characteristics in a Spanish sample
31
0
0
Texto completo
(2) 1. Abstract. The main objective of this study was to validate the Emotional Eating Scale version for children (EES-C) in a Spanish population and study the differences in emotional eating among children with binge eating (BE) overeating (OE), and no episodes of disordered eating (NED). The questionnaire was administered to 199 children between the ages of 9 and 16 years, from primary and secondary schools. Confirmatory Factor Analysis revealed five scales: eating in response to anger, anxiety, restlessness, helplessness and depression. The scale showed good internal consistency and test–retest reliability, and it showed moderate relationships with measures of Eating Disorders (ChEAT-26, QEWP-C) and psychopathology (STAI-C, CDI, CBCL). There were significant differences between the BE and NED groups (with the OE group in the middle position) in desire to eat when Anger (the girls in BE group, and the oldest children in OE group obtaining higher scores) or Helplessness were present. Eating due to Depression was higher in the older groups. A multiple regression analysis conducted using Emotional Eating as a predictor showed that anxiety-trait is the best predictor. Results support the potential utility of the EES-C in the study of emotional eating in children, and its validity in the Spanish population.. Keywords Emotional Eating, Binge Eating Disorder, children psychopathology, Loss of Control, Psychometric properties.
(3) 2. Introduction Emotional Eating (EE) has been defined by Faith, Allison, and Geliebter (1997) as eating in response to a range of negative emotions, such as anxiety, depression, anger and loneliness, to cope with negative affect. It has been outlined as a coping style related to diffuse negative emotions, but positive emotions are also reported (Van Strien, Herman & Verheijden, 2009). Eating in response to negative emotions is reportedly common among children (Tanofsky-Kraff et al., 2007), especially those who are obese (Shapiro et al., 2007), and it has been linked to loss of control eating (Shapiro et al., 2007; Tanofsky-Kraff et al., 2007). There is growing evidence that binge- and over- eating frequently occur in the absence of other eating disorder diagnoses, and they can best be contemplated as lying along a continuum from normal to disordered eating (Blackburn, Johnston, Blampied, Popp & Kallen, 2006). Problems with emotion management and regulation are associated with psychopathologies, and they are assumed to play an important role in the initiation and maintenance of binge eating. Moreover, children with symptoms of binge eating engage in eating in response to negative affect (Czaja, Rief, & Hilbert, 2009). The Binge Eating Diagnosis (BED), as defined in the 4th edition of the Diagnostic and Statistical Manual of Mental Disorders (DSM-IV-TR) (APA, 2000), includes recurrent episodes of binge eating during which subjective sense of loss of control (LOC) episodes occur that are often reported as triggered by dysphoric moods, such as depression and anxiety. Furthermore, impulsive behaviors appear to be a transdiagnostic characteristic in Eating Disorder (ED) patients, not being uncommon among other ED clinical subtypes (Favaro et al., 2005). Although the relationships among disordered eating, impulsivity and difficulties in emotional regulation have been extensively studied in adults, it is still unclear whether binge eating in children is associated with deficits in emotion regulation, and which.
(4) 3. emotion regulation strategies are problematic. Therefore, instruments that evaluate the vulnerability and risk factors of overeating and binge eating, such as emotional eating, are quite useful. The Dutch Eating Behavior Questionnaire (DEBQ; Van Strien, Fritjers, Bergers, & Defares, 1986) assesses restrained and external, but emotional, eating; however, it does not differentiate between various types of emotions. In order to facilitate investigation of the relationship between specific negative emotional states and overeating, Arnow, Kenardy, and Agras (1995) designed the Emotional Eating Scale (EES), a 25-item self-report measure scored on a 5-point Likert scale (from “no desire to eat” to “an overwhelming desire to eat”), that assesses the extent to which an individual eats in response to emotions. The EES consists of three subscales reflecting the urge to eat in response to: anger/frustration, anxiety, and depression. It was initially administered to 47 obese females with binge eating symptoms, demonstrating a strong internal consistency for the entire scale ranging from .81 (Arnow et al., 1995) to 0.93 (Waller & Osman,1998), and for each subscale: anger/frustration, anxiety, and depression (coefficient alphas, .78, .78, and .72, respectively). More recently, the EES was adapted for Children and Adolescents (EES-C) (Tanofsky-Kraff et al., 2007), for use with 8-17 year old children. Some modifications were made in the vocabulary of the EES in order to make it more accessible to children. The term “happy” was added to the original list of emotions, and a column was incorporated asking about the number of days per week the children ate in response to each emotion. The adapted instrument was completed by 205 children. Thus, the EES-C is a 25-item self-report measure used to assess the urge to cope with negative affect by eating, and it generates three subscales: depression, anger/anxiety/frustration, and feeling unsettled. Respondents rate their desire to eat in response to each emotion on a 5-point scale (No desire, Some.
(5) 4. desire, Moderate desire, Strong desire, and Very strong desire to eat). Higher scores indicate a greater reported desire to eat in response to negative mood states. The EES-C subscales have demonstrated very good internal consistency (alphas: from 0.83 to 0.95), convergent validity, and adequate temporal stability (Tanofsky-Kraff et al., 2007). The main aim of the present study was to validate the Emotional Eating Scale for children and adolescents (EES-C) (Tanofsky-Kraff et al., 2007) in the Spanish population and analyze its psychometric properties. Other objectives were to analyze the differences in emotional eating according to gender, age, weight and LOC, and study which variables predict the emotional eating, differentiating each emotion, in pre-adolescent participants.. Method Participants Children and adolescents aged 9-16 years were recruited. The clinical group consisted of 71 participants seeking weight loss treatment in the Pediatric Unit at the General Hospital (Valencia, Spain). The non clinical group (n=128) was recruited from two elementary schools in the city of Valencia. The children provided written assent, and the parents gave written consent for participation in the protocol. These studies were approved by the Ethical Committee from the General Hospital and by the respective local school boards.. Measures Children's heights were measured by a calibrated electronic stadiometer TANITA BC 418 MA (Holtain, Crymych, Wales), and their weights were measured to the nearest 0.1 kg by a calibrated digital scale (Scale-Tronix, Wheaton, IL). Body Mass Index standard deviation scores (BMI-Z) were calculated. Obesity was.
(6) 5. calculated with a z-score adjusted for sex and age. The subjects were classified as obese (over 95th percentile) or overweight (between 85th-95th percentiles) with a zscore above 2.0, and as normal weight with a z-score of less than 1.0 (Weiss, Dziura et al., 2004). Given that this classification is based on North American data, the normative data for the Spanish population were used as the correction factor (Sobradillo et al., 1988). The Emotional Eating scale adapted for children and adolescents (EES-C; Tanofsky-Kraff et al., 2007), designed for use with 8–17 year old children, is a 25item self-report questionnaire scored on a 5-point Likert scale (no desire to eat very strong desire to eat) used to assess the urge to eat in order to cope with negative affect. The psychometric properties of this English-language instrument are described above. In order to adapt and validate the Spanish version, the EES-C was translated by the first author (forward translation) and then revised by a bilingual psychologist from the USA (backward translation). The discrepancies between the two translations were resolved by a professional English translator. The Children's Depression Inventory (CDI; Kovacs, 1985). It consists of 27 Likert-type items ranging from 0 to 2 (0 indicating an absence of symptoms, 1 indicating mild symptoms, and 2 indicating definite symptoms), which assess depressive symptomatology in children. A score ≥ 19 is the criterion score for identifying clinical depression. The Spanish adaptation was used in this study (Del Barrio & Carrasco, 2004). The internal consistency of the CDI in the current sample was α=.82 for the one factor solution, for self-esteem α=.67, and for dysphoria α=.80. The State-Trait Anxiety Inventory for Children (STAIC; Spielberger, Edwards, Lushene, Montuori, & Platzek, 1973). This scale was developed to measure trait and state anxiety symptoms in children. For the analyses in the present study, we used only the trait scale, composed of 20-items, with a 3-point scale ranging from 1.
(7) 6. (almost never) to 3 (often). The scale was validated in a Spanish sample for children from 9 to 15 years of age (Seisdedos, 1990). The internal consistency of the STAIC in the current sample was α=.88. The Child Behavior Checklist for ages 4–18 (CBCL; Achenbach, 1991). The CBCL, generally accepted as an objective tool for screening symptoms of psychopathology, is a parent-reported measure of child competency and functioning in a range of behavioral domains. This 138-item rating scale yields scores for total behavior problems, internalizing and externalizing behaviors, and three scores for competence (activity, social competence, school competence). Parents rate their child on how true each item is now or within the past 6 months using the following scale: 0 = not true (as far as you know); 1 = somewhat or sometimes true; 2 = very true or often true. The CBCL generates eight clinical subscales grouped in two scales, the Internalizing scale (Withdrawn, Somatic Complaints, and Anxious/Depressed mood) and the Externalizing scale (Disruptive and Aggressive Behavior). The Spanish validated version (Albores et al., 2007) was used, with an internal consistency in the current sample ranging from .90 to .97. The Children’s Eating Attitudes Test (ChEAT; Maloney, McGuire, & Daniels, 1988) is a self-report questionnaire used to assess disordered eating attitudes among children. Each item is rated on a Likert scale from 1 (always) to 6 (never). This scale is a children’s version of the Eating Attitude Test (EAT; Garner, Olmsted, Bohr & Garfinkel, 1982). In this study, the Spanish adaptation containing 20 items (Sancho, Asorey, Arija & Canals, 2005) was used. This version of the ChEAT generates four factors: fear of and preoccupation with getting fat, social pressure to eat, food preoccupation and food restriction. The internal consistency of the ChEAT in the current sample was α=.79. With regard to each factor, for Fear of and Preoccupation with getting fat α=.71, for Social pressure to eat α=.71, for Food preoccupation α=.53, and for Food restriction α=.65..
(8) 7. The Questionnaire of Eating and Weight Patterns - Adolescent Version (QEWP-A; Johnson, Grieve, Adams, & Sandy, 1999; Johnson, Kirk & Reed, 2001). Responses to this questionnaire classify children and adolescents as: those reporting overeating (OE); those reporting binge eating behavior (BE), that is, overeating experiencing LOC, thus measuring objective binge episodes; and those reporting no episodes of disordered eating (NED), within the past six months. The QEWP-A appears to have adequate concurrent validity when correlated with measures of abnormal eating attitudes and depression (Johnson et al., 1999).. Procedure The clinical group completed all measures during an outpatient clinic visit to the Hospital. The non clinical group filled out the questionnaires during their normal school day. For all the children, in cases where they had difficulty reading or understanding the questions, trained research assistants read the questions aloud and provided simple alternative definitions for words and statements that were not understood. In order to study the temporal stability, the EES-C was administered to 40% of the original sample 1-2 months later.. Statistical Analysis Confirmatory factor analyses were conducted using the EQS 6.1 program (Bentler, 1995). Maximum Likelihood estimates with robust corrections were obtained in order to deal with violations of the normal distribution assumption. Assessment of model fit was performed using the goodness-of-fit χ2 test statistic. Another index used to assess the adequacy of each model was the comparative fit index (CFI), which compares the fit of the model to a null model and establishes the absence of relationships among the variables. Other indexes used were the GFI and AGFI fit indexes, which measure the proportion of variance-covariance.
(9) 8. accounted for by the proposed model. The standardized root mean square residual (SRMS) and the root mean squared error of approximation (RMSEA) penalize the models that are not parsimonious, and they are sensitive to misspecified factor covariance. Internal consistency (Cronbach's α's), and the interclass correlation coefficient (ICC) were calculated in order to establish the reliability. Convergent and divergent validity analyses were conducted by computing Pearson’s correlations. To assess group differences, Chi-square tests and ANOVAs were computed using F or BrownForsythe depending on the homogeneity of the samples. Tukey or Games-Howell post-hoc statistics were applied to examine the source of between-groups differences. Finally, multiple regression analyses (stepwise) were used to examine relationships between the EES-C subscales, taking into account each emotion independently as the dependent variable and the rest of the relevant variables (sex, age, weight and psychopathology measures) as independent variables. Associations and differences were considered significant when p values were ≤0.05. All analyses were conducted using SPSS for Windows, 15.0 (SPSS, Inc., Chicago, IL).. Results A total of 199 children (clinical and non clinical samples) (Mean age: 12.7±2.0 years, range: 8-17; 50.2% girls) participated in this study (Table 1). The entire clinical group (n=71) was obese/overweight (BMIZ>85-95th percentile). The non clinical sample was composed of 84 normal weight (BMI-z< 85th percentile) and 44 overweight/obese children (BMIZ>85-95th percentile). Thus, 115 (57.7%) were overweight/obese. Parents provided data about economic status. Table 1 shows the socio-demographic data of the participants..
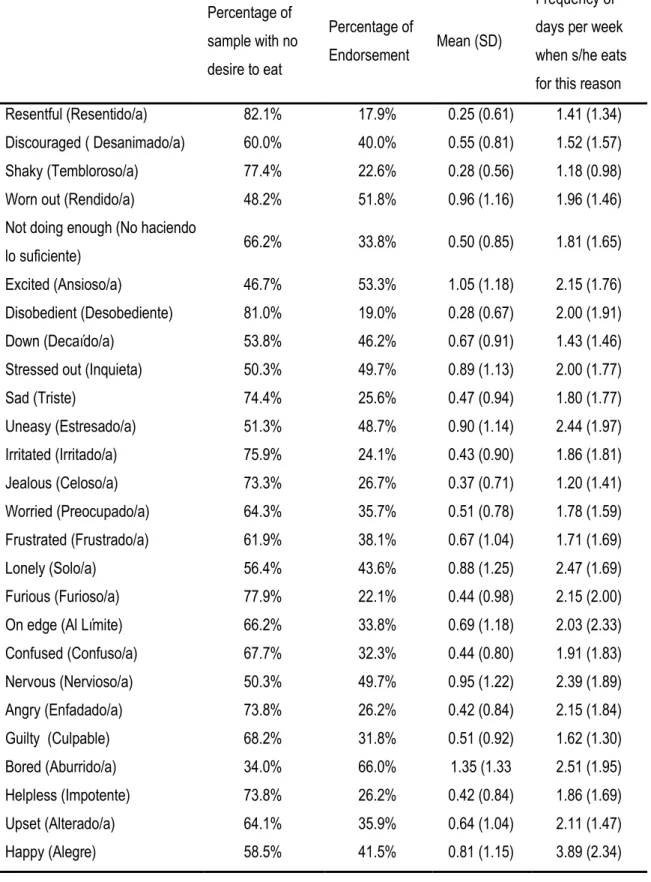
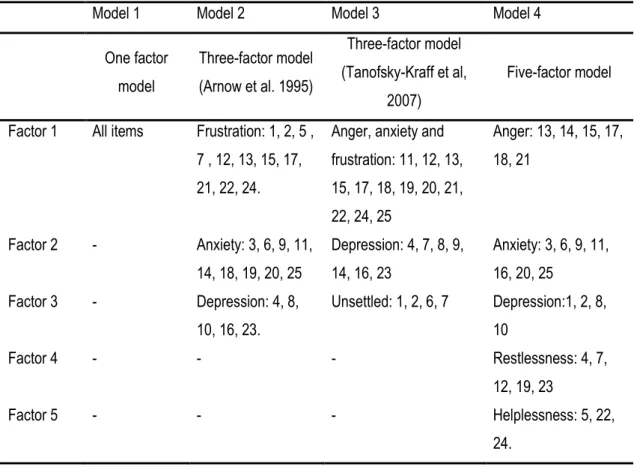
(10) 9. Insert table 1. Descriptive analysis of the items Of the 26 items listed on the EES-C, the children most commonly endorsed eating in response to feeling “bored” (66%), while feeling ”excited” (53.3%) and “worn out” (51.8%) were the second and third most common emotions reported, respectively (see Table 2). If we focus on the mean of the emotion that most often unleashes the eating response, it is again “bored”, followed by “excited”, although there was a large amount of response variability. Finally, if we take into account the frequency of days per week, the emotion that most frequently led to eating was “happy”, followed by “bored” and “lonely”. In contrast, the highest percentage of the sample who never had the desire to eat were acting in response to feeling “resentful” (82.1%), followed by “disobedient” (81.0%) and “furious” (77.9%).. Insert table 2. Confirmatory Analysis Four models of the Emotional Eating Scale (excluding the adjective “happy” for these analyses) were selected to be compared on adequacy fit. Table 3 shows the items for each model. Model 1 tested a single-factor model composed of only one factor structure that included all the EES-C items. This model is used as a baseline model against which to test alternative factorial structures. Model 2 corresponds to the original factorization by Arnow et a.l, (1995) of the Emotional Eating Scale. The first factor in Arnow’s model consists of emotions related to anger, the second to anxiety, and the third to depression. The third model is a structure of three factors (anxiety, depression and unspecified factor) developed in the original children’s version of the EES created by Tanofsky-Kraff et al., (2007)..
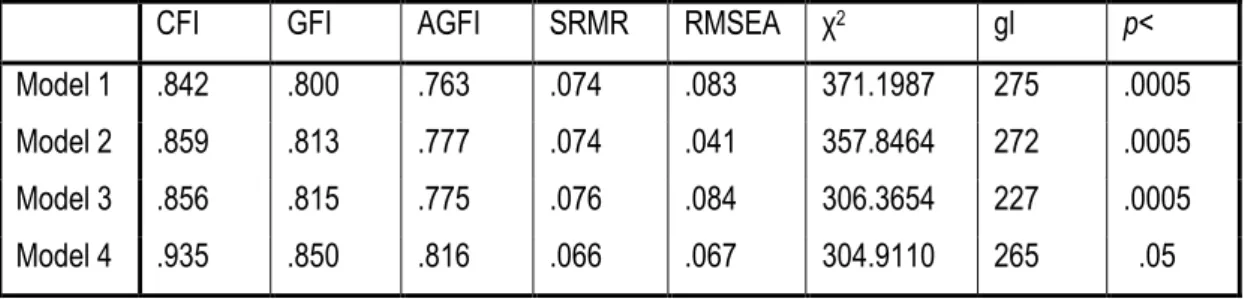
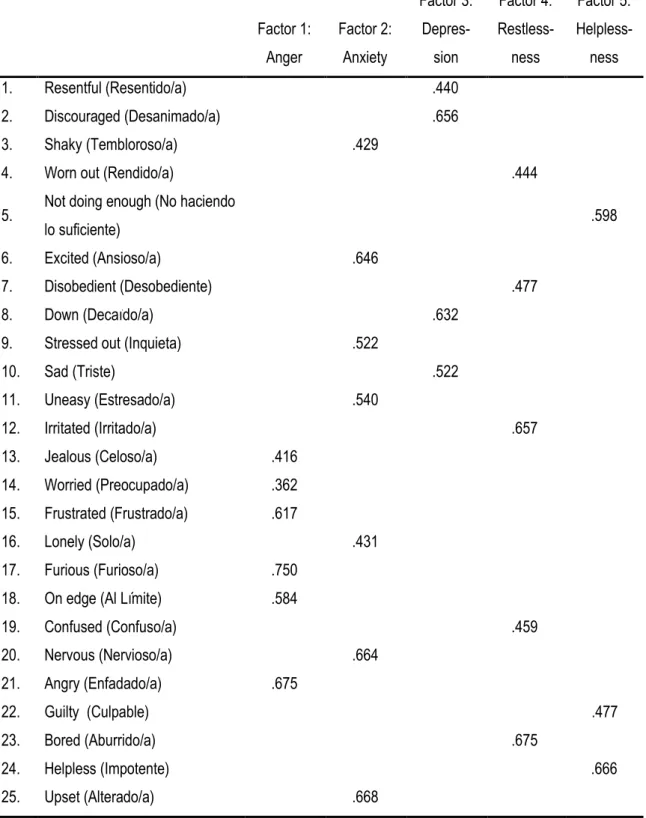
(11) 10. The fourth model is the result of a previous exploratory factor analysis that yielded a five-factor model consisting of Anger, Anxiety, Depression, Restlessness and Helplessness.. Insert table 3. The four models were compared with regard to their adequacy of fit using Hu and Bentler’s (1995, 1999) recommended approach to fit criteria; a small χ2 of a model means better fit to the data. The other criteria indices for goodness of fit used were: CFI >.90, GFI and AGFI >.90, SRMS<.08 and RMSEA of <.05 (Bentler & Bonet, 1980). Table 4 summarizes the fit indices for the four models.. Insert table 4. The baseline single-factor model fit the data poorly in comparison with all the fit criteria. The fit of model 2 (three factors based on Arnow’s (1998) factorization) was poor relative to the observed data, with a CFI less than .90, although the SRMR was <.05. Model 3 (three factors based on the Tanofsky-Kraff et al., (2007) factorization) also had a relatively poor fit to the data. According to the fit indices, the five-factor model solution, which included anger, anxiety, restlessness, helplessness and depression, was the model that best represented the observed data. The five-factor model was the one with the smallest χ2, while, on the other hand, the CFI, GFI and AGFI indexes for this model were >.80, and the SRMR, and RMSEA were < .07. Table 5 shows the factor loadings of the items on their respective factors.. Insert table 5.
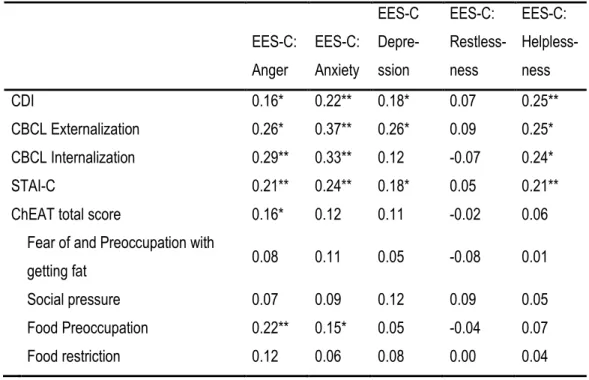
(12) 11. Reliability All five subscales demonstrated good internal consistency. Cronbach’s alphas were: for ESS-C-Anger, 0.74; for ESS-C-Anxiety, 0.75; for ESS-C-Depression, 0.64; for ESS-C-Restlessness, 0.67; and for ESS-C-Helplessness, 0.60, with this latter factor showing the least amount of internal consistency. With regard to temporal stability (one-two months; n: 78 participants from the original sample), the interclass correlation coefficient was calculated. The correlation was: for ESS-CAnger, 0.79 (0.71-0.85); for ESS-C-Anxiety, 0.84 (0.79-0.89); for ESS-CDepression, 0.69 (0.57-0.79); for ESS-C-Restlessness, 0.82 (0.76-0.88); and for ESS-C-Helplessness, 0.77 (0.67-0.84).. Convergent and Divergent Validity Analyses The convergent and divergent validity of the EES-C (Table 6) was calculated using Pearson’s product–moment correlations with other relevant measures of eating, mood, and behavior problems, such as ChEAT, CDI, STAI and Externalization/ Internalization CBCL factors. With the exception of the Restlessness factors, the rest of the factors on the EES-C presented small-medium positive correlations with mood measures (CDI, STAI) and the externalization and internalization scales from the CBCL. However, eating psychopathology only presented correlations with Anger and Anxiety from the EES-C, mainly “Food Preoccupation” from the ChEAT. Insert table 6. Differences among groups in ESS-C To assess group differences in each emotion related to eating behavior, the participants were divided according to their responses on the QEWP-A. In other words, depending on their LOC pattern, several analyses of variance were.
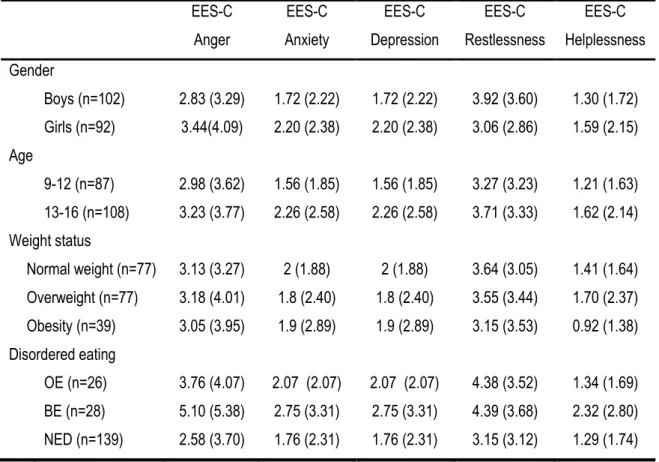
(13) 12. conducted. Children were categorized into three eating behavior groups for analysis: those reporting at least one eating episode with overeating (OE) in the past six months (n: 26), one binge eating (BE) episode (n: 28), or no episodes of disordered eating (NED) (n: 138). Table 7 shows the means (SD) for emotional eating in each group. First, ANOVAs were performed to assess group differences. Additionally, taking into account the possibility that gender, age (9-12 year old and 13-16 year old groups), and weight (normal weight, overweight and obese groups) were likely to impact our independent and dependent variables, general Factorial ANOVAs were performed to control these variables; thus, main effects and interaction analyses (interactions of emotion X gender/age/weight) were analyzed.. Insert table 7. Differences among groups were found in eating due to Anger (F(2,190): 6.17; p< .003; Ŋ2p: .06). Post-hoc comparison (Games-Howell) revealed significant differences between the BE and NED groups (p< .05). There were no differences between boys and girls in eating due to Anger, and the LOC x Gender interaction was not significant; however, the main effect of LOC remained significant (F(2,187): 6.49; p< .002; Ŋ2p: .06). There were no differences among the three weight groups in eating due to Anger, and the LOC x Weight interaction was not significant; however, the main effect of LOC remained significant (F(2,183): 5.83; p< .003; Ŋ2p: .06). Finally, there were no differences between the two age groups in eating due to Anger; however, the LOC x Age interaction was significant (F(2,187): 3.24; p< .04; Ŋ2p: .03), and the main effect of LOC remained significant (F(2,187): 5.82; p< .004; Ŋ2p: .05). Post-hoc comparison (Games-Howell) revealed significant differences between the BE and NED groups (p< .05), but the OE group followed a different.
(14) 13. pattern depending on their age, with only the older group being similar in eating due to anger. Regarding eating related to Helplessness, significant differences were found in the LOC groups (F(2,191): 3.38; p< .04 Ŋ2p: .03). Post-hoc comparison (GamesHowell) revealed significant differences between the BE and NED groups (p< .05). There were no differences between the age groups in eating due to Helplessness, the LOC x Age interaction was not significant, and the main effect of LOC lost its statistical significance (F(2,193): 2.77; p< .06). Moreover, there were no differences among the weight groups in eating due to Helplessness, and the LOC x Weight interaction and the main effect of LOC were not significant. Finally, there were no differences in gender with regard to eating due to Helplessness, but the LOC x Gender interaction was significant (F(2,188): 4.53; p< .01; Ŋ2p: .05), and the main effect of LOC remained significant (F(2,188): 4.12; p< .02; Ŋ2p: .04). Post-hoc comparison (Games-Howell) revealed significant differences between the BE and NED groups (p< .05), but the girls in the BE group obtained higher scores than the rest of the groups. There were no differences among the disordered eating groups with regard to LOC on Anxiety (p< .113), or on Restlessness (p< .06), although it was nearly significant, or on Depression (p< .02). The general Factorial ANOVAs were also performed for these variables, and there were no significant differences, with the exception of Depression, where the main effect of age was significant (F(1,188): 8;40 p< .004; Ŋ2p: .04), with the older group scoring higher on eating related to depression.. Predictors of Emotional Eating A multiple regression analysis was conducted using as predictors of Emotional Eating the scores on the STAI-C, CDI, CBCL, ChEAT, sex, age, BMIz.
(15) 14. and LOC episodes (see Table 8). Several stepwise regression analyses performed separately for each emotion showed that the desire to eat in the presence of Anger was predicted by the STAI-C (R2=.22%; F(1,78)=22.05, p<. 001). The desire to eat in the presence of feelings of Helplessness was predicted by the STAI-C and age (R2= 23%; F(1,77)=11.37, p<.001). The urge to eat in the presence of Depression was predicted by the STAI-C and age (R2= 15%; F(1,79)=6.78, p<. 002). The urge to eat in the presence of Anxiety was predicted by the STAI-C (R2= 9%; F(1,79)=7.73, p<.007), and the urge to eat in the presence of Restlessness was not predicted by anything.. Insert table 8. Given that Anxiety appears in all the regression analysis models, we analyzed the stepwise regression analysis taking out the STAI-C (trait) measure. Regression analysis performed separately for each emotion shows that the urge to eat in the presence of Anger was predicted by the ChEAT scores (R2= 14%; F(1,77)=12.7, p=.001). The urge to eat in the presence of feelings of Helplessness was predicted by the CDI scores (R2= 17%; F(1,77)=16.1, p<.001). The desire to eat in the presence of Depression was predicted by a model comprised of CDI, Age, and Externalization CBCL scores (R2= 18%; F(1,77)=5.35; p<.002). The urge to eat in the presence of Anxiety was predicted by Externalization CBCL scores (R2= 9%; F(1,77)=7.73; p<.007), and the urge to eat in the presence of Restlessness was not predicted by anything.. Discussion The main objective of the present study was to validate the Emotional Eating Scale for children and adolescents (EES-C) (Tanofsky-Kraff et al., 2007) in the.
(16) 15. Spanish population. A descriptive analysis of the items showed that children reported eating most frequently in response to feeling bored, excited and worn out. In contrast, the higher percentages associated with having no desire to eat were for feeling resentful and disobedient. Regarding their psychometric properties, the results indicated that the Spanish translated EES-C is an internally consistent (range 0.60-0.75), stable (0.69-0.89) and valid tool for evaluating the need to eat induced by mood. The CFA revealed that the EES-C factorial structure is composed of five factors assessing the desire to eat due to: Anger, Anxiety, Depression, Restlessness and Helplessness. This structure is similar to the one obtained by Tanofsky-Kraff et al (2007) (Anxiety/Anger/Frustration and Unsettled subscales), but more refined. With the exception of the Restlessness subscale, which did not correlate with anything, the rest of the subscales presented small-medium positive correlations with the externalization and internalization scales from the CBCL, and with both anxiety (as trait) and depression. These results do not agree with the findings from the Tanofsky-Kraff study, which showed no relationships with trait anxiety or with externalizing behaviors. Although in the present study there are associations between the EES-C and mood and externalization/externalization measures, it should be pointed out that the strength of the relationships was low-to-moderate, so that these constructs are clearly different, but partially related. Finally, it should be highlighted that the eating psychopathology measures only presented correlations with Anger and Anxiety from the EES-C, mainly “Fear of and preoccupation with getting fat” from the ChEAT. Regarding the differences in emotional eating, there were no differences among groups in their desire to eat due to Anxiety or Restlessness. However, there were significant differences between the BE and NED groups (with the OE group in the middle position) in the desire to eat when Anger or Helplessness were present..
(17) 16. In the case of Helplessness, gender has a clear influence since the girls had higher scores in the BE condition. In the case of eating due to Anger, these differences were not influenced by gender or weight; however, while age had no influence in the BE or NED groups, being older in the OE group was also related to a greater frequency of eating due to Anger. Finally, although there were no differences among the LOC groups on eating due to Depression, the influence of age was significant, with the older groups obtaining higher scores on their desire to eat when this mood was present. Finally, the regression analysis showed the importance of trait-anxiety as a predictor of emotional eating, as it is always present in the equation of any emotion of the EES-C. Thus, after not including it in successive analyses in order to analyze its influence on the other variables, eating due to Anxiety was predicted by Externalization, eating for Helplessness was predicted by the CDI, eating for Depression was predicted by a model composed of CDI, age and Externalization, and finally, eating due to Anger was predicted by the measure of eating psychopathology, the ChEAT score. Taking together, our results agree with those of Van Strien and Oosterveld (2008), who indicated that most young children show a biologically natural reaction to emotional stressors (loss of appetite when feeling lonely, depressed, or afraid), since most states of arousal reduce gut activity, and that for most people emotional overeating may only start to occur later in life. In the present study, a tendency to eat for Depression and Anger could be observed as the participants got older. The emergence of emotional eating is of great interest due to its low prevalence in young children and its strong link with binging in adolescent and (adult) clinical samples, where the emotions of Anger and Depression stand out. In this sense, in a recent study carried out with adult subclinical ED women, Fox and Froom (2009) found strong correlations between disordered eating and the negative emotions, but.
(18) 17. only anger and sadness were left as significant contributors to disordered eating within the regression analysis. Finally, it should be pointed out that the OE group becomes a risk group as, without having lost control of eating, this group eats large amounts of food and is always in the middle position between the group that has episodes of binging and the one that has no disordered eating episodes. This combination of over-eating and experiencing negative emotions, especially Anger or Depression, could place the adolescent in danger of suffering more serious problems in the future. More research is needed to study the development of anomalous eating patterns in adolescence. There are a number of limitations that must be taken into account. The first is the size of the sample which, according to the number of items on the EES-C, should be somewhat larger, although it is slightly larger than the one used in the study by Tanofsky-Kraff et al. (2007). The fact that all the data are self-reported may also be another limitation. Methodologically there is another limitation; the factorial structure developed in the present study (five factors) was obtained in an exploratory analysis of the same sample that was used for the confirmatory factor analysis. In future research, a replication of the analysis should be carried out with a different sample. One of the strengths of the present study is that part of the sample was extracted from a Clinical setting (Pediatric Unit specialized in childhood weight loss treatment), so that a broad spectrum of children was obtained, and not only from the community. Another strength is that multi-informant data was used, including the parents’ answers about the presence of psychopathology in children on the CBCL questionnaire. This study has shown that different emotions affect emotional eating in children in different ways, so that emotional eating should not be understood as a.
(19) 18. unique construct, but rather as multifactorial. Future research should analyze the relationships between the emotions evaluated with the EES-C and eating habits or diet in children, and measure the possible presence of emotional eating in the parents or the feeding practices. Some results have corroborated the heritability of eating behavior, and findings have shown that higher levels of emotional eating by parents are related to higher levels of adolescents’ emotional eating (Snoek, Engels, Janssens & Van Strien, 2007; Van Strien, Van Niekerk & Ouwens, 2009). It would also be interesting to adapt the EES-C to an ecological momentary assessment protocol, wherein children can rate their moods immediately before, during, and after eating. Disordered eating seems to be related to personal vulnerabilities and the learning or development of maladaptive coping strategies. In adults, these interactions are starting to become clearer; in the case of children and adolescents, more research is needed.. Acknowledgements. We thank Dr. Marian Tanosfsky-Kraff for granting us permission to adapt the Emotional Eating Scale for Children and Adolescents and Dr. Bruce Arnow for his kind response. CIBER Fisiopatología de la Obesidad y Nutrición is an initiative of ISCIII”.
(20) 19. References Achenbach, T.M. (1991). Manual for the Child Behavior Checklist/4-18 and 1991 profile. Burlington, VT: University of Vermont. Albores, L., Lara-Muñoz, C., Esperón-Vargas, C., Cárdenas, J.A., Pérez, A.M., & Villanueva, G. (2007). Validez y fiabilidad del CBCL/6-18. Actas Españolas de Psiquiatría, 35, 393-399. American Psychiatric Association. (2000). Diagnostic and Statistical Manual of Mental Disorders, Text Revision, 4th ed. Washington, DC: American Psychiatric Association. Arnow, B., Kenardy, J., & Agras, W. (1995). The emotional eating scale: The development of a measure to assess coping with negative affect by eating. International Journal of Eating Disorders, 18, 79–90. Blackburn, S., Johnston, L., Blampied, N., Popp, D., & Kallen, R. (2006). An application of escape theory to Binge Eating. European Eating Disorders Review 14, 23–31. Bentler, P.M., & Bonett, D.G. (1980). Significance tests and goodness of fit in the analysis of covariance structures, Psychological Bulletin, 47, 541-70. Bentler, P.M. (1995). EQS structural equations program manual. Multivariate Software, Encino, CA. Czaja, J., Rief, W., & Hilbert, A. (2009). Emotion Regulation and Binge Eating in Children. International Journal of Eating Disorders, 42, 356–362. Del Barrio, M.V., & Carrasco, M.A. (2004). Manual del Inventario de Depresión Infantil de Kovacs. Madrid: TEA-Ediciones. Faith, M.S., Allison, D.B., & Geliebter, A. (1997). Emotional eating and obesity: Theoretical considerations and practical recommendations. In Dalton, S. (Ed). Obesity and Weight Control: The Health Professional’s Guide to understanding and Treatment (pp. 439–465). Gaithersburg, MD, Aspen..
(21) 20. Favaro, A., Zanetti, T., Tenconi, E., Degortes, D., Ronzan, A., Veronese, A., & Santonastaso, P. (2005). Temperament and impulsive behaviors in Eating Disordered subjects. Eating Disorders, 13, 61–70. Fox, R.E., & Froom, K. (2009). Eating Disorders: A Basic Emotion Perspective. Clinical Psychology and Psychotherapy, 16, 328–335. Garner, D.M., Olmsted, M.P., Bohr, Y., & Garfinkel, P.E. (1982). The Eating Attitudes Test: psychometric features and clinical correlates. Psychological Medicine, 12, 871–878. Hu, L.T., & Bentler, P.M. (1995). Evaluating model fit. In R.H. Hoyle (Ed.), Structural equation modelling: Concepts, issues, and applications (pp. 76–99). Thousand Oaks, CA: Sage. Hu, L.T., & Bentler, P.M. (1999). Cut-off criteria for fit indexes in covariance structure analysis: conventional criteria versus new alternatives. Structural Equation Modelling, 6, 1-55. Johnson W.G., Grieve, F.G., Adams, C.D., & Sandy, J. (1999). Measuring binge eating in adolescents: Adolescent and parent versions of the questionnaire of eating and weight patterns. International Journal of Eating Disorders, 26, 301– 314. Johnson W.G., Kirk, A.A., & Reed, A.E. (2001). Adolescent version of the Questionnaire of Eating and Weight Patterns: Reliability and Gender Differences. International Journal of Eating Disorders, 29, 94-97. Kovacs M. (1985). The children depression inventory (CDI). Psychopharmacology Bulletin, 21, 995-998. Maloney, M.J., McGuire, J.B., & Daniels, S.R. (1988). Reliability testing of a children's version of the Eating Attitude Test. Journal of the American Academy of Child and Adolescent Psychiatry, 27, 541–543..
(22) 21. Sancho, C., Asorey, O., Arija, V., & Canals, J. (2005). Psychometric characteristics of the children's eating attitudes test in a Spanish sample. European Eating Disorders Review. 13, 338–343. Seisdedos, N. (1990). STAI-C, Cuestionario de Autoevaluación. Madrid. TEA Ediciones S.A. Shapiro, J.R., Woolson, S.L., Hamer, R.M., Kalarchian, M.A., Marcus, M.D., & Bulik, C.M. (2007). Evaluating binge eating disorder in children: Development of the children's binge eating disorder scale (C-BEDS). International Journal of Eating Disorders, 40, 82–89. Smolak, L., & Levine, M.P. (1994). Toward an empirical basis for primary prevention of eating problems with elementary school-children. Eating Disorders: The Journal of Treatment and Prevention, 2, 293-307. Snoek, H., Van Strien, T., Janssens, J., & Rutger, C.M. (2007). Emotional, external, restrained eating and overweight in Dutch adolescents. Scandinavian Journal of Psychology, 48, 23-32. Sobradillo, B., Aguirre, A., Aresti, U., Bilbao, A., Fernandez-Ramos, C., Lizárraga, A., Loranzo, H., Madariaga, L., Rica, I., Ruiz, I., Sánchez, E., Santamaría, C., Serrano, J.M., Zabala, A., Zurimendi, B., & Hernandez, M. (1988). Curvas y tablas de crecimiento (Estudios longitudinal y transversal). Fundación Faustino Orbegozo Eizaguirre. Spielberger, C.D., Edwards, C.D., Lushene, R.E., & Platzek. D. (1973). Manual for the State Trait Anxiety Inventory for Children (STAI-C). Palo Alto, California: Consulting Psychologist Press. Tanofsky-Kraff, M., Theim, K., Yanovski, S., Bassett, A., Burns, N., Ranzenhofer, L., Glasofer, D. & Yanovski, J. (2007). Validation of the Emotional Eating Scale Adapted for Use in Children and Adolescents (EES-C). International Journal of Eating Disorders, 40, 232–240..
(23) 22. Van Strien, T., & Oosterveld, P. (2008). The Children’s DEBQ for Assessment of Restrained, Emotional, and External Eating in 7- to 12-Year-old Children. International Journal of Eating Disorders, 41, 72–81. Van Strien, T., Fritjers, J. E. R., Bergers, G. P. A., & Defares, P. B. (1986). Dutch Eating Behaviour Questionnaire for assessment of restrained, emotional and external eating behaviour. International Journal of Eating Disorders, 5, 295–315. Van Strien, T., van Niekerk, R., & Ouwens, M. (2009). Perceived parental food controlling practices are related to obesogenic or leptogenic child life style behaviors. Appetite, 53, 151-154. Van Strien, T., Herman, C.P., & Verheijden, M. W (2009). Eating style, overeating, and overweight in a representative Dutch sample. Does external eating play a role?. Appetite, 52, 380–387. Waller, G., & Osman, S. (1998). Emotional eating and eating psychopathology among non eating-disordered women. International Journal of Eating Disorders, 23, 419-424. Weiss, R., Dziura, J., Burgert, T.S., Tamborlane, W.V., Taksali, S.E., Yeckel, C.W., Allen, K., Lopes, M., Savoye, M., Morrison, J., Sherwin, R.S., & Caprio, S. (2004). Obesity and the metabolic syndrome in children and adolescents. New England Journal of Medicine, 350, 2362-74..
(24) 23. Table 1. Participants’ socio-demographic data. Clinic overweight (n= 71 ). No Clinic Overweight (n= 44). Normal Weight (n=84). Total (n=199). n. %. n. %. n. %. n. %. Boy. 38. 53.5 %. 26. 59.1 %. 40. 47.6 %. 104. 49.8 %. Girl. 33. 46.5 %. 18. 40.9 %. 44. 52.4 %. 95. 50.2 %. 9 to 12. 39. 54.9 %. 17. 38.6 %. 32. 38.1 %. 88. 44.2 %. 13 to 16. 32. 45.1 %. 27. 61.4 %. 52. 61.9 %. 111. 55.7 %. 21. 30% %. 16. 34.7 %. 24. 53.3 %. 61. 37.8 %. 41. 58.5 %. 7. 15.2 %. 19. 42.2 %. 67. 41.6 %. 8. 11.4 %. 23. 50 %. 2. 4.4 %. 33. 20.5 %. Sex. Age. Economic status Low or Middle low Middle Middle high/high.
(25) 24. Table 2. Percentage of sample with no desire to eat, percentage of participants who endorse eating in response to each EES-C emotion, mean (SD) for each emotion, and frequency of days when s/he eats because of feeling this emotion Percentage of sample with no desire to eat. Frequency of Percentage of Endorsement. Mean (SD). days per week when s/he eats for this reason. Resentful (Resentido/a). 82.1%. 17.9%. 0.25 (0.61). 1.41 (1.34). Discouraged ( Desanimado/a). 60.0%. 40.0%. 0.55 (0.81). 1.52 (1.57). Shaky (Tembloroso/a). 77.4%. 22.6%. 0.28 (0.56). 1.18 (0.98). Worn out (Rendido/a). 48.2%. 51.8%. 0.96 (1.16). 1.96 (1.46). 66.2%. 33.8%. 0.50 (0.85). 1.81 (1.65). Excited (Ansioso/a). 46.7%. 53.3%. 1.05 (1.18). 2.15 (1.76). Disobedient (Desobediente). 81.0%. 19.0%. 0.28 (0.67). 2.00 (1.91). Down (Decaído/a). 53.8%. 46.2%. 0.67 (0.91). 1.43 (1.46). Stressed out (Inquieta). 50.3%. 49.7%. 0.89 (1.13). 2.00 (1.77). Sad (Triste). 74.4%. 25.6%. 0.47 (0.94). 1.80 (1.77). Uneasy (Estresado/a). 51.3%. 48.7%. 0.90 (1.14). 2.44 (1.97). Irritated (Irritado/a). 75.9%. 24.1%. 0.43 (0.90). 1.86 (1.81). Jealous (Celoso/a). 73.3%. 26.7%. 0.37 (0.71). 1.20 (1.41). Worried (Preocupado/a). 64.3%. 35.7%. 0.51 (0.78). 1.78 (1.59). Frustrated (Frustrado/a). 61.9%. 38.1%. 0.67 (1.04). 1.71 (1.69). Lonely (Solo/a). 56.4%. 43.6%. 0.88 (1.25). 2.47 (1.69). Furious (Furioso/a). 77.9%. 22.1%. 0.44 (0.98). 2.15 (2.00). On edge (Al Límite). 66.2%. 33.8%. 0.69 (1.18). 2.03 (2.33). Confused (Confuso/a). 67.7%. 32.3%. 0.44 (0.80). 1.91 (1.83). Nervous (Nervioso/a). 50.3%. 49.7%. 0.95 (1.22). 2.39 (1.89). Angry (Enfadado/a). 73.8%. 26.2%. 0.42 (0.84). 2.15 (1.84). Guilty (Culpable). 68.2%. 31.8%. 0.51 (0.92). 1.62 (1.30). Bored (Aburrido/a). 34.0%. 66.0%. 1.35 (1.33. 2.51 (1.95). Helpless (Impotente). 73.8%. 26.2%. 0.42 (0.84). 1.86 (1.69). Upset (Alterado/a). 64.1%. 35.9%. 0.64 (1.04). 2.11 (1.47). Happy (Alegre). 58.5%. 41.5%. 0.81 (1.15). 3.89 (2.34). Not doing enough (No haciendo lo suficiente).
(26) 25. Table 3. Items that compose the four models compared for their adequacy of fit. Model 1. Factor 1. Model 2. One factor. Three-factor model. model. (Arnow et al. 1995). All items. Model 3. Model 4. Three-factor model (Tanofsky-Kraff et al,. Five-factor model. 2007). Frustration: 1, 2, 5 ,. Anger, anxiety and. Anger: 13, 14, 15, 17,. 7 , 12, 13, 15, 17,. frustration: 11, 12, 13,. 18, 21. 21, 22, 24.. 15, 17, 18, 19, 20, 21, 22, 24, 25. Factor 2 Factor 3. -. Anxiety: 3, 6, 9, 11,. Depression: 4, 7, 8, 9,. Anxiety: 3, 6, 9, 11,. 14, 18, 19, 20, 25. 14, 16, 23. 16, 20, 25. Depression: 4, 8,. Unsettled: 1, 2, 6, 7. Depression:1, 2, 8,. 10, 16, 23. Factor 4. -. -. 10 -. Restlessness: 4, 7, 12, 19, 23. Factor 5. -. -. -. Helplessness: 5, 22, 24..
(27) 26. Table 4. Goodness-of-fit indices of the four factor models. CFI. GFI. AGFI. SRMR. RMSEA. χ2. gl. p<. Model 1. .842. .800. .763. .074. .083. 371.1987. 275. .0005. Model 2. .859. .813. .777. .074. .041. 357.8464. 272. .0005. Model 3. .856. .815. .775. .076. .084. 306.3654. 227. .0005. Model 4. .935. .850. .816. .066. .067. 304.9110. 265. .05. CFI: Comparative Fit Index; GFI: Goodness of Fit Index; AGFI: Adjusted Goodness of Fit Index; SRMR: Standardized RMR; RMSEA: Root Mean-Square Error of Approximation..
(28) 27. Table 5. Saturations table of the five-factor model of the EES-C. Factor 3:. Factor 4:. Factor 5:. Factor 1:. Factor 2:. Depres-. Restless-. Helpless-. Anger. Anxiety. sion. ness. ness. 1.. Resentful (Resentido/a). .440. 2.. Discouraged (Desanimado/a). .656. 3.. Shaky (Tembloroso/a). 4.. Worn out (Rendido/a). 5.. .429 .444. Not doing enough (No haciendo. .598. lo suficiente). 6.. Excited (Ansioso/a). .646. 7.. Disobedient (Desobediente). 8.. Down (Decaído/a). 9.. Stressed out (Inquieta). 10.. Sad (Triste). 11.. Uneasy (Estresado/a). 12.. Irritated (Irritado/a). 13.. Jealous (Celoso/a). .416. 14.. Worried (Preocupado/a). .362. 15.. Frustrated (Frustrado/a). .617. 16.. Lonely (Solo/a). 17.. Furious (Furioso/a). .750. 18.. On edge (Al Límite). .584. 19.. Confused (Confuso/a). 20.. Nervous (Nervioso/a). 21.. Angry (Enfadado/a). 22.. Guilty (Culpable). 23.. Bored (Aburrido/a). 24.. Helpless (Impotente). 25.. Upset (Alterado/a). .477 .632 .522 .522 .540 .657. .431. .459 .664 .675 .477 .675 .666 .668.
(29) 28. Table 6. Pearson’s product-moment correlations among EES-C factors and psychopathology measures. EES-C. EES-C:. EES-C:. EES-C:. EES-C:. Depre-. Restless- Helpless-. Anger. Anxiety. ssion. ness. ness. CDI. 0.16*. 0.22**. 0.18*. 0.07. 0.25**. CBCL Externalization. 0.26*. 0.37**. 0.26*. 0.09. 0.25*. CBCL Internalization. 0.29**. 0.33**. 0.12. -0.07. 0.24*. STAI-C. 0.21**. 0.24**. 0.18*. 0.05. 0.21**. ChEAT total score. 0.16*. 0.12. 0.11. -0.02. 0.06. 0.08. 0.11. 0.05. -0.08. 0.01. Social pressure. 0.07. 0.09. 0.12. 0.09. 0.05. Food Preoccupation. 0.22**. 0.15*. 0.05. -0.04. 0.07. Food restriction. 0.12. 0.06. 0.08. 0.00. 0.04. Fear of and Preoccupation with getting fat. ** p<0,01; * p<0,05 CDI: Child Depression Inventory; CBCL: Child Behaviour Checklist; STAI-C: The State-Trait Anxiety Inventory for Children (only Trait); CHEAT: Child Eating Attitudes Test..
(30) 29. Table 7. Means (SD) of EES-C factors in each group EES-C. EES-C. EES-C. EES-C. EES-C. Anger. Anxiety. Depression. Restlessness. Helplessness. Boys (n=102). 2.83 (3.29). 1.72 (2.22). 1.72 (2.22). 3.92 (3.60). 1.30 (1.72). Girls (n=92). 3.44(4.09). 2.20 (2.38). 2.20 (2.38). 3.06 (2.86). 1.59 (2.15). 9-12 (n=87). 2.98 (3.62). 1.56 (1.85). 1.56 (1.85). 3.27 (3.23). 1.21 (1.63). 13-16 (n=108). 3.23 (3.77). 2.26 (2.58). 2.26 (2.58). 3.71 (3.33). 1.62 (2.14). Normal weight (n=77). 3.13 (3.27). 2 (1.88). 2 (1.88). 3.64 (3.05). 1.41 (1.64). Overweight (n=77). 3.18 (4.01). 1.8 (2.40). 1.8 (2.40). 3.55 (3.44). 1.70 (2.37). Obesity (n=39). 3.05 (3.95). 1.9 (2.89). 1.9 (2.89). 3.15 (3.53). 0.92 (1.38). OE (n=26). 3.76 (4.07). 2.07 (2.07). 2.07 (2.07). 4.38 (3.52). 1.34 (1.69). BE (n=28). 5.10 (5.38). 2.75 (3.31). 2.75 (3.31). 4.39 (3.68). 2.32 (2.80). NED (n=139). 2.58 (3.70). 1.76 (2.31). 1.76 (2.31). 3.15 (3.12). 1.29 (1.74). Gender. Age. Weight status. Disordered eating. OE= eating episode with overeating; BE: binge eating episode; NED: no episodes of disordered eating..
(31) 30. Table 8. Multiple regression predictors of Emotions assessed by EES-C Including STAI stepwise. Not including STAI stepwise. regression model. regression model. Prediction variables. β. t. STAI-C. .500. 5.03**. STAI-C. .314. 2.90**. STAI-C. .332. 3.13**. Age. .268. 2.52*. EES-C. β. t. .375. 3.56**. .299. 2.78**. CDI. .223. 2.08*. Age. .261. 2.50*. .217. 2.27*. .411. 4.01**. Anger ChEAT. Anxiety CBCL Externalization. Depression. CBCL Externalization Restlessness ------. -----. Helplessness STAI-C. .468. 4.66**. Age. .232. 2.30*. CDI. ** p<0,01; * p<0,05 CDI: Child Depression Inventory; CBCL: Child Behavior Checklist; STAI-C: The State-Trait Anxiety Inventory for Children (only Trait); ChEAT: Child Eating Attitudes Test..
(32)
Figure
+3
Documento similar
The aim of this study was to examine the risk of eating disorders in a sample of Spanish disabled high level sportsmen and sportswomen and to analyze its relationship with
For a short explanation of why the committee made these recommendations and how they might affect practice, see the rationale and impact section on identifying children and young
The expansionary monetary policy measures have had a negative impact on net interest margins both via the reduction in interest rates and –less powerfully- the flattening of the
Jointly estimate this entry game with several outcome equations (fees/rates, credit limits) for bank accounts, credit cards and lines of credit. Use simulation methods to
Considering the wide cultural and language differences between Spain and Mexico, the aim of this study was to test the psychometric properties of a new version of the SURPS
The Spanish translation version of the PAQ-C questionnaire for the assessment of physical activity in Spanish children aged between 8 and 14 years show a good test-retest
This paper presents a Spanish version of the NEP Scale for Children, examines children’s ecological beliefs according to sociodemographic variables as well as
The aim of this study is to carry out the process of translation and adaptation to Spanish of the locus of control in sport’s scale for children (Tsai and Hsieh, 2015) and to
