TítuloGenomic variation and evolution of the H/F group of human endogenous retroviruses in primates
23
0
0
Texto completo
(2) Index. 1. Introduction 1.1.Endougenous retrovirus 1.2.Background of human endogenous retroviruses (HERVs) 2. Material and methods 2.1.Search of HERV-H/F sequences. 2.2.Identification of the target sites duplications 2.3.Dating the retrovirus insertion 2.4.Assessment of the different regions of the proviral insertion 2.5. Testing the hypothesis about the role of selection on the evolution of the HERV-H/F group. 2.6.Phylogenetic reconstruction of each proviral region. 3. Results 3.1.Search of HERV-H/F sequences. 3.2.Identification of the target sites duplications 3.3.Dating the retrovirus insertion 3.4.Assessment of the different regions of the proviral insertion the. 3.5. Testing the hypothesis about the role of selection on the evolution of HERV-H/F group. . 3.6.Phylogenetic reconstruction of each proviral region. 4.Discusion and conclusions. 4.1.Found HERV-H/F sequences 4.2. Hypothesis about the role of selection on the evolution of the HERVH/F group. 5. BIBLIOGRAPHY.
(3) 1. Introduction. 1.1 Endougenous retrovirus. One of the discoveries resulting from the human genome sequenciation is that around 8% of it has originated from infectious retroviruses sequences. that are. characterized for possess at least three genes : gag (encoding structural proteins), pol (containing viral enzymes codifying regions such as retro-transcriptase and integrase), and env ( region related to surface envelope proteins). In addition these sequences presents long terminal repeats (LTRs) which despite not being present in the exogenous viral RNA are necessary for the integration process along with the integrase enzyme. Furthermore these retroviral sequences can present another protein codifying sequence denominated pr correspondent with proteases enzymes (Jern P, 2005) . The order of these regions, starting from the 5’end to the 3’ end, would be LTR 5’-gag-prpol-env-LTR 3’ (see Figure 1a). Figure 1a:. Figure 1b:. Figure 1a Represents a generic retroviral sequence. In this scheme appears the LTRs and the codifying sequences mentioned before (gag, pr/pro, pol and env) and its sub-regions. The abbreviations of those subregions indicate the type of protein they codify for and are as follows: MA, matrix: CA, capsid; NC, nucleocapsid; PR, protease; RT, retrotranscriptase; RH, RNAse H; IN, integrase, SU, surface unit and TM, transmembrane protein. Figure 1b Image taken from Patzke, S. et al., 2010 that shows an alignment between LTR 5’ and LTR 3’ from the human copy of the endogenous retrovirus from the family H/F (HERV-H/F) located in the chromosome 6. Polypurine tract (PPT), primer binding site (PBS), potential transcription factor biding sites and promoter elements are signalled..
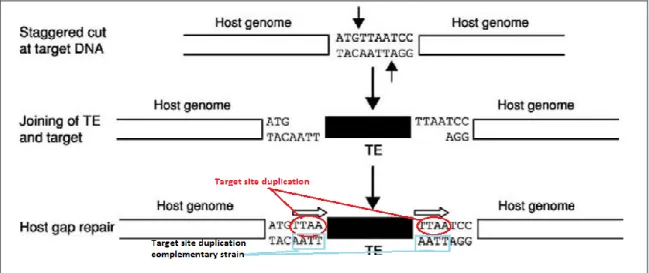
(4) These infectious retroviruses sequences located in our genome are denominated Human endogenous retroviruses (HERVs). They originate when a exogenous retrovirus instead of only infecting somatic cells they incorporate to the germ line being passed to the next generation and creating a endogenous retrovirus. Basically endogenous retroviruses (ERVs) are DNA sequences present in a genome steaming from a previous exogenous retrovirus infection in germline cells. So its genetic material gets fixated in the infected organism´s genome being transmitted vertically to the progeny. Although in the beginning they present similar structure to exogenous retrovirus as the time passes it becomes defective due to the accumulation of mutations or genomic rearrangements (translocations, inversions, etc). Despite the majority of ERVs aren´t fully functional any more due mutational decay many of them still present open reading frames (ORFs) and are transcriptionally active, however that doesn´t mean they are transcriptionally inactive. Almost all retroviruses present a similar protein mechanism. On one hand this mechanism includes the transcription of the three first regions (gag, pr and pol) within the same open reading frame (ORF). This ORF start with the codon ATG and the final transcript is a precursor protein gagpr-pol which finally will be processed to form all the natural proteins of the different regions. On the other hand the region env has its own ORF that also start with another ATG codon (Laurence Be´nit, 2001). The provirus is significantly longer than the viral genomic RNA in both the 5′ and 3′ directions because it contains the LTRs and the virion doesn´t. These regions don´t codify for proteins, and are originated during the retrotranscription of the virion´s RNA. In the sequence of these regions we find most of the transcriptional factors, enhancers and biding sites related to transcription (see Figure 1b). The LTRs are formed during the retrotranscriptional process previously to the integration into the genome. Despite of not targeting a specific sequence the integration of a retrovirus is not completely random. It does target sensible spots such as active genes or nucleosomal DNA and it depends on the type of retrovirus. In the course of the integration process a sequence from the host´s DNA is cut in in direction 5’, it´s a short sequence of 4 to 6 nucleotides long, and cut has a staggered shape. The energy liberated from the rupture of the phosphodiester bonds of those nucleotides is used for the formation of new bonds between viral DNA 3’ ends. Next viral proteins synthesize DNA from the host´s 3’ ends to the viral 5’ ends. This new DNA is made to fill the gaps originated for the staggered cut creating the so called duplication target sites, TSD (see Figure 2). All this process is conducted by the integrase-viral DNA complex..
(5) Figure 2. Schematic representation of the integration process ante creation of the Target site duplications (TSD) in both ends and strain.. At the time an endogenous retrovirus is originated by achieving its integration into the germ line it gets irreversibly bond to the genome. Its sequence will diverge from the original proviral one as the time passes because of the accumulation of mutations, it will lead to the loss of the ability of individual self-replication. Some might maintain the full proviral sequence despite of it being defective but it may also occur that others experiment retrotransposition events in the genome due to the presence of the LTR regions and the action of the retrotrancriptase enzyme. In this last case multiple copies, full or partial, of the proviral sequence will appear scattered through the host´s genome. Another likely scenario is the homologous recombination between LTRs from the same insertion that can give place to the apparition of lone LTRs.. 1.2. Background of human endogenous retroviruses (HERVs).. There are more than 30 families of HERVs identified and its integration events vary from old one such as 40 Mya to very recent ones as the HERV-K family which was integrated in our genome around 5-6 Mya after the divergence between our linage (homo linage) and the Pan linage (bonobos and Chimpamzees). The HERVs are divided in 4 classes (see Figure 2). This project focusses in the HERV-H/F group which was characterised in 2003 by Paztke S and colleges. It was name HERV-H/F because it shares binding sites,.
(6) and LTRs´ elements with the group F but the sequence is highly similar to the H group.. Figure 2. Phylogenetic tree that shows the HERVs families divided in the 4 classes and signals the species of the host..
(7) 2. Materials and Methods.. 2.1 Search of HERV-H/F sequences. First a search was made, under the term “HERV-H/F”, in the online database called “Nucleotide” that belongs to the NCBI (National Center for Biotechnology Information). Two results were obtained: 1. “Homo sapiens endogenous retrovirus, clone HERV-H/F, 5’ LTR” and 2. “Homo sapiens endogenous retrovirus, mRNA, clone HERV-H/F”. Both entries are related to the same article (Patzke,S. et al, 2010) and allude to HERV-3. Next we used the LTR 5’ sequence obtained from the first entry in order to demarcate the coordinates of the proviral insertion mentioned in Patzke´s paper that it´s supposed to be in the chromosome six of the human genome. For this purpose we employed. the. online. database. called. The. Esembl. project,. available. at. “www.ensembl.org/index.html”. It is a joint project between the Wellcome Trust Sanger Institute and EMBL-EBI with the aim to develop a software system that produces and maintains automatic annotation on selected eukaryotic genomes. We used the blast/blat search engine from The Esembl project using as query the LTR sequence. For this search we did a Blat through the human genome employing the predetermined settings for maximun e-value (1e-1) and with the last actualization of the software (GRCh38). Out of the results of the previous search we obtained the coordinates of the LTR 5’ and LTR 3’ with which we were able to suggest the coordinates demarcating the full proviral insertion. Afterwards we introduce those coordinates in the genomic browser of The Esembl project narrowing the search to the chromosome six of the human species and once obtained the results of the search we exported the data in FASTA format. This time instead of The Esembl Project we used Blast Like Alignment Tool or BLAT, available at “www.genome.ucsc.edu/cgi-bin/hgBlat?command=start”. This tool was developed by the University of California in Santa Cruz (abbreviated UCSC) and it has a similar algorithm that a Blast search but it is focused in sequences with a 95% of similarity with the query or more and they must be at least forty nucleotides long. We performed BLAT searches through the human, chimpanzee, gorilla, orangutan, gibbon and macaque genomes..
(8) Later we performed another search in the gibbon genome but this time it was a blastn search in The Esembl Project that isn´t as restrictive as a Blat. We used the HERV sequence of human chromosome 6 divided in six parts of almost equal length, being the last one slightly shorter, as query and we looked for results which were proximate in coordinates to one another. From the results selected we built what we suspected could be a full proviral sequence belonging to the HERV-H/F group but with so many differences to the copy in the human genome that didn´t fulfil the requirements of Blat and Blast to appear as a unique result. A reason for this could possibly be because the insertion of the proviral sequence had place during or just before the speciation process that separated the gibbon line from the rest of the hominoidea, around 20 million year ago (Mya). Once we had made all search and determined the coordinates of the sequences we used one more time the genome browser from The Esemble Project to obtain the sequences in FASTA format. Afterwards we looked for lone LTRs with BLAT from UCSC with the aim of finding lone LTRs. The query utilised was the LTR 5’ obtained in the GenBank entry “Homo sapiens endogenous retrovirus, clone HERV-H/F, 5’ LTR” previously mentioned.. 2.2. Identification of the target sites duplications. With the intention of figuring if all the full proviral sequences found belonged to the same integration event we identified the target sites duplications to verify if they were all similar. In the case they were it would mean that all the sequences belong to the same integration event. For this purpose we used the genome browser of the The Esembl project to obtain the sequences again but with 40 nucleotides (nt) more upstream and downstream. Hereafter we inspected those “extra” bases looking for a short sequence, 4 to 6 nt that appears in both LTRs. This process was made manually in text editor programme.. 2.3. Dating the retrovirus insertion. Attending to the information contained in the article “Characterization of a novel human endogenous retrovirus, HERV-H/F, expressed in human leukemia cell lines” written by Patzke S and colleagues the integration event had place between 35 to 40 Mya..
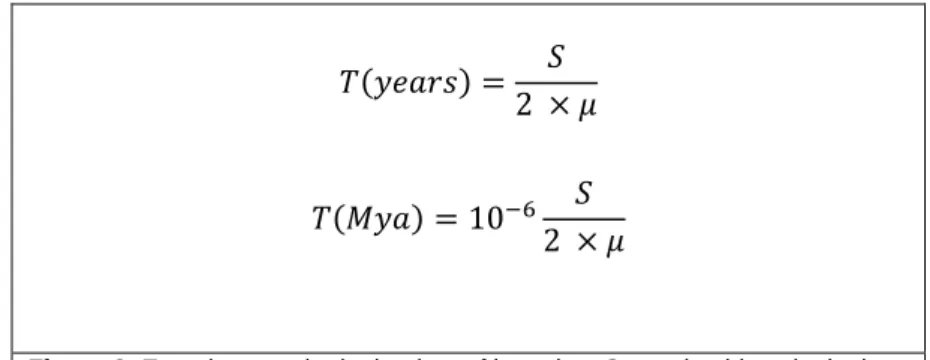
(9) They estimated it by comparing both LTRs because after the integration the HERV sequence is identical to the exogenous retrovirus and the LTRs are identical between. So if we compare both LTRs it will reflect all the mutations occurred since the integration and along with a mutation rate (µ) we can obtain a date of integration (see Figure 3).. 𝑇(𝑦𝑒𝑎𝑟𝑠) =. 𝑆 2 ×𝜇. 𝑇(𝑀𝑦𝑎) = 10−6. 𝑆 2 ×𝜇. Figure 3. Equations to obtain the time of insertion. S= nucleotide substitutions per site; µ= mutation rate; T=time.. We performed a similar process but we used two different mutation rates to obtain an interval of time and we had into account the CpGs positions. These are positions with a high mutation rate due deamination of the cytosine residue to uracil but this last one doesn´t belong to DNA strains so it is changed to thymine which is coupled with adenine causing transitions. This usually leads to overestimate the number of nucleotide substitutions per site (S) and therefore the time of insertion. We inspected the LTRs sequences eliminating the significant positions where in some sequences appeared CG and in others CA or TG. We considered a position was significant when 70% or more of them presented the same nucleotide (López-Sánchez P, et al, 2005). To perform this process first we identified the LTRs in all the proviral sequences with the method ClustalW Multiple Alignment of the Bioedit v. 7.2.5 programme align the full sequences with the human LTRs found in the first Blast search. Then we aligned all the LTRs together placing first all the LTR 5’ and later the LTRs 3’ to appreciate better the changes between LTRs 5’ and LTR3’ instead the differences between species (attached document ). After eliminating the CpGs positions we separated the LTRs by species and executed a Kimura 2-parameters test that has into account transitions and transversions with the programme Mega 5.2 to obtain S and for the values of µ we used 1.3 (Patzke, S. et al., 2010) and 2.1(?)..
(10) 2.4. Identification and study of the different regions of the proviral insertions. First we went to Conserved Domains search (CD-search) from NCBI and made a search with each of the full proviral sequences. The CD-search tool inspect queries of nucleotides in FASTA format or protein sequences and compare them with the NCBI database indicating which conserved domain are in the DNA codifying sequences or directly in the aminoacids sequences used as query. It also show you its coordinates and gives you some information about the binding sites, motifs or final products of those conserved domains. Secondly we used the option “Unsorted Six-Frame Translation” of the programme Bioedit v. 7.2.5 twice, one with each option for the start codon (ATG or Any) to obtain the translated sequences all the open reading frames (ORFs) of the sequences. Later we used CD-search with each ORF with a minimum length of 40 aminoacids (aa) to associate each ORF with a conserved domain if appropriate.The same way we find out if the sequences related to conserved domains present premature codon stops or frameshift mutations. Making use of all the data collected with the previous two steps we delimitated the characteristic regions of a proviral sequence gag, pr, pol and env. Also discovered which subregions (see Figure 1a) were conserved in each sequence and if they had suffered any frameshift mutation, had any premature codon, were incomplete or completely absent.. 2.5. Testing the hypothesis about the role of selection on the evolution of the. HERV-H/F group.. There are great number of studies that support the implication of HERVs in numerous and complex biological process of their host´s organisms. Some of them are beneficial such as the biological role that env proteins of HERV-W, HERV-FRD, and ERV-3 play in the human placenta; it is believed that the retroviral env protein Syncytin 1 is involved in the fusion of mononuclear cytotrophoblasts to form syncytiotrophoblast in the human placenta and these cells are is responsible for the transport of oxygen, nutrients, and waste products, production of hormones, and immune tolerance. Therefore most probably the env regions of HERV-W, HERV-FRD ERV-3 are under purifying selection. But we also can find the opposite scenario where the HERV presence is related with a negative effect as for example a no allelic homologous recombination between HERVs elements located in the Y chromosome may cause.
(11) micro-deletions in the long arm of the chromosome provoking infertility in the male, also retroviral env proteins such as HTLV-I or HTLV-II had been linked to numerous types of leukaemia. In these last scenarios the proviral sequence may be under a positive selection (positive towards the change of the sequence). In order to know if any of the copies of HERV-H/F is under positive, purifying or neutral selection we had carried out a test of polymorphism, a synonymous and no synonymous substitution test and finally a Z-test of selection for statistical support. First we created a file containing all the full proviral sequences aligned. Then we edited them eliminating the CpGs positions and manually correcting the gaps. Later we used DNAsp v5.10.01 programme to run a polymorphism test and to obtain the value of the nucleotide diversity (π). For this test we used the predetermined Jukes-Cantor model. Once w had the results we choose to present them in a graphic with parameters Window lenght=300 positions and Step size= 10 positions. The regions where π get close to 0 it means that they are highly conserved regions and therefore we suspect they may be under a purifying selection and they might be related to some beneficial process for the host. Secondly to cover the study of the selection over the three most important regions of a retroviral sequence (gag, pol and env) we performed synonymous and no synonymous substitution test to the sequences of the gag and env full regions but we focused in the retrotranscriptase codifying region and not the complete pol zone. For this we created individuals files containing all the copies of the specific region of all species. In this file the CpGs were present because they are needed for the accuracy of the test but the gaps did were corrected. Also the DNAsp v5.10.01 required to define the codifying regions from the sequences previously to the test. In the setting for the test we choose that the synonymous and no synonymous substitutions were evaluated in both types of regions, codifying and no codifying ones. The results we obtain are presented in two different windows. One is a text where we have all the characteristic of the sequences (number of positions, demarcation of the codifying and no codifying regions…). The other is a table where we can find, from left to right, the values of each species of: - SilentDif: total number of synonymous differences. - SilentPos: total number of synonymous sites. - Ks: total number of synonymous substitutions per synonymous site. - NSynDif:: total number of no synonymous defferences..
(12) - NSynPos: total number of no synonymous sites. - Ka: total number of no synonymous substitutions per synonymous site. We are mainly interested in Ka and Ks because the value of Ka/Ks will indicate us under what kind of selection is the region (Hurst D L, 2005). There is three possible scenarios: If Ka/Ks=1 (neutral evolution): means that the synonymous and no synonymous sites are equals, there isn´t any type of selection pressuring the sequences. This indicates that in the sequences there is a pseudogene that is a DNA sequences that due accumulation of mutations has lost its biological function. If Ka/Ks>1 (positive selection): no synonymous mutations outnumber synonymous ones and this indicates that a there is a selection force acting over the region and that this force is towards the change of the sequence. If Ka/Ks<1 (purifying selection): is the opposite to positive selection, the synonymous mutations outnumber no synonymous ones. For this to happen there has to be a selective pressure that prevents the fixation of deleterious mutations helping the sequence to continue being functionally active. Finally the Z-test of selection was made to conclude if our data was significant enough. For the gag and retrotranscriptase (RT) region the H0 was neutrality (Ka=Ks) opposing H1: purifying selection (Ka<Ks or Ka>Ks) but in the case of env due the. obtained values of Ka and Ks and because of the evidence showed in Paztke S et al 2010 that links it to pre-B cells leukaemia line Reh, we used H0: Positive selection and H1: dN > dS (Ka/Ks<1, purifying slection).. 2.6.Phylogenetic reconstruction of the full proviral sequence and of each identified region. Aimining to know if the evolution of the proviral sequences is similar to the evolution of the different species lines we made a phylogenetic reconstruction of the full proviral sequences as well as from the regions gag, pol (specifically the retrotanscriptase subregion) and env so we could know if the regions had evolved similarly to the full sequence or if there is there is mosaic evolution. This would mean that a region is evolving with a different mutation rate (µ) than the other places of the sequences. This can be due different reason such as that region counts with a mechanism that prevents no synonymous changes or the opposite and that region suffer a positive selection..
(13) In order to do the phylogenetic reconstruction we need a sequence similar to the others but that doesn´t belong to the same group to enroot the phylogenetic tree. For this purpose we used the reconstructed gibbon sequence which has highly similar sequence but it resulted not belonging to the HERV-H/F group. This sequence is usually denominated outgroup. Secondly we aligned all the sequence, eliminated the LTRs, the CpGs positions, the gaps and saved it in FASTA format. The process was repeated with the gag, RT and env regions, but this time outgroups used were different. They were full sequences of those regions but belonging to other HERV-H that shares a high similar sequence to the HERV-H/F group. Once we had all the files with their respective HERV-H/F sequences of each species and their outgroups, we carried out two different methods for the construction of phylogenetic tree: maximum Parsimony method and maximum Likelihood method. In first one we selected 100 Bootstrap Replications and the options “Subtree-PruningRegrafting” with the aim of obtaining the tree of maximum parsimony. For the second method we choose the “General Time Reversible model” model and the method of “Default – NJ/BioNJ” and in the case of the analysis of the individual regions we selected the Gamma distribution. Finally we obtained two trees per file and we considered significative all the branches with s Bootstrap value over 70..
(14) 3. Results. 3.1. Search of HERV-H/F sequences. After finding the LTR 5’ sequence in the NCBI with the search terms “HERV-H/F” we obtained the coordinates of both LTRs 5’ and 3’ (67889062-67889505 and 6788098867881436 respectively) of a HERV-H/F copy located in the human chromosome 6 in the coordinates 67880988-67889505. Later we obtained the full sequence in FASTA format with the genomic browser of The Esemble Project. Making use of BLAT we found another two HERV-H/F copies, one in the Gorilla´s genome (chr 6:6755617867564952) and other in the Orangutan´s genome (chr 6: 68198262:68203412) both of them in the chromosome 6. We also found partial sequences scattered through the human genome and another full copy in the chromosome 9 of chimpazees. But with the Synteny tool of The Esemble Project we checked that this last one isn´t orthologous with the one in the other thereafter it comes from a different integration event. In the searches of the gibbon genome (explained in the section 2.1) we found 9 hits between the coordinates 2003235-2011356 of the chromosome 1a, but after using CDsearch with the reconstructed sequence we found Tymovirus 45/70Kd protein conserved domain so it was a tymovirus sequence. Also a search to find was made in the genomes of the human, orangutan and gorilla species (see attached document ). Just the ones that shows at nearly 90% of similarity and has a length between 400 to 480 nt were considered possible lone LTRs (see attached document). The 90% of similarity is taken as reference because is the similarity shared between LTR 5’ and LTR 3’ in the human copy so any other LTR from the same integration process will most probably had a near similarity. The number of sequences that met those requirements were: 4 in orangutan, 7 in gorilla and 14 in human (3 of them are situated one after the other very closely located in the same chromosome). 3.2. Identification of the target sites duplication. In the upstream and downstream 40 nuecleotides of each proviral sequence was found a similar sequence of 5 nucleotides long (GACAG), but in the human 5’ end one of those bases appears to have suffered a transversion (GT) (see table 1). This indicates that all the sequences belong to the same integration event..
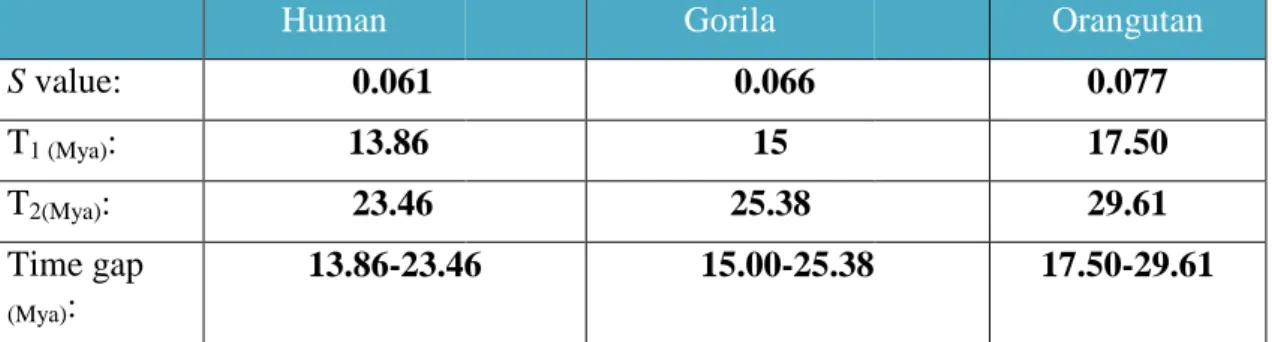
(15) Species -Gorilla. -Human. -Orangutan. Nucleotide sequence upstream/downstream of its respective end: 5' end. 5’-GTAGTTTTGTGGCTGAGGCCACTATAAACGAAAGACAGTC-3’. 3' end. 3’-GACAGATTAACAAGAAAAACACGTACAGATTAATTTAATA-5’. 5' end. 5’-GTAGTTTTGTGGCTGAGGGCACTATAAACGAAAGACATTC-3’. 3' end. 3’-GACAGATTAACAAGAAAAACACATACAGATTAATTTAATA-5’. 5’ end 5’-GTAGTTTTATGGCTGAGGCCACTATAAACGAAAGACAGTG-3’ 3’ end 3’- GACAGGTTAACAAGAAAAACATGTACAGATTAATTTAATA-5’. Table nº 1. Presents in red the target sites duplications (TSD). In the case of the human sequence the last nucleotide of the 3’ end TSD appears to have suffered a transversion after the integration.. 3.3. Dating the retrovirus insertion. Aligning the human LTR we obtained the lengths of the LTRs in gorilla (LTR 5’443nt; LTR 3’ 428 nt) and orangutan (LTR 5’441 nt; LTR3’450 nt). Afterwards we created a file with just the LTRs and after correcting the CpGs positions we calculated S (nucleotides substitutions per site) with the programme Mega 5.2 which with calculated the time of the integration event (see Table 2).. Human. Gorila. Orangutan. S value:. 0.061. 0.066. 0.077. T1 (Mya):. 13.86. 15. 17.50. T2(Mya):. 23.46. 25.38. 29.61. Time gap (Mya):. 13.86-23.46. 15.00-25.38. 17.50-29.61. Tabla nº.2. Present the S (nucleotides substitutions per site) values and the times of insertions for the two µ (T1 for µ= 2.1 and T2 for µ=1.3).. All the time gaps overlap each other and had place before the speciation between humans, gorillas and orangutans so we suppose the integration was in the genome of a common ancestor to them all. Even more we can narrow the gap by choosing the highest minimal time and the lowest maximum time (17.50 to 23.46 Mya). The narrowed time gap is approximately during the speciation of the gibbon. This is why we tried to find any possible copy of HERV-H/F in its genome but we didn´t so most likely the integration event had place after it or in the linage of a common ancestor only for the rest of hominoids (see Figure 4)..
(16) Figure 3. Philogenetic tree of the primates. The blue arrow points the time of integration of HERV-H/F between 17.50 and 23.46 Mya, the blue line signals the most possible time of insertion between that gap, after the gibbon speciation (17.50-20 Mya) and the yellow line signals the less likely time of insertion of the time gap calculated.. 3.4. Assessment of the different regions of the proviral insertion.. The length of the human and gorilla sequence was very similar, both of them are nearly 9 kb which is the expected length of a full HERV sequence, but the one from orangutan is shorter (between 5 and 6 kb). However all the characteristic regions (gag, pr, pol, env and both LTRs) are present in the sequence although some of they are shorter than in the other two HERV-H/F copies. We delimitated the coordinates of the regions (see Table 3) with the CD-search tool and the use of the programme Bioedit as explained in the section 2.4.. Gag. Pr. Pol. Env. Human. 1925-2455. 2496-2942. 2771-5686. 7292-7942. Gorila. 1797-2423. 2464-2910. 2739-5911. 7552-8199. Orangutan. 1792-2406. 2450-3130. 3437-4155. 4159-4674. Table 3. Shows the coordinates, in nucleotides, of the regions in all the HERV-H/F copies found.. The regions pr and pol are overlapped in human and gorilla, in orangutan they are separated but only by 7 nucleotides so in the past they likely were overlapped too. The same way in all three sequences between the regions gag y pr there are no more of 50nt. All of this agrees with the usual retroviral mechanism of transcription. The DNA obtained by retrotanscriptions usually produces two types of fusogenic polyprotein..
(17) One that after being processed will form all the proteins from gag, pr and pol and another that is precursor of the two types of env proteins (surface units and transmembrane proteins). There is a longer distance between the pol region and env than between all the other regions. Also we have the information about the conserved domains. In all the sequences, better or worse conserved, there are present the following domains: gag P30 core shell protein, retropepsin of the RTVL_H family, Bel/Pao family of RNAse H1, a subfamily of retrotranscriptases (RT-ZFREV-like) and Ebola-HIV-1-like-HR1-HR2 superfamily. And in human as well that in gorilla we find other HERV characteristic domains that are lost in orang-utan, for example: Integrase core domain and reverse transcriptase but this one is RNA-dependent DNA polymerase. And lastly in just human we find FAM70 protein domain and Cytidylyltransferase family. Despite CD-search recognize so many domains most of them are incomplete or had suffered a frameshift mutation. In orangutan there are just two reading frames (+1 and +2) with open reading frames related to conserved domains. There isn´t a single domain in the same reading frame in the three sequences. On one hand human a gorilla there is a premature codon stop in the ORF of the retropepsin and as a result it has two ORF for retropepsin very close but both of them incomplete and there is a similar situation with the Bel/Pao family of RNAse H1. And there are two ORF of integrase core dominion protein that overlaps but they are in different RF, this indicates a frameshift mutation. In gorilla it is from FR +3FR+2 and the it is same in human. On the other hand in the orang-utan sequence the retropepsin protein present one unique ORF and the Bel/Pao family of RNAse H1 shows a premature stop codon but not a frameshift mutation.. 3.5. Testing the hypothesis about the role of selection on the evolution of the HERV-H/F group.. We performed a polymorphism analysis first to the complete sequences and later to the regions gag, RT (inside pol region) and env. The results from the full sequences indicated that from the nucleotide 1 to 2000 and between 4000 and 5000, first overlap most of the gag regions and the second correspond with the RT domain. Lastly the region has a value of π extremely high, specially in comparison to the other regions which may indicate a positive selection is acting in that region while a purifying one is acting in the other mentioned two..
(18) Figure 4. Graphic representation of the variation of π through the full sequences.. For the gag, RT and env domains we directly carried out a test of synonymous and no synonymous substitution (see Figure 5) using the programme DNAspv 5.. Figure 5. Data from the result of the test of synonymous and no synonymous substitutions. In the second table RT_ is the human RT sequence and in the third table 6-GAG is also the sequences correspondent to the human HERV-H/F.. With the results obtained we can already suspect that the env region is likely under the action of a positive selection especially in orangutan because in all the pair with orangutan Ka value is very superior to Ks. We can also see that the gag region possibly is under the effect of a purifying selection in all the sequences so is likely that gag p30, the only protein with ORF, is related to some type of beneficial process to the host´s organism..
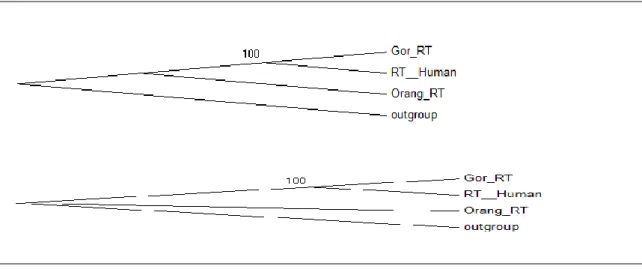
(19) Finally we did the Z-test with MEGA 5.2 as they were described in section 2.6. For env the H0 was positive selection ante H1 was purifying selection. For gag the H0 was purifying selection while H1 was positive selection and for RT was H0 neutrality selection and H1: Ka different of Ks (see Figure 6). The only significative result is from the orangutan env region which is under the action of a positive selection.. Figure 6. From left to right in the first row the first table is for the test of the env region, the second is the results for the purifying selection test of gag, the first one of the left on the second row is the test of neutrality for RT and the last one are results from a purifying selection test of the RT region.. 3.6. Phylogenetic reconstruction of each proviral region. The phylogenetic reconstruction of the full proviral sequences is coherent with the species linages evolution. The sequence of orangutan was the first one to diverge from gorilla and humans (see Figure 7).. Figure 7 It correspond to the full proviral sequences and shows the maximum parsimony tree that is equal to the maximum likelihood tree but this last one present a bootstrap value of 70 where the showed in the image has a value of 100.. For the creation of phylogenetic tree from the different regions (gag, RT and env) we used similar settings except that this time but in the maximum likelyhood we chose Gamma distributed with Invariant sites (G+I) in the option “rate among sites”..
(20) The trees from the env regions fully correspond to the one of full sequences except that the maximum likelihood branch of human and gorilla had 99 bootstrap instead of 100. In the case of the RT region the maximum likelyhood tree is equal to the one of full sequences but the one with maximum parsimony has the difference that the branch from the orangutan has collapsed. In the third and last case of the gag region all branches of both tree are under 70 bootstrap value so they aren´t considered significatives ( see Figure 8).. Figure 8a. It correspond to the env regions sequences and shows the maximum likelihood tree that is equal to the maximum parsimony tree but this last one present a bootstrap value of 99 where the showed in the image has a value of 100.. Figure 8b . It correspond to the RT regions sequences and it shows first the maximum likelihood tree and secondly the maximum parsimony tree.. Figure 8c. . It correspond to the gag regions sequences and shows first the maximum likelihood tree and secondly the maximum parsimony tree..
(21) 4. Discussion and Conclusions. 4.1.Found HERV-H/F sequences.. Despite we found full copies of HERV-H/F in gorilla, orangutan and human, we didn´t find a match in the chimpanzee genome. Even more we concluded that all the copies found belongs to the same integration event and that it was dated during the speciation of the gibbon (around 20 Mya), which suggest that the reason it is absent from the gibbon´s genome is that the integration happened after the linages diverged. But the Pan linage (chimpanzee and bonobo) diverged from the human linage after the orangutan and gorilla divergence and despite of it the chimpanzee doesn´t present any copy of the HERV-H/F. The most likely explanation is that it was lost during the divergence of the Pan linage and the Homo linage.. 4.2. Evolution of the HERV-H/F group.. In the end the only result with enough statistical support were the hypothesis of the env region in orangutan of a purifying selection but in gorilla or human. This result correlates with the fact that the HTLV-1 protein of the env region which well conserved in human or gorillas has almost disappeared in the orangutan sequence. Actually despite the evidence presented by Paztke S, et al 2010 that links the gag protein with pre-B cell leukaemia line Reh in humans the values of Ka and Ks leads to suspect that if gag products has any role in the diseases is a beneficial one because the Ka is lower than Ks in all the sequences but there isn´t enough statistical support to affirm it. Finally even though the phylogenetic reconstruction of the full sequences and from the env clearly are similar to the phylogenies of the species linages, the other aren´t significant because their branch do not have enough bootstrap therefore the regions gag and RT are suspicious of a mosaic evolution (different evolution rate that the overall of the sequence)..
(22) 3. Bibliography.. 1. Carbone L, Vessere GM, Hallers BFt, Zhu B, Oskegawa K, et al (2006). “A High-Resolution Map of Synteny Disruptions in Gibbon and Human Genomes”. PLoS Genet 2 (12): e223. Doi: 101371/journal.pgn.0020223. 2. Griffiths, D. J. (2001). “Endogenous retroviruses in the human genome sequence”. Genome Biol. 2, 1–5. 3. Hurst, L. D. (2002). “The Ka/Ks ratio: diagnosing the form of sequence evolution”. Trends Genet. 18, 486–487. 4. Jern P, (2005). “Genomic Variation and Evolution of HERV-H and other Endogenous Retrovirus (ERVs)”. Digital Comprehensive Summaries of Uppsala Dissertations of the Faculty of Medice 62. ISSN 1651-6206; ISBN 91-554-63193 5. Jern, P., Sperber, G. O., Ahlsén, G., & Blomberg, J. (2005). Sequence Variability, Gene Structure, and Expression of Full-Length Human Endogenous Retrovirus H. Journal of Virology, 79(10), 6325–6337. doi:10.1128/JVI.79.10.6325-6337.2005 6. Marchler-Bauer A et al. (2011), "CDD: a Conserved Domain Database for the functional annotation of proteins.", Nucleic Acids Res.39(D)225-9. 7. Nei, M. & Gojobori, T. Simple methods for estimating the numbers of synonymous and nonsynonymous nucleotide substitutions. Mol. Biol. Evol. 3, 418–26 (1986). 8. Nei, M. & Kumar, S. Molecular Evolution and Phylogenetics. Heredity (Edinb). 86, 385–386 (2001). 9. Nelson, P. N. et al. (2004). “Human endogenous retroviruses: transposable elements with potential?” Clin. Exp. Immunol. 138, 1–9. 10. Nelson, P. N. et al. Demystified... Human endogenous retroviruses. J. Clin. Pathol. Mol. Pathol. 56, 11–18 (2003). 11. Pagon, R. A. et al. in GeneReviews (University of Washington). at http://www.ncbi.nlm.nih.gov/books/NBK5191 12. Patzke,S., Lindeskog,M., Munthe,E. and Aasheim,H.C. (2002).“Characterization of a novel human endogenous retrovirus, HERV-H/F, expressed in human leukemia cell lines”. Virology 303 (1), 164-173. 13. Perelman, P. et al. A molecular phylogeny of living primates. PLoS Genet. 7, e1001342 (2011). 14. Sarah G. Black , Fredrick Arnaud Massimo Palmarini , Thomas E. Spencer (2010). “Endogenous Retroviruses in Trophoblast Differentiation and Placental Development”. American Journal of Reproductive Inmunology, Vol. 64, Issue 4. 15. Sentís, C. (2010). “Retrovirus endógenos humanos: Significado biológico e implicaciones evolutivas.”. Arbor 172, 135–166..
(23) 16. Tamura, K., Stecher, G., Peterson, D., Filipski, A. & Kumar, S. (2013). MEGA6: Molecular Evolutionary Genetics Analysis version 6.0. Mol. Biol. Evol. 30, 2725–9. 17. Zheng Zhang, Scott Schwartz, Lukas Wagner and Webb Miller (20009, “Agreey algorithm for aligning DNA sequences”, J Comput Biol 2000; 7(1-2):203-14. 18. Ryan P F (2004) “Human endogenous retroviruses in health and disease: a symbiotic perspective”. J R Soc Med vol. 97no. 12 560-565.
(24)
Figure

+5


Documento similar
If the concept of the first digital divide was particularly linked to access to Internet, and the second digital divide to the operational capacity of the ICT‟s, the
1. S., III, 52, 1-3: Examinadas estas cosas por nosotros, sería apropiado a los lugares antes citados tratar lo contado en la historia sobre las Amazonas que había antiguamente
Since such powers frequently exist outside the institutional framework, and/or exercise their influence through channels exempt (or simply out of reach) from any political
In the previous sections we have shown how astronomical alignments and solar hierophanies – with a common interest in the solstices − were substantiated in the
While Russian nostalgia for the late-socialism of the Brezhnev era began only after the clear-cut rupture of 1991, nostalgia for the 1970s seems to have emerged in Algeria
No obstante, como esta enfermedad afecta a cada persona de manera diferente, no todas las opciones de cuidado y tratamiento pueden ser apropiadas para cada individuo.. La forma
In this respect, a comparison with The Shadow of the Glen is very useful, since the text finished by Synge in 1904 can be considered a complex development of the opposition
(2) The flux and radial-velocity variations observed for a line’s individual spectral features can be ex- plained in a model in which the maser spots form elongated chains or
