A PROFILE ANALYSIS OF RAMAN-SCATTERED O VI BANDS AT 6825
Å
AND 7082
Å
IN
SANDULEAK’S STAR
Jeong-Eun Heo1,2, Rodolfo Angeloni2, Francesco Di Mille3, Tali Palma4, and Hee-Won Lee1
1
Department of Physics and Astronomy, Sejong University, Seoul, Korea;[email protected] 2
Gemini Observatory, Casilla 603, La Serena, Chile
3
Las Campanas Observatory, Carnegie Observatories, Casilla 601, La Serena, Chile
4
Departamento de Ciencias Físicas, Universidad Andrés Bello, Fernández Concha 700, Las Condes, Santiago, Chile
Received 2016 September 22; revised 2016 October 21; accepted 2016 October 21; published 2016 December 21
ABSTRACT
We present a detailed modeling of the two broad bands observed at 6825 and 7082Å in Sanduleak’s star, a controversial object in the Large Magellanic Cloud. These bands are known to originate from Raman scattering of OVIλλ1032 and 1038 photons with atomic hydrogen and are only observed in bonafide symbiotic stars. Our high-resolution spectrum obtained with the Magellan Inamori Kyocera Echelle spectrograph at the Magellan-Clay Telescope reveals, quite surprisingly, that the profiles of the two bands look very different: while the Raman 6825Å band shows a single broad profile with a redward extended bump, the Raman 7082Å band exhibits a distinct triple-peak profile. Our model suggests that the OVIemission nebula can be decomposed into a red, blue, and central emission region from an accretion disk, a bipolar outflow, and a further compact, optically thick region. We also perform Monte Carlo simulations with the aim offitting the observedflux ratioF(6825)/F(7082)∼4.5, which indicates that the neutral region in Sanduleak’s star is characterized by the column density NHI∼1×10
23cm−2.
Key words:binaries: symbiotic–line: profiles–radiative transfer–scattering–stars: individual(Sanduleak’s star)
1. INTRODUCTION
Sanduleak’s star was discovered in 1977 as an emission line variable object in the Large Magellanic Cloud ( Sandu-leak 1977). A few years later, Allen (1980) advocated its nature as being that of a symbiotic star, noticing however that the optical continuum appeared weak and featureless, with no clear signature of any late-type giant—which nonetheless is a necessary ingredient at the basis of the symbiotic phenomenon. After almost forty years, the real nature of Sanduleak’s star is still a matter of debate: despite no observations unambiguously confirming the presence of a late-type companion, in favor of its binary nature, the bipolar precessing jet was recently discovered by Angeloni et al. (2011). As a matter of fact, bipolar outflows seem to be associated with the binarity of their central source (Sahai et al. 2011). Furthermore, the symbiotic character of Sanduleak’s star is supported by both a highly ionized emission line spectrum reminiscent of a dusty ( here-after D-) type symbiotic star (Munari & Zwitter 2002; Belczyński et al. 2000) and by the two intense Raman OVI
bands at 6825, 7082Å, which so far have been convincingly detected only in bonafide symbiotic stars.
These Raman-scattered OVIbands are in fact so unique to the symbiotic phenomenon, that their presence has been used as a sufficient criterion for classifying a star as symbiotic, even in those cases where the cool companion appears to be hiding (Belczyński et al.2000). These broad spectral bands are known in the astronomical literature at least since the 1940s (Joy & Swings 1945), but their physical origin was explained only much later by Schmid (1989). Schmid proposed that an OVIλ1032 photon incident on a hydrogen atom in the ground 1sstate may be Raman-scattered to become an optical photon with λ=6825Å, leaving the scattering hydrogen atom in the excited 2sstate; an analogous process for OVIλ1038 photons to produce the Raman band at 7082Å.
The resonance doublet OVIλλ 1032 and 1038 arises from
-S1 2 P3 2,1 2 transitions. AsP3/2states have twice as many
sublevels than P1/2states, under optically thin conditions the
OVIλ1032flux,F(1032), is expected to be twice as strong as the OVIλ1038 one, F(1038). However, when the emission region is optically thick, F(1032)/F(1038)≈1, because of thermalization effects(Kang & Lee2008; Schmid et al.1999). Since symbiotic nebulae are highly stratified(Allen1987; Luna & Costa 2013), it is indeed quite common to observe UV resonance doublets with different flux ratios, i.e., emerging from regions with different optical depths (as in CI Cyg, Mikołajewska et al.2006).
It is also important to emphasize that, while the OVIλλ
1032 and 1038 line profiles are dependent on the observer’s line of sight (e.g., in EG And, the OVI lines completely disappear when the white dwarf is at the superior conjunction
—Crowley et al. 2008), the Raman band profiles are not. Instead, they mainly reflect the relative kinematics between the HI scattering region and the far-UV emission region. There-fore, the Raman band profiles observed in symbiotic binaries give us the unique perspective of the mass transfer process, as seen from the donor star (e.g., Schmid 1989; Nussbaumer et al.1989).
Observationally, the Raman OVI bands at 6825Å and 7082Åtend to exhibit multiple-peaked profiles, in which the blue peak of Raman 6825Åis relatively more enhanced than the corresponding one of 7082Å (Harries & Howarth 1996; Schmid et al. 1999). Lee & Kang (2007) performed profile analyses of Raman OVI6825Å band observed in the two D-type symbiotic stars V1016Cyg and HMSge to probe the kinematics of the emission region around the white dwarf. They attributed the observed asymmetric double-peak profiles to the OVIemission from an accretion disk: the peak separation corresponds to a speed of ∼50 km s−1, implying an emitting region of∼1 AU.
Heo & Lee(2015)further noted that in V1016 Cyg the blue peak of the 7082Åband is relatively weaker than the 6825Å counterpart, when the two Raman bands are normalized to an equal red peak strength in the Doppler factor space. They developed a quantitative model in which an accretion stream around the white dwarf is responsible for the double-peak profiles, and where the difference in the profile shape is due to theF(1032)/F(1038)variation in the accretion stream.
Spectropolarimetric data of the same V1016Cyg by Schild & Schmid(1996)revealed that the red wing of the Raman OVI
red peak is polarized in the direction perpendicular to the polarization exhibited by the main part of the bands. This polarizationflip is consistent with the emission region made of two components, one moving parallel and the other one perpendicularly(i.e., an outflow-like structure)with respect to the accretion disk plane. Also, Schmid et al.(2000)showed a similar polarization pattern in HM Sge. It is consistent with the presence of a bipolar outflow, which was reported by several observations(Solf1984; Eyres et al.2007). Since the multiple-peak structure and the polarization flip in the Raman OVI
bands can be intuitively explained by a model with an accretion disk and a bipolar outflow, we then apply and test this theoretical scenario on Sanduleak’s star.
In what follows, we present a detailed analysis of the Raman OVI bands in Sanduleak’s star. In Section 2, we present archival Far Ultraviolet Spectroscopic Explorer (FUSE)and proprietary Magellan Inamori Kyocera Echelle (MIKE) data with a morphological description of the observed profiles of both the far-UV OVI doublet (Section 2.1) and the optical Raman OVI bands (Section 2.2). Our profile decomposition technique, along with our physical interpretation, which reads these profiles in terms of the relative kinematics between the OVI emission region and the HI scattering region, is fully described in Section 3. In Section 4 we show the results of Monte Carlo simulations, which help to constrain the physical conditions (e.g., column density and spatial extent) of the circumstellar HI region. Discussion and concluding remarks follow in Section 5.
2. OBSERVATIONS AND PROFILE COMPARISONS
Symbiotic stars are composite interacting binaries: at the origin of their complex photometric and spectroscopic variability lies a series of astrophysical phenomena (accretion processes, stellar pulsations, and orbital modulations, just to quote a few), which act on timescales ranging from minutes to centuries(Munari2012). Any multiwavelength study aiming at a self-consistent modeling of a symbiotic system should thus take into account all the caveats arising when combining observations taken over different spectral ranges at different epochs.
Specifically with regard to the analysis of Raman-scattering processes, the ideal case would be that of having virtually simultaneous observations of both the far-UV OVI resonance doublet and the optical Raman OVIbands. Birriel et al.(2000)
performed near simultaneous far-UV and optical observations to confirm the identification of Raman O VI bands and derive the Raman-scattering efficiencies for nine symbiotic systems (see also Birriel et al. 1998). Even when a high-resolution optical spectrum is at hand, however, far-UV data are as precious as rare. Luckily enough, a search in the Mikulski Archive for Space Telescopes (MAST) returned a publicly
available UV spectrum of Sanduleak’s star, which we publish here for thefirst time.
2.1.FUSESpectrum of OVIλλ1032, 1038
The FUSE was launched in 1999 and operated until the failure of the pointing system on the satellite, on 2007 October 18. At the conclusion of the mission, theFUSE data archive was moved to MAST, where all the data were reprocessed and archived with the final version of the CalFUSE calibration pipeline software package(v 3.2, Dixon et al.2007)and made available to the whole community.
Through Program E950,FUSE pointed at Sanduleak’s star for a total of∼22,000 s on 2004 August 14. The science data were collected with the largest apertures on the focal plane assembly (LWRS—30 arcsec2) in TTAG photon collecting mode. They cover the entire wavelength region 905–1187Å, with a nominal spectral resolution ofΔv≈20 km s−1 (Moos et al. 2000; Sahnow et al. 2000), and are placed by the same CalFUSE on a heliocentric velocity scale.
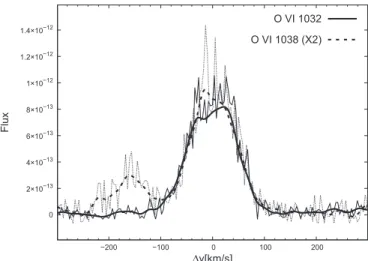
The OVIλ 1032 feature appears among the most intense emission lines present in the far-UV spectrum of Sanduleak’s star, second to(in decreasing order)Lyβ, CIIIλ977, and Lyγ. In the present work, we analyze and discuss only the profiles of the OVIλλ 1032 and 1038 resonance doublet (Figure 1), postponing to a forthcoming paper the modeling of the entire FUSEemission line spectrum.
Following Nichols & Slavin(2009), in Figure1we overplot the two OVIline profiles: the horizontal axis sets the Doppler factor space, whose origin has been chosen at the(respective) line central wavelength in vacuum(Moore1979):
Å Å ( )
l1032=1031.928 ,l1038=1037.618 , 1
and where OVIλ1038 has been multiplied by 2 in order to focus on the profile comparison. Based on Figure 5 of Wood et al. (2002) we take the instrumental profile, or line-spread function, as a single Gaussian having the FWHM of 20 km s−1. The convolved profiles are plotted by the thick lines in Figure 1. It is immediately evident that the two profiles coincide with each other, with the remarkable exception of a
small excess at a few tens of km s−1in the OVIλ1038 line. This excess implies that locallyF(1032)/F(1038)is less than 2: as mentioned in Section 1 regarding far-UV resonance doublets in symbiotic systems, this evidence hints toward the presence in Sanduleak’s star of an OVIoptically thick region, which is approaching the observer with a velocity of
∼20 km s−1. A description of this emitting component within the framework of our scenario is discussed in Section 3.4.
2.2. MIKE Spectrum of Raman OVI Bands
Optical high-resolution spectroscopic observations of San-duleak’s star were carried out on 2010 November 21, using the MIKE spectrograph at the 6.5 m Magellan-Clay telescope, Las Campanas Observatory in Chile. The spectrograph delivers full wavelength coverage from about 4900–10000Å in its red configuration: with the 0.7×5 arcsec slit we used, the spectral resolution wasR∼32,000(Bernstein et al.2003). The scale of the CCD is about 7.5 pix arcsec−1(0.13 arcsec pix−1), therefore we binned the detector in the spectral and spatial direction to maximize signal-to-noise ratio. We took a series of 3×900 s exposures. Data reduction was performed under IRAF following the standard procedure.
In Figure2, we display the Sanduleak’s star Raman-scattered OVIλλbands at 6825 and 7082Å. It is noticeable that the two bands have quite different profiles: while the Raman 6825Å band exhibits a single-peak profile with a redward extended bump, the Raman 7082Å band reveals a distinct triple-peak profile. In order to make a quantitative comparison of the two optical profiles, we convert the observed wavelength to the OVIparent Doppler factor as follows: adopting the refractive index of air nair=1.0002763 (Ciddor 1996), the air
wave-lengthλobsis transformed into the vacuum wavelengthλvacby
( ) lobs airn =lvac. 2
We then introduceλf, the vacuum wavelength corrected for the systemic velocity vsys, as
( )
Using the energy conservation principle, wefind the corresp-onding far-UV wavelength of incident OVIphoton
( )
The OVIcentral wavelengths of Equation(1)are then used to obtain the Doppler factorsΔVatomic:
( )
The presence in Sanduleak’s star of a highly collimated jet (Angeloni et al. 2011) and of Raman OVI bands exhibiting multiple-peak profiles(Figure2)implies that a plausible model of its OVIemission nebula should at least foresee an accretion disk and a bipolar outflow. Moreover, the F(1032)/F(1038) deviation from 2 discussed at the end of Section2.1calls for the inclusion of an additional emitting region characterized by a high optical depth. Our schematic layout of Sanduleak’s star is presented in Figure3.
Based on the observed profiles of the Raman-scattered OVI
bands presented in Figure2, we reconstruct in Figure4the OVI
far-UV resonance doublet by combiningfive emitting compo-nents: three arising from the accretion disk; one from the bipolar outflow; one from the optically thick nebula. For the sake of simplicity, each component is described by a Gaussian function characterized by a central velocityΔVatomic, a FWHM
Δv,and a peak valuef, the latter normalized at the peak value of the 1032 line.
Before the detailed discussion of each component with our corresponding physical interpretation, it is worth clarifying once again that the reconstructed OVIλλ1032 and 1038Åline profiles are the ones seen by a hypothetical observer at rest with respect to the scattering region (which we assume stationary with respect to the donor star) and can be perfectly (in fact, almost always are)different from the actual observed profiles (Figure1), which are strongly dependent on the observer point of view.
Figure 2.The Raman-scattered OVIbands at 6825Å(left)and 7082Å(right)in Sanduleak’s star. The upper horizontal axis corresponds to the Doppler factor space ΔVatomic, whose origin has been chosen at the OVIline central wavelength in vacuum. The vertical bar in the left panel indicates the red bump and the three vertical
3.1. Blue Emission Part(BEP)and Red Emission Part(REP) from the Accretion Disk
As shown in the previous sections, the Raman OVI7082Å band exhibits a quite distinct triple-peak structure, which is not reproduced in the Raman OVI6825Å band—probably because it is severely overwhelmed by the other emission components. Since the central peak is considerably narrower than the blue and the red peaks, we explain these latter ones as originating from the accretion disk, and fit them with Δv∼28 km s−1. The association of the blue and red peaks with an accretion disk is supported by their peak separation (∼70 km s−1), which is comparable to Keplerian motions proposed for other D-type symbiotic stars(Lee & Kang2007). Since our interest is mainly focused on the kinematics of the OVI emission region with respect to the neutral hydrogen scattering region, we introduce the parameter ΔVOVI, and set
its zero-point at the average velocity of the blue and red peaks (shown by dotted lines in Figure4).
The Gaussian component corresponding to the blue peak has ΔVOVI=−34 km s−
1
, and stems from the part of the accretion disk approaching the scattering region. The Gaussian component corresponding to the red peak has ΔVOVI=+34 km s−
1, and it comes from the part of the
accretion disk which is receding from the scattering region. Hereafter, we refer to these subregions of the accretion disk as BEP and REP, respectively.
By noting that the red peak is conspicuously stronger than the blue peak, we can further deduce that the accretion flow must be quite asymmetric. SinceF(1032)/F(1038)decreases from 2 to 1 as the optical depth of an emitting region increases, we naturally assign F(1032)/F(1038)=2 to BEP and 1 to REP. This general result is consistent with hydrodynamic simulations of a white dwarf and a mass-losing giant in wide binary systems, which show how a stable accretion disk can be formed with size ranging from sub AU to tens of AU (e.g., Mastrodemos & Morris1998; de Val-Borro et al.2009; Huarte-Espinosa et al. 2013), and also with 3D high-resolution hydrodynamic simulations of the recurrent nova RS
Oph (Walder et al. 2008), which clearly show a density asymmetry in the wind accretionflow.
3.2. Central Emission Part(CEP)in the Accretion Disk
Because the line profile from a disk in Keplerian motion has a nonzeroflux at the line center, just summing up the BEP and REP contributions fails to account for the emission from those parts of the accretion disk with null radial velocity component. Also, in order to explain why the Raman OVI 7082Åband exhibits a triple-peak structure while the OVI6825Å band does not, it is necessary to invoke the contribution in the OVI
Figure 3.Schematic model of Sanduleak’s star. The OVIemission region is assumed to consist of an accretion disk, a bipolar outflow, and a further optically thick, compact component. See text for details.
Figure 4.Profile synthesis of the far-UV OVIλλ1032, 1038 based on the observed Raman bands in Sanduleak’s star. The OVI emitting nebula is reconstructed by summing up the contribution of three emitting regions from
(a)BEP, REP, and(b)CEP of the accretion disk,(c)the bipolar outflow, and
emission region of an optically thin gas characterized by F(1032)/F(1038)=2, and ΔVOVI∼0, i.e., at rest with
respect to the scattering region. In analogy with the previous case, we name this component CEP, where with the word
“center”we just identify that emitting component which fills the gap between REP and BEP in the Doppler factor space.
Because this optically thin component is quite significant in flux, the associated emitting region must also be quite extended: the considerable emission volume leads to a wide occupancy in velocity space, thus resulting in broad Gaussians. Our best fit is obtained for ΔVOVI=6 km s−
is revealed in the OVI 7082Å band at the same velocity position.
To explain such (lack of) evidence, we suggest that this emitting component has to be associated with the bipolar outflow, which appears to be receding from the scattering region. The best fit is for Δv∼67 km s−1, and F(1032)/F (1038)=2. In this way, the contribution of this component to the OVI7082Å profile is relatively smaller than to the OVI6825Åprofile, thus explaining why the red bump clearly appears in the latter, but is absent in the former profile.
3.4. Optically Thick Compact Component
Even with the inclusion of an optically thin component (Section3.2), the sharp central peak of the Raman 7082Åband is poorly reproduced. A more satisfactoryfit could be obtained including a fairly weak, narrow component atΔVOVI∼0. By
introducing an emitting component characterized by ΔVOVI=+5 km s−1, Δv∼11 km s−1, and F(1032)/F
(1038)=1 we sensibly improve the 7082Å fit without altering the 6825Å profile in a significant way. Also, we naturally take into account the evidence given by the FUSE spectrum about the existence of an optically thick nebula in Sanduleak’s star (Section 2.1). This Gaussian function is enveloped by the Gaussian function used in Section 3.2: we cannot exclude the possibility that the optically thick compact component is spatially part of the extended tenuous component. The association of this component with a specific emitting region is, however, not intuitive and far from simple. One may speculate that a local density enhancement in the accretion stream, for example in the form of spiral structures, could represent a possible explanation, as also suggested by the numerical work of Walder et al.(2008).
To summarize, Table1lists the resulting parameters of each Gaussian, while Table2 reports on the relative contribution of each component to the overall profiles. As can be seen, the dominant contribution is made by the accretion disk, which takes up 70%, whereas the bipolar outflow contributes about 20% for Raman 6825, and 15% for Raman 7082. Although the optically thick component contributes only less than 10%, its inclusion in the model of this region is essential for explaining the small excess revealed by theFUSEspectrum and the triple-peak profile, which is only visible in the Raman 7082 band.
4. MONTE CARLO SIMULATION
The flux ratio of the two Raman OVI bands F(6825)/ F(7082)can be used as a rough proxy to classify a symbiotic star into D-type or S-type. According to Schmid et al.(1999), in fact, D-types tend to showF(6825)/F(7082)∼6, while for S-types F(6825)/F(7082)∼3. The difference in F(6825)/ F(7082)seems mainly due to the different HIcolumn density NHI characterizing the Raman-scattering region in the two
types of symbiotic stars, where NHI tends to be larger in
S-types, because of their smaller binary separation compared to D-type systems. Our MIKE data show F(6825)/ F(7082)∼4.5, which is an intermediate value between S-and D-type symbiotic stars.
In this section, we perform Monte Carlo simulations in order to estimate the representative value ofNHIin Sanduleak’s star
by reproducing the observedF(6825)/F(7082). We consider a cylindrical neutral scattering region characterized by a column densityNHI measured along the cylinder axis. We place it in
front of the giant hemisphere, which is facing the white dwarf. We align the scattering region, assumed stationary with respect to the white dwarf, so that the cylinder axis coincides with the axis connecting the two stars. We vary values of NHI from
1×10²² to 5×1023cm−2when the simulated profile for the Raman 7082Åband becomes stronger than the observed one. The simulation starts with a generation of an OVI photon (according to the input profiles given in Figure 4), which subsequently enters the scattering region. The OVIphoton then moves around through Rayleigh scattering processes and
Table 1
Doppler Factors, Corresponding Central Wavelengths, FWHM(Δv), and Peak Values of the Five Gaussian Components Discussed in Section3—See Text for the Details
Emission Region ΔVatomic ΔVOVI λ1032 λ1038 Δv f1032 f1038
(km s−1) (km s−1) (Å) (Å) (km s−1)
Accretion Disk(BEP) −20 −34 1031.859 1037.549 28.3 0.22 0.11
Accretion Disk(REP) 48 34 1032.093 1037.784 28.3 0.22 0.22
Accretion Disk(CEP) 20 6 1032.997 1037.687 41.6 0.8 0.4
Bipolar Outflow 71 57 1032.172 1037.864 66.6 0.24 0.12
Optically Thick Compact 19 5 1032.993 1037.684 11.7 0.18 0.18
Table 2
Relative Contribution of Each Gaussian Component to the Overall OVIλλ
1032 and 1038ÅLine Profile(See Also Figure4)
Emission Region 1032 1038
Accretion Disk(BEP+REP) 0.232 0.296
Accretion Disk(CEP) 0.512 0.435
Bipolar Outflow 0.194 0.165
Optically Thick Compact 0.061 0.104
escapes from the scattering region once Raman-scattering occurs. A more detailed description of this family of Monte Carlo simulations can be found in Heo & Lee(2015).
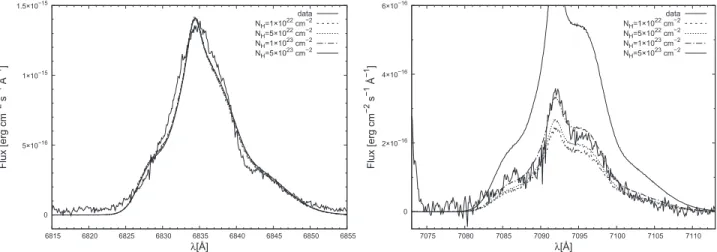
In Figure 5, we show the results of our Monte Carlo simulations of the Raman-scattered OVIλλ 1032, 1038 profiles for various values of NHI, superposed on the 2010
MIKE data. We normalize the simulated spectra with the observed Raman 6825Å band and look for the best-fitting profile of the observed Raman 7082Å band. A good fit is obtained for NHI∼1×10
23cm−2. Our Monte Carlo result
shows that F(6825)/F(7082)>5, appropriate for D-type symbiotic stars, are obtained for NHI<10
22
cm−2. On the other hand, for NHI>3×10
23cm−2the flux ratio becomes
lower than 4, resulting in a poor fit.
5. DISCUSSION AND CONCLUDING REMARKS
In this work, we have presented a systematic analysis of the Raman-scattered OVI bands in Sanduleak’s star. Following a Gaussian decomposition scheme, we successfully fit the profiles of Raman OVI6825 and 7082Åbands by assuming that the OVInebula can be decomposed into several emitting components, to be identified with the accretion disk, the bipolar outflow, and a further compact, optically thick component. We have also performed Monte Carlo simulations, from which we propose that the neutral region of Sanduleak’s star is characterized by NHI∼1×10
23cm−2.
When remembering the very definition of ΔVOVI and
ΔVatomic, it is suggested to interpret the difference between
ΔVOVIandΔVatomic(of the order of 14 km s−1)as the terminal
wind velocity of the cool component, which so far has escaped any direct detection and is at the origin of the controversial status of Sanduleak’s star.
One physical mechanism, which may contribute to the redward spectral shift, can be found in the asymmetric frequency diffusion of resonantly scattered line photons in an expanding medium. In a static medium, a line photon arising from a permitted transition is usually optically thick at its line center. This implies that the escape of a resonance line photon is made through frequency diffusion after a large number of local scatterings. However, in an expanding medium, a line photon shifted blueward in the frequency space will be scattered after it travels to a spot where the resonance condition
is satisfied. In this way, the blue part of line radiation is significantly suppressed to form a PCyg profile. Naively, we expect that locally emergent resonance line radiation in an emission region with an expansion speed of ΔV is shifted redward by the same quantity(e.g., Schmid et al. 1999). In a complex emission region, consisting of a number of emission components, each redward shift is convolved in a complicated way, which unfortunately cannot be disentangled by our present observations.
Spectropolarimetry has the ability to shed much more light on the detailed structure of the OVI emission region in symbiotic stars. Spectropolarimetric observations performed by Harries & Howarth(1996)showed, for example, that Raman-scattered OVI bands are strongly polarized, and that in many cases the red wing is polarized in the direction perpendicular to the polarization direction of the main part.
Interestingly, this behavior is naturally expected in our decomposition scheme in which the band red wing originates from the bipolar outflow, which indeed moves away in the direction perpendicular to the accretion disk. Our profile decomposition thus foresees that the emitting component associated with the outflow will be polarized in the direction perpendicular to the jet axis, whereas the remaining part will be polarized along it. Because the bipolar outflow component is mainly dominant in the red wing, we also expect the degree of linear polarization to be significant there. In a similar way, the blue wing will exhibit a fairly high degree of polarization along the jet axis. However, in the red main part where the REP component and the bipolar outflow component contribute, compensation of the two oppositely polarized components may result in a lower degree of polarization, which is strongly dependent on the relative contribution of each component to the overall profile.
In this context, spectropolarimetric observations represent a crucial validation test of our decomposition scheme and at the same time a unique opportunity to clarify the astrophysical nature of Sanduleak’s star.
We are grateful to the anonymous referee for useful comments. We also thank Kwang-il Seon for his help.FUSE data, presented in this paper, were obtained from the Mikulski Archive for Space Telescopes(MAST). STScI is operated by the Association of Universities for Research in Astronomy,
Inc., under NASA contract NAS5-26555. Support for MAST for non-HST data is provided by the NASA Office of Space Science via grant NNX09AF08G and by other grants and contracts. This research was supported by the Korea Astron-omy and Space Science Institute under the R&D program (Project No. 2015-1-320-18) supervised by the Ministry of Science, ICT and Future Planning.
REFERENCES
Allen, D. A. 1980, ApL,20, 131
Allen, D. A. 1987, Forbidden Emission Lines-II(Netherlands: Springer) Angeloni, R., Di Mille, F., Bland-Hawthorn, J., & Osip, D. J. 2011, ApJL,
743, L8
Belczyński, K., Mikołajewska, J., Munari, U., Ivison, R. J., & Friedjung, M. 2000,A&AS,146, 407
Bernstein, R., Shectman, S. A., Gunnels, S. M., Mochnacki, S., & Athey, A. E. 2003,Proc. SPIE,4841, 1694
Birriel, J., Espey, B. R., & Schulte-Ladbeck, R. E. 1998,ApJL,507, L75
Birriel, J., Espey, B. R., & Schulte-Ladbeck, R. E. 2000,ApJ,545, 1020
Ciddor, P. E. 1996,ApOpt,35, 1566
Crowley, C., Espey, B. R., & McCandliss, S. R. 2008,ApJ,675, 711
de Val-Borro, M., Karovska, M., & Sasselov, D. 2009,ApJ,700, 1148
Dixon, W. V., Sahnow, D. J., Barrett, P. E., et al. 2007,PASP,119, 527
Eyres, S. P. S., Kenny, H. T., Cohen, R. J., et al. 2007,PASP,119, 855
Harries, T. J., & Howarth, I. D. 1996, A&AS,119, 61
Heo, J.-E., & Lee, H.-W. 2015,JKAS,48, 105
Huarte-Espinosa, M., Carroll-Nellenback, J., Nordhaus, J., Frank, A., & Blackman, E. G. 2013,MNRAS,433, 295
Joy, A. H., & Swings, P. 1945,ApJ,102, 353
Kang, E.-H., & Lee, H.-W. 2008,JKAS,41, 49
Lee, H.-W., & Kang, S. 2007,ApJ,669, 1156
Luna, G. J. M., & Costa, R. D. D. 2013,A&A,435, 1087
Mastrodemos, N., & Morris, M. 1998,ApJ,497, 303
Mikołajewska, M., Friedjung, M., & Quiroga, C. 2006,A&A,460, 191
Moore, C. E. 1979, NSRDS-NBS (Washington, DC: National Bureau of Standards)
Moos, H. W., Cash, W. C., Cowie, L. L., et al. 2000,ApJL,538, L1
Munari, U. 2012, JAAVSO,40, 572
Munari, U., & Zwitter, T. 2002,A&A,383, 188
Nichols, J., & Slavin, J. D. 2009,ApJ,669, 902
Nussbaumer, H., Schmid, H. M., & Vogel, M. 1989, A&A,211, L27
Sahai, R., Morris, M. R., & Villar, G. G. 2011,AJ,141, 134
Sahnow, D. J., Moos, H. W., Ake, T. B., et al. 2000,ApJL,538, L7
Sanduleak, N. 1977, IBVS,1304, 1
Schild, H., & Schmid, H. M. 1996, A&A,310, 211
Schmid, H. M. 1989, A&A,211, L31
Schmid, H. M., Corradi, R., Krautter, J., & Schild, H. 2000, A&A,355, 261
Schmid, H. M., Krautter, J., Appenzeller, I., et al. 1999, A&A,348, 950
Solf, J. 1984, A&A,139, 296
Walder, R., Folini, D., & Shore, S. N. 2008,A&A,484, L9


![CSRprincipleswhenestablishingtheirmission,vision,andgoals;inperspectivesonaction;andincorporatestrategies,aswellasindesigningtheirstudyprogramsandtheresearchprojectsthey ].Theseinstitutionsareinstrumentsthathelptoimprovethe playanessentialroleinpromotings](data:image/gif;base64,R0lGODlhAQABAIAAAP///wAAACH5BAEAAAAALAAAAAABAAEAAAICRAEAOw==)