Detection of potential overbreak zones in tunnel blasting from MWD data
J.
Navarroª'*, J.A. Sanchidriánª, P. Segarraª,
R.
Castedoª, E. Costamagnab, L.M. Lópezª
ªUniversidad Politécnica de Madrid - E. T.S.l. Minas y Energía, Spainb DIATI, Politecnico of Turin, Italy
ABSTRACT
The damage from blasting to the remaining rock mass is analyzed with the purpose of developing a drilling index from measure while drilling (MWD) parameters, able to predict high risk of poten tia! over- and under-excavated zones produced by blasting in the con tour of a tunnel. A new methodology based on the comparison of scanner profiles of the excavated sections with the position of the contour blastholes, has been developed to obtain the excavated mean distance (EMD) between the blasthole and the excavated profiles at each MWD record position, which may be considered as a damage measure. MWD parameters, that describe the in-si tu rock mass properties befare the blast, are thoroughly normalized to remove externa! influences that may hide the actual response of the rig to rock mass properties and lead to wrong interpretations. 54 blasts, which comprise around 1700 contour blastholes, have been compared with more than 4000 excavated sections. A non-linear multiple-variable power-form model has been developed to predict the excavated mean distance as function of the normalized penetration rate, hammer pressure, rotation speed, rotation pressure and water flow parameters, and the lookout distance. These parameters combine the rotational, hydraulic and percussive mechanisms of the drill, and the confinement of the explosive charge with depth. Sources of uncertainty, unavoidable in the harsh condition in which the data were measured, such as drilling deviations, the scaling and primary support prior to scanning the excavated section, possible variations (unrecorded) in the explosive linear density, etc., have been assumed to be of random nature.
l. Introduction
Rock excavation in mining and tunneling frequently use cautious blasting techniques. The primary objective of blasting is to fragment rock to allow loading and haulage, without creating extensive damage to the remaining rock mass. As Andersson (1994) defined: "Cautious blasting is a blasting that does not cause damage to the rock outside of the intended damage distance".
For a cautious blast design, the damage on the perimeter of the excavation is mainly induced by contour and buffer blastholes and it is created by a drop of strength, caused by the opening or shearing of newly generated or existing fractures or cracks (Scoble et al., 1997; Ouchterlony et al., 2002; Costamagna et al., 2018). In tunneling, da-mage can be categorized as major, minor or no dada-mage, when there is rock falling, chips detachment or no visual damage, respectively (Costamagna et al., 2018). Damage assessment is analyzed through four main indexes: (i) Rock Tunneling Quality Index (Q-value, Barton et al., 1974) as classification of the ground condition for underground ex-cavations; (ii) Blast Damage Factor (Hoek et al., 2002; Hoek, 2012) that estimates the global rock mass strength and the rock mass modulus; (iii)
* Corresponding author.
E-mail address: [email protected] (J. Navarro).
Blast Damage Index (Yu and Vongpaisal, 1996) that correlates the mechanics and the effects of wave propagation in to the rock mass; and (iv) failure approach index (Xu et al., 2017) that quantifies the rock mass damage through numerical simulations for tunnel support design. Overbreak on the contour perimeter, which is defined as the void created during the excavation in excess of an established perimeter or pay line (Mahtab et al., 1997), is usually correlated with the damage extension zone which measures the quality of the blast. Overbreak and underbreak are mainly influenced by the geotechnical condition of the rock mass (rock disturbances and rock strength) and blast design parameters such as the explosive type, the charge concentration, the blast timing, the drill pattern and the drilling deviations (Ibarra et al., 1996; Oggeri and Ova, 2004; Singh et al., 2003; Singh and Xavier, 2005; Hustrulid, 2010; Johnson, 2010). Blasting affects the rock mass structure because of shock wave propagation (vibrations), gas pressure and stress redistribution (Singh et al., 2003; Hu et al., 2014).
legislation and special terms can be arranged between the two parts in the contract (Olsson, 2010; Costamagna et al., 2018). For example, Scandinavian countries present similar regulations for tunneling ex-cavation requirements (Anlaggnings-AMA in Sweden, InfraRYL in Fin-land and the Norwegian Public Roads Administration, NPRA, in Norway; Olsson, 2010; SN, 2004; NPRA, 2004). Consequences of abad drilling can be short pulls of the rounds, increase of rock reinforcement due to extra overbreak in the rock mass, longer scaling and mucking time and bad control of grouting.
To analyze the extension of the overbreak, studies have been carried out by comparing the laser profile of the excavated perimeter with the designed tunnel profile. Kwon et al. (2009) investigated the char-acteristics of the excavation damage zone (EDZ) in a tunnel construc-tion and carried out a sensitivity analysis of the predicted EDZ with severa! rock mass parameters obtained from laboratory and in situ tests. They determined that in situ stress ratio, Young's modulus and EDZ were the three main parameters in rock mass behavior after blasting. Manda! and Singh (2009) measured the overbreak, dividing the contour profile in three sections: left wall, right wall and crown. They found that the crown is more affected by overbreak, due to the stress conditions in this zone. Kim and Bruland (2009, 2015) estimated a tunnel contour quality index (TCI) based on overbreak distances of cross-section scanners, contour roughness and longitudinal overbreak variation in each blasted round. Costamagna et al. (2018), used scanned tunnel profiles to assess the overbreak of the excavated void in relation to the intended theoretical section, and correlated this with the rock mass conditions of each round.
Rock excavation techniques are highly influenced by the geo-mechanical properties of the rock mass (Oggeri and Ova, 2004; Singh et al., 2003; Singh and Xavier, 2005; Mahdevari et al., 2013). A site investigation for a tunneling project generally includes a description of the rock condition and a rough estimation of the rock mass structural properties; however, during the operation, unexpected anomalies that may influence the results of the operation often occur. Such anomalies can be detected by Measure While Drilling (MWD) system on modern jumbos. This has been described by Schunnesson (1997) as a drill monitoring system which logs drilling data at predetermined length intervals providing information of the operational parameters involved in drilling. For rotary drilling, Teale (1965) and Liu and Yin (2001) introduced the concept of specific energy (SE) as the energy required to excavate a unit volume of rock. Scoble et al. (1989) studied the varia-tions of monitored parameters to define different geological formavaria-tions. Hatherly et al. (2015) compared the MWD data with the geological rock conditions, obtained by geophysical logs, and demonstrated that if ro-tary speed and weight on bit are kept constant, MWD measurements can determine rock properties. Leung and Scheding (2015) have de-veloped a coal-seam detection model called SEM (modulated specific energy).
In relation to studies developed for percussive and rotary-percussive drilling, Schunnesson (1996) used the logged parameters of percussive drilling to develop a method for estimating Rock Quality Designation (RQD, Deere and Miller, 1966) based not only on the penetration rate and torque parameters, but also on their variation, which shows a close correlation with the presence of large discontinuities, fractures or major faults. Schunnesson (1998) and Hjelme (2010) introduced a new methodology to normalize percussive and rotary-percussive drilling parameters, to remove externa! influences generated by the blasthole length and the drill rig performance. Peng et al. (2005) and Tang (2006) proposed a method for void/fracture detection and for prediction of the rock mass properties based on drilling for roof bolting. They found that the feed pressure is a good detector of anomalies or discontinuities in the rock and is a good estimator of the rock mass strength. In addition, Peng et al. (2005) designed a new methodology for normalizing MWD parameters based on determining the performance of the machine when drilling the air (i.e. for no-load condition, outside the rock mass). This assesses how much feed pressure or rotation pressure is required for
running the machine itself. From the correlation of MWD data with rock mass geo-mechanical measures, Schunnesson et al. (2011) suggested a model for the hydraulic properties of the rock mass, based on the monitored water flow and water pressure during rotary-percussive drilling. Schunnesson et al. (2012) explained a methodology to assess rock strength ranges based on a MWD hardness index provided by Atlas Copeo software. For that, they used Schmidt hammer to correlate MWD values with empirical rock strength measurements. Naeimipour et al. (2014) developed a void detection algorithm based on MWD para-meters. The algorithm was calibrated on full scale experimental tests in concrete blocks with various strengths. Kahraman et al. (2016) found a strong correlation of the penetration rate with the uniaxial compressive strength (UCS), the Brazilian tensile strength, the point load strength and the Schmidt hammer. Van Eldert et al. (2018) assessed the extent of the damage zone from MWD parameters and ground penetration radar measurements recorded along the tunnel wall.
Finally, Atlas Copeo AB, Sandvik and Bever Control have developed their own software (Tunnel Manager MWD, iSURE and Bever Control, respectively), as a too! for planning, administration and evaluation of drilling. From the MWD files collected, the blastholes can be re-presented in 3D, and hardness and fracturing maps are provided. The theoretical background for this information is however confidential.
Although there are many studies focused on the overbreak control by blasting effect on the one hand and on geological and geo-me-chanical interpretation of the rock mass by using MWD on the other, no relation between MWD parameters and overbreak (i.e., under or over excavation with respect to the theoretical tunnel contour line) from blasting exists. This paper aims at developing an engineering too!, based on MWD parameters, able to predict high-risk of overbreak po-tential zones generated on the perimeter of a tunnel face excavated by blasting. For that, scanner profiles of excavated sections have been compared with the contour blastholes position, to obtain the excavated mean distance (EMD) created by each hole. Given that blasting vari-ables (mainly explosive charge and timing) are constant in contour blastholes (as from blast reports), the overbreak and underbreak are considered mainly influenced by the geotechnical condition of the rock mass. Since the MWD system can characterize the rock mass condition of the blastholes, these measures can be correlated with the excavated mean distance (EMD) calculated along the depth of each blasthole. The analysis will match high over-excavated zones with highly fractured or softer rock masses before the blast, and low excavated measures with competent rock.
2. Data overview
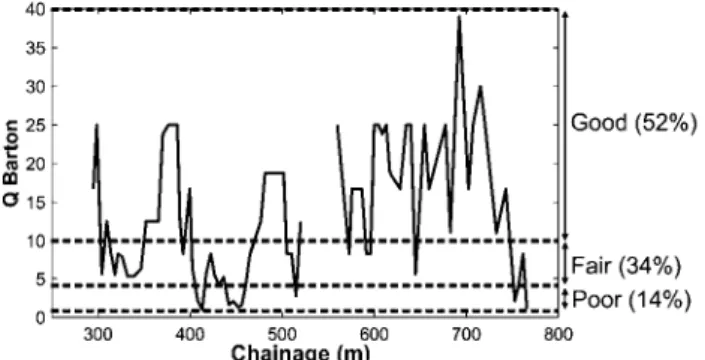
The study has been developed in the underground extension work of the municipal wastewater treatment plant in Bekkelaget (Oslo), Norway. The facility comprises five caverns, a main access gallery of about 850 m length and other sections. The construction was developed in competent rock mass, composed by gneiss with small tonalite and quartzite intrusions. The Rock Tunneling Quality Index (Q-value; Barton et al., 1974), obtained from visual inspection of the tunnel face, was used as classification of the ground condition. Fig. 1 plots the Q-value versus the chainage for the rounds analyzed in the study. They comprise 54 rounds located between chainages 294-518 and 560-772 of the main gallery (making up more than 400 m). Fig. 1 also shows the classification of the rock mass based on the Q-value index; rock mass condition generally qualified as good and fair.
35
30
e: 25
o
~ 20 ce
o
15 105
300
Good (52%)
400 500 600 700 800
Chainage (m)
Fig. l. Rock Tunneling Quality Index; Rock Tunneling Quality Index versus chainage and classification of the ground condition: poor (1 < Q ,,; 4), fair (4 < Q,,; 10), good (10 < Q,,; 40).
These are described next as an extension of Peng et al. (2005), Beattie (2009), Hjelme (2010), Schunnesson et al. (2011), Schunnesson and Kristoffersson (2011) and Navarro et al. (2017) interpretations; the acronym and the units for each parameter are given in brackets.
- Feed Pressure (FP, bar): measure ofthe hydraulic pressure inside the cylinders. Feed pressure is required not only to keep the bit in contact with the bottom of the hole throughout the transmission of energy, but also to maintain a minimum force between bit and rock to maximize energy transfer to the rock.
- Hammer Pressure or Percussive Pressure (HP, bar): this is a measure of the impact pressure acting on the pistan in the rock dril!. - Damp Pressure (DP, bar): it measures the pressure absorbed by the
drill rig to prevent vibrations or undesired motion in the boom or drill rod.
- Rotation speed (RS, rpm): it is defined as the number of turns of the bit per minute.
- Penetration Rate (PR, dm/min): rate of penetration of the drill bit through the rock mass.
- Rotation Pressure (RP, bar): it is the torque pressure required to rotate the bit at a defined speed.
- Water Pressure (WP, bar): it is the pressure ofthe water used to flush the drill cuttings from the blasthole.
- Water Flow (WF, l/min): it is the rate of water inflow into the drill rod
- Hole Length (HL, m): depth at which each sample of the above parameters is logged.
The charging of the rounds was carried out with emulsion of dif-ferent linear charge for difdif-ferent types of blasthole: cut, lifter, easer, buffer, con tour. String loading method was used for the charging of the contour blastholes, with a design linear charge of 0.5 kg/m. This is assumed to be constant in the analysis. The actual charge of the holes may vary from the design value. However, such variations are assumed to be random so that, although they are a source of indetermination in the analysis, they will not bias the influence of the other parameters in the overbreak from blasting.
3. Analysis of the excavated area
3.1. Jumbo navigation
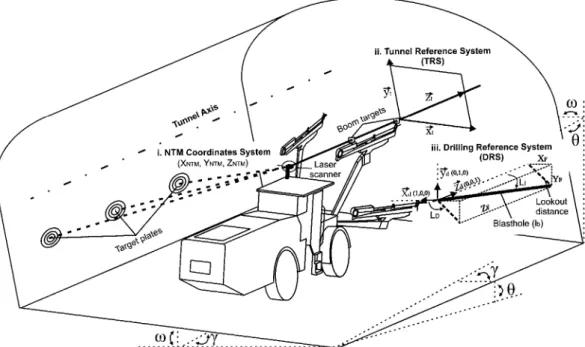
Navigation is necessary to locate thejumbo inside the tunnel befare drilling a new round. For that, the jumbo rig uses three reference sys-tems, sketched in Fig. 2: (i) an absolute coordinate system that refer-ences the position of the jumbo, in this case the EUREF 89 Norwegian Transverse Mercator (NTM) projection, (ii) a Tunnel Reference System (TRS) with one axis parallel to the tunnel axis and the other two in the plane of the tunnel face of the new round, and (iii) a Drilling Reference
System (DRS) defined by two vertical planes XctYct, YctZct and a hor-izontal XctZct plane. The angles of the TRS axes with the DRS ones are
e,
w and y (see Fig. 2).
3.1.1. NTM coordinates system
The position of the jumbo inside the tunnel is first obtained, see Fig. 2 (i. NTM coordinate System). The jumbo has a laser scanner in-stalled. In addition, target plates, with known coordinates, are located along the tunnel wall at every 5 m distance. The absolute coordinates of the jumbo are calculated by trilateration (i.e. distance measurement from the laser scanner to the target points). In this case study, XNrM,
ZNTM coordinates are given in the NTM projection and YNTM is the height above sea leve!.
3.1.2. Tunnel Reference System (TRS)
The drill rig is aligned with the tunnel line (perpendicular line to the face of a new round that defines the orientation of the drilling) in order to follow the design of the construction. For that, two targets are mounted on one of the booms. The laser beam points to the free face in the direction of the tunnel axis and the boom is rotated until the laser beam passes through both targets (Fig. 2, ii. TRS). The boom is so aligned with the tunnel axis and the orientation and inclination of the boom are registered in three orthogonal vectors
cX;,
Y,,
Z,)
to create a coordinate system parallel to the tunnel axis and the free face.The laser scanner also measures the distance from the jumbo to the face of the new round and records the chainage at which it is located inside the tunnel. This chainage is taken as reference plane of the col-laring depth position of the blastholes. Negative depth values are as-signed to measurements behind this plane, and positive values, to measurements ahead of this plane.
3.1.3. Drilling Reference System (DRS)
The blasthole position measured by each boom is calculated in the Drilling Reference System defined by means of three spherical co-ordinates: blasthole length (lb), azimuth or lookout direction (Lv) and inclination or lookout angle (Lr) (see Fig. 2):
(1)
(2)
(3)
The inclination angle varies between O and 90º both for holes drilled upwards or downwards so that the azimuth is between O and 180º for holes drilled upwards and between O and -180º for holes drilled downwards.
Blasthole positioning data logged by the ABC system uses sensors installed along the boom (outside the blasthole) to measure the azimuth and the inclination angles. The semi-automatic ABC total system in-stalled in the drill rig authorizes the operator to move the boom and feeder manually to follow a predesigned drill plan (Navarro et al., 2018). Once the boom is placed in the required position and befare the drilling starts, the measurements of the azimuth and inclination angles are logged in the DRS. These are considered constant as the boom re-mains still while drilling the blasthole. The end coordinates of the blasthole are calculated by adding, to their collaring coordinates, the result from Eqs. (1), (2) and (3). Since deviations beyond the collaring point cannot be measured by the MWD technology there is a possible error between the actual end position of the blastholes and the end position given by the MWD system. Drill deviations have not been monitored so they are a source of indetermination in our analysis that, as those mentioned in Section 2, is assumed to be of random nature.
3.1.4. Transformation system IRS-DRS
Fig. 2. Representation of the three reference systems involved in the jumbo navigation: i. NTM Coordinates System, ii. Tunnel Reference System, iii. Drilling Reference System.
Rotation of X1Z1 plane around Yt Axis Rotation towards right and left
Rotation of YtZt plane around Xt Axis Uphill - downhill inclination
Rotation of X1Y1 plane around Zt Axis Lateral inclination
Fig. 3. Transformation from drilling reference system
cX'd.
Xi.
Zd)
to tunnel reference systemcX,.
Y,.
Z,).
Left: Rotation towards right and left, or bearing angle, overY,;
center: uphill-downhill inclination, or elevation angle, rotation overX,;
right: lateral inclination, roll or bank angle, rotation overZ,.
ZNTM) are presented at the end of each MWD file. The three rotation angles to transform the DRS coordinates of a point in a borehole to the TRS can be seen in Fig. 2 and are further explained in Fig. 3.
This transformation is required below in arder to know the exact position of the blasthole collars and their orientation. The location of the oriented blastholes in absolute coordinates (Xt,NTM• Yt,NTM• Zt,NTM) is obtained by adding the NTM coordinates of the jumbo (XNrM, YNTM, ZNTM) to the oriented coordina tes of the blastholes (X,, Y,, Z,) in the TRS system.
3.2. Superposition of excavated profiles and contour blastholes
A laser scanner system has been used to monitor the final profiles of the excavated void from each blast. The laser was located in the center of the excavation to be scanned and target spheres were installed along the wall of the main gallery in places with known coordinates. The software of the scanner identifies the position of the spheres in a post-analysis of the 3D cloud of points and trilaterates the location of the scanner by measuring distances from the later to the spheres. Profiles of the excavated void in a direction perpendicular to the tunnel line are collected at steps of 0.2 m from the 3D cloud of points; each profile is
identified by its respective chainage. An interface AutoCAD-Matlab (AutoCad, 2017; Matlab, 2017) has been created to automatically compare the excavated profiles with the contour blastholes for each round. The profile formed by the contour hales (hereinafter named contour profile) is compared with the scanner profiles of the excavated sections in arder to obtain the excavated mean distance between the blasthole and the scanner section at each depth for which MWD data are logged. This distance is considered as an indicator of the resulting damage (i.e. over-excavation).
- Blasthole Contour profile - Excavated section profile
• Blasthole extended at the chainage of the excavated section
16
15
14
13
I12
>-a)
1110
9
8 6
-2
X(m) -4
16
15
14
13
I12
>-11 10
9
8
7 6
-6 398
b)
406
404
2
o
400398 Z(m) -6
Fig. 4. Chainage 399. (a) Contour hales profiles and position of the blastholes; (b) Overlapping between the contour profiles and the excavated section profiles.
actual excavated contour from the blast. However, an unknown un-certainty still remains.
The comparison between excavated and contour profiles must take into account the lookout angle and lookout direction values for each blasthole, which make them to be outward oriented. Since no deviation data of the blasthole is available, it is assumed that the lookout in-creases linearly with depth. Eqs. (1) and (2) are used to calculate the theoretical position of the blasthole at each excavated profile depth in the local Drilling Reference System (DRS). Variables Lr and Lp are ob-tained from the MWD files and lb is the length of the blasthole from the collaring position to the respective excavated profile depth (Zp, see Fig. 2), obtained with Eq. (3).
Irregularities on the free face of a new round cause the collars of the blastholes not to be in the same plane, so they have different collar depths. In addition, sorne excavated profiles (mainly profiles at the beginning of the round) are not influenced by ali contour holes of the current blast but for from the previous one. Each blasthole is extended from the foremost collaring hole to the depth of the deepest blasthole of each round to calculate the excavated area for ali profiles included in a round. Fig. 4a represents the contour profiles (cyan lines), the position of the blastholes (black lines) and their extensions (tiny blue dots).
To carry out the analysis, both contour and excavated profiles must be overlaid. Excavated profiles from AutoCAD files are drawn in a vertical .xy plane, where the Y coordina te is referred to the Y NTM
ab-solute coordinate and the hypothetical Z coordinate, i.e. depth of the .xy
plane, is indicated by the chainage at which it is located. The contour blastholes coordinates in the DRS must be rotated to the TRS. Since the rounds studied belong to the main gallery and they are excavated in a straight line, the .xy and xz planes for both TRS and DRS coincide (angles y and w are O); only plane y17, is rotated in case the tunnel axis is uphill (positive
e
angle) or downhill (negativee
angle), see Fig. 3. The rotation of the DRS contour blastholes coordinates (Xd, Yd, Zd) to the TRS (X,, Y,, Z,) is obtained by introducing the three angles (B, y = O,w = O) in a 3D rotation matrix. The translation of the Y, and Z, co-ordinates is carried out by adding the YNTM and the chainage values of the round studied, respectively. Fig. 4b sketches the overlapping ofboth excavated (red lines) and contour holes (blue lines) profiles for a round.
3.3. Excavated mean distance from the blasthole
The overbreak created around the blasthole by blasting is caused, among other factors, by the combination of the explosive and the rock mass condition around the blasthole (Hustrulid, 2010; Johnson, 2010). Considering the contour blastholes position per round, an Excavated Mean Distance (EMD) has been defined (Fig. 5). It corresponds to the area between the midpoint of the spacing on both sides of the hole and the excavated profile, normalized by the distance between the mid-points of the spacing on both sides of the blasthole. When two adjacent holes are on the same side of the excavated profile, the EMD is calcu-lated by (Fig. 5, EMD 1):
EMD=~
21.
+
~2 2 (4)
where 51 and 52 are the spacing between the current blasthole and the
• Mid-spacing -
Excavated Profile
0
Blasthole • lntersection from the mid-spacing
with the excavated profile
EMD 1 (Eq. 4)
EMD 2 (Eq. 5)
o
3
2
. 1
S2/2
Js112
1
o
Void
adjacent ones (they are generally around 0.7 m); An is the area ex-cavated by each blasthole defined by points 1, 2, 3 and 4 in Fig. 5, EMD 1; it is positive when there is over-excavation and negative for under-excavation.
In case two consecutive blastholes are located one inside and the other outside of the excavated profile, corresponding to over and under-excavation (Fig. 5, EMD 2), the total excavated area is obtained by adding both areas with their respective sign:
EMD = AT2
+
AnLa Lb (5)
where Ar2 is the area defined by 5, 6 and Pint (Fig. 5, EMD 2); AT3 is the
area defined by 7, 8 and Pint (Fig. 5, EMD 2); Pint is the intersection point between the excavated profile and the line joining two adjacent blast-holes; La and Lb are the distances between Pint and the mid-spacing point between the current blasthole and the adjacent one.
The scanner profiles and the EMD values per blasthole are evaluated at 0.2 m intervals. The MWD sample interval is 0.1 m and the collaring chainage of each contour blasthole differs due to irregularities of the free face. Thus, the actual chainage of the MWD logs of each hole varies so that the position of the measurements recorded by the MWD system does not coincide with the depth of the calculated EMD values. A pie-cewise cubic Hermite interpolating polynomial (Fritsch and Carlson, 1980) is used to interpola te the EMD values at the specific depths of the MWD logs.
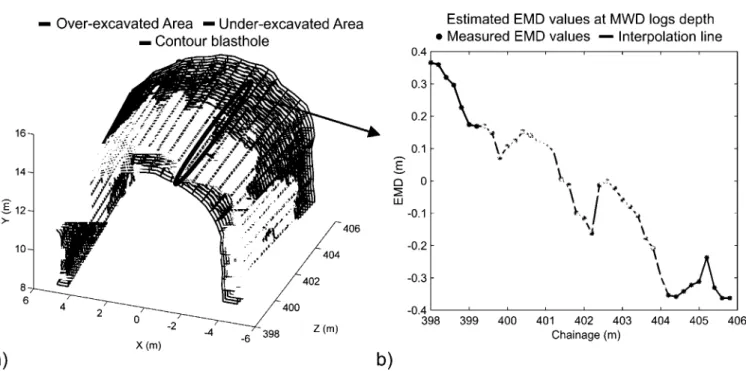
As an example, Fig. 6a shows the area of influence of each blasthole (ATl or AT2
+
AT3 in Fig. 5), calculated every 0.2 m for a round be-tween the chainages 398 and 406 m; over- and under-excavated areas are plotted in different colors and the contour blastholes are marked in black. Fig. 6b represents the EMD values for one of the blastholes in graph a (that includes the backwards and forwards extensions, as ex-plained above) versus chainage. It shows the EMD calculated (black dots), the cubic interpolation of the EMD calculated (red line), and the estimated EMD values corresponding to the MWD depths logged (blue dots).4. MWD data processing
The response of MWD parameters is often affected by externa! in-fluences different than the rock mass, such as the calibration of the
a)
16
14
10
8 6
Over-excavated Area - Under-excavated Area
- Contour blasthole
X(m)
monitoring sensors, the hole length and/or the drill rig performance (Schunnesson, 1998). The control system of the jumbo, during the ad-justment of the parameters while drilling, induces systematic variations in the MWD data. Ali together, they add uncertainty to the data that must be previously normalized in order to highlight changes in the parameters by the rock effect. This process comprises: (i) filtering out of unrealistic data, (ii) removing of the ramp-up section of the logs, (iii) correction of systematic variations in the MWD parameters such as the effect ofhole length and feed pressure influence and (iv) normalization with the standard deviation to account for fluctuations in the signals. Fig. 7 shows a flow chart of the filtering and corrections applied to the raw MWD data, with the acronym used after each step.
4.1. Filtering of unrealistic values
Production data often includes unrealistic high and low perfor-mance values of the jumbo, which may lead to a wrong interpretation of the MWD data (Ghosh et al., 2015). A new fil ter of the data is developed before any further analysis. For that, the empirical probability dis-tribution function of each MWD parameter is built from the complete data set values (54 blasts, comprising more than 6500 blastholes). The 95% confidence interval of MWD parameters defines the interval to retain data for the analysis. Fig. 8 shows the cumulative distribution functions (CDF) of the eight parameters, where the black dashed hor-izontal lines mark the 95% coverage and the vertical lines mark the corresponding limits of the parameters, given in Table l.
4.2. Removing of ramp-up operation mode
The control system is normally based on three main operational modes (Schunnesson, 2017; Navarro et al., 2018): (i) collaring, (ii) ramp-up, both of which control the increase of the drilling pressure to minimize hole deviations, and (iii) normal drilling, which controls the performance of the parameters to optimize the operation and minimize damages to the drill system. As can be seen in Fig. 9, the feed pressure (FP) shows, initially, a sharp rise (ramp-up mode) until it reaches a pre-set threshold at which it stabilizes (normal drilling mode). Only values included in the normal drilling mode are considered for the analysis, as data in the ramp-up mode are not representative of changes in the rock mass conditions. Signals of the 8 parameters have been divided
b)
0.3
0.2
0.1
I
o
o
~
w
-0.1
-0.2
-0.3
Estimated EMD values at MWD logs depth
• Measured EMD values -
lnterpolation line
-0.4 ~-~--~--~--~--~-~--~--~
398 399 400 401 402 403 404 405 406 Chainage (m)
Raw data
i.Filtering of unrealistic values &
ii.Removing of the ramp-up section
1
Mwol---IMWDc1I
J
iii.Hole length
iii.Feed pressure
correction
iv.Signal fluctuation
correction
IMWOcJI---- IMWDc2I
Fig. 7. MWD data processing flow chart.3,:u-:
0 _ 1
o
20 40 60PR(dm/min)
s":r- --)
o
50 100 150FP (bar)
8
O:
[,,,,,,==="''~7:..__~L¡
_
_ jo
100 200 300 400RS(rpm)
10 20 30
WP (bar)
o
50o
50:ZI
100 150 200 250 HP (bar)
100 DP (bar)
150
[
.Zi
o
[]
o
5050 100
RP (bar)
100 150 200 WF(l/min)
150
250
Fig. 8. Cumulative distribution function of the MWD parameters. Units and acronyms are given in Table l.
Table 1
Range of reasonable values of the MWD parameters as from their 95% coverage.
Parameter Acronym Units Range
Penetration rate PR dm/min 1-38
Hammer pressure HP bar 130-235
Feed pressure FP bar 20-80
Damp pressure DP bar 45-100
Rotation speed RS rpm 170-310
Rotation pressure RP bar 35-80
Water pressure WP bar 12-22
Water flow WF l/min 54-175
considering the point at which the feed pressure stabilizes. Values be-fare this point comprise the ramp-up data set and forward values the normal drilling data set. The latter will be referred as MWDci·
4.3. Hale length and feed pressure corrections
Systematic variations generated by the drilling system and other parameters can be estimated and removed by averaging, for a large amount of data, the response of the parameters (Schunnesson, 1998; Hjelme, 2010). Schunnesson (1998), Hjelme (2010) and Ghosh (2017) described a significant hole length dependence in sorne parameters for percussive, rotary-percussive and Wassara water-hydraulic DTH drilling modes, respectively. This phenomenon is related to the increase of the frictional resistance between the drill rods and the blasthole walls, the reduction of the available pressure over the hammer, the reduction of the flushing efficiency with depth and the bit wear (Schunnesson, 1998). The average value of the eight MWDc1 parameters at every 0.1 m
hole length has been calculated for the entire data from the 54 blasts
1
Ramp-up , Normal drilling
..--.---.
Ramp-up , Normal drilling 1..--.---.
f
~I~
1
i~~I)
11
1:1~1
150 1~:~1~
~
35,J:
1
30 1
1 1
r]~I
i
:~1\:J\;JI.
11.u. 58 ':"
~-¡:: 1
56 1
o
2 4o
2 4HL(m) HL(m)
Fig. 9. Drilling operation modes in MWD signa! from blasthole 71 at chainage 349. Units and acronyms meaning are given in Table 1; HL is hole length.
analyzed.
According to incidence reports, the sensors that monitor the posi-tion of boom 3 were out of calibraposi-tion in most of the rounds, and the blastholes drilled by this boom had a lower lookout and lookout di-rection angles than recorded by the MWD files. This resulted in a sys-tematic under-excavation in the contour profiles drilled by boom 3. The reports indicated a more intensive scaling on this side to meet the contour requirement. This results in a significant distortion of the ex-cavated profile, hence in the over-exex-cavated values calculated. Since the precise blasts for which boom 3 was out of calibration were not available, ali data from boom 3 has been discarded for the analysis.
The correction of the hole length influence (to obtain a signa! MWDc2 , see Fig. 7) is done by:
MWD~2 = [MWD~1-MWD~,,HL]
+
MWDfit,HL; with i = 1, 2, ···,N(6)
where i indicates each measurement in a hole log, N being the number of these. MWDfe,HL is a polynomial regression with hole length, of the average value at every 0.1 m hole length for the entire data of each MWDc1 parameter. MWD1fit;HL is the intercept of the fit, i.e. the value at
depth zero.
Fig. 10 shows the average MWDc1 signa! (blue lines), the polynomial
regression (MWDfit;HL, green lines) and the hole length normalized average signa! (MWDc2 , red lines), at every 0.1 m hole length for boom
l. The hole length normalization is not applied for the hammer pressure and for the water flow because there is no noticeable effect of depth in the average signa! (see Av.HPci;c2 and Av.WPci;c2 in Fig. 10).
N 721
~
~ 71.8
u.. 71.6
<(
>
71.4N 230
~
"
228ti)
ci:: 226
~
224---~---~--~~217.51
c..
217::e
>
<(
216.5 '---~---~--~~1-~_-
~-f::..-v-'<_,.~_\.\
_ _
~:1~
o
2 4 HL(m)Fig. 10. Correction of hole length influence in MWD parameters (pass from
MWDc1 to MWDcz, see Fig. 7); blue lines: average signals, MWDci (obtained
after filtering unrealistic values and removing ramp-up section, see Fig. 7); green lines: polynomial regression; red lines: average normalized signals,
MWDcz. Units and acronyms of the parameters in the ordinates are given in Table l. (For interpretation of the references to color in this figure legend, the reader is referred to the web version of this article.)
variables, and to select the more significant ones that are required for a sound rock mass characterization. They did a cross-correlation analysis between the signals of the eight parameters in order to find leadership behaviors. The results pointed to the feed pressure as the lead para-meter that drives the adjustment of the other variables to optimize the drilling. They showed that penetration rate, hammer pressure, damp pressure and rotation pressure are influenced by the feed pressure. According to this, the feed pressure generates systematic variations in these parameters that may hide the rock dependence on them. On the contrary, rotation speed, water flow and water pressure are little in-fluenced by the feed pressure, thus being considered independent.
The same methodology followed for the hole length influence is now used to correct the feed pressure influence. The average value of the seven MWDc2 parameters (feed pressure is not included) is calculated at
steps of 1 bar feed pressure value for the 54 blasts for boom l. Similar to Eq. (6), the correction of the feed pressure influence (to obtain a signa! MWDc3 , see Fig. 7) is done by:
MWD~3 = [MWD~2-MWD},,,FP]
+
MWDfit,FP; with i = 1, 2, ···,N (7) where i indicates each measurement in a hole log, N being the number of these. MWDfit;FP is a polynomial regression with the feed pressure, of the average value at every 1 bar feed pressure for the entire data of each MWDc2 parameter. MWD1fit;FP is the intercept of the fit, i.e. the value atthe minimum feed pressure.
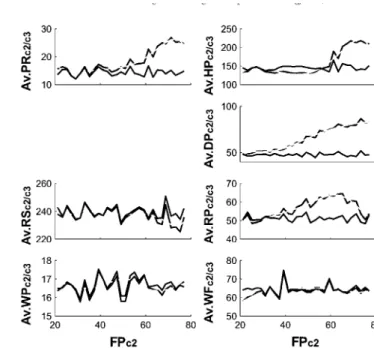
Fig. 11 shows the average MWDc2 signa! (blue lines), the polynomial
regression (MWDfit;FP, green lines) and the feed pressure corrected average signa! (MWDc3 , red lines), as function of the feed pressure. In
line with Navarro et al. (2018), it can be seen that penetration rate (PR), hammer pressure (HP), damp pressure (DP) and rotation pressure (RP) parameters have a strong dependence from the feed pressure (FP). For the case of rotation speed (RS), water pressure (WP) and water flow (WF), the influence of feed pressure is considerably less, and these data are not normalized for the subsequent analysis; Fig. 11 shows no large differences between MWDc2 and the resulting MWDc3 signals for these
parameters.
~ 200
tl.-...
M 2501~150-~
~ 100L_ _ _ _ _ _ _ _ _ _
~
1001 ,,.._(,)
~.~--D..
,,....r.J
0
50~
~
-::~
M 2601
~'"~
~ 220 ----~--~~--~ 70140----~--~---~
~
181~
801~<(::~ ~::~
20 40 60 80 20 40 60 80FPc2
FPc2
Fig. 11. Correction of the feed pressure influence in MWD parameters (MWDc2
conversion to MWDc3 , see Fig. 7); blue lines: average signals, MWDc2 (corrected
for hole length influence, see Fig. 7); green lines: polynomial regression; red lines: average normalized signals, MWDc3 . Units and acronyms of the
para-meters are given in Table 1. (For interpretation of the references to color in this figure legend, the reader is referred to the web version of this article.)
4.4. Analysis of fl.ucmations in the MWD signals
Schunnesson (1996, 1997) claimed that when discontinuities in rock are drilled, penetration rate and rotation pressure show significant fluctuation, resulting in a noisy signa!. Following this reasoning, para-meters involved in the rotational mechanism of the jumbo (rotation pressure and rotation speed) and the penetration rate have been pro-cessed. The procedure is carried out for the signa! of each hole in-dividually, where the MWDc3 values in a hole are divided by the
standard deviation of the entire signa! of that hole. The resulting signals for these three parameters are MWDc4 •
MWD;
MWD~
4
= d( c3 ) ; with i = 1, 2, · ··,Nst MWDc3 (8)
where i indicates each measurement in a hole log, N being the number of samples per signa!.
5. Detection of potential overbreak zones
The processed penetration rate (PRc4 ), hammer pressure (HP c3 ) and
rotation pressure (RP c4 ) result in rock dependent parameters. The
normalized rotation speed (RSc4 ) and water flow (WFc3 ) are
in-dependent parameters sensitive to rock variations (Navarro et al., 2018). The response of these normalized parameters can detect varia-tions in the rock and for equal blasting condivaria-tions they may explain variations in EMD data. The feed pressure is not considered as it has been used during the normalization.
a)
0.5 ,----~---~--~---~--~-~
I
e
:e
w
o
-0.5 '----~---~---~---'----~-_J
I
e
o
:e
w
o
2 3 4 5Hole length (m)
Lookout distance (m)
b)
- Hole6
~ 15
o::
10 2015
--~-~-~-~-~-~
2 3 4 5HL(m)
Hole 8 - Hole 11
.., 200
~ 180
:z::
160 140 2201
120'---~-~-~-~-~-100
..,
~ 80
e
60 40 1201'----~-~-~-~-~
""'"40
~ 30
o::
20 50110L_~-~-~-~-~
~
60 801
40L--~-~-~-~-~-0 2 3 4 5
HL(m)
Fig. 12. Preselection ofthe data for blastholes ofbooml at the chainage 591; (a) EMD vs. hole length and lookout distance; (b) MWD signals for blastholes 6, 7 and 11. See Table 1 for the acronyms of MWD parameters; subscripts c3 and c4 refer to the corrections shown in Fig. 7.
distance and depth is associated with an increase of the difficulty in breaking the rock, resulting then in a decrease of the over-excavated area, hence the EMD, which may be even negative (under-excavation). Therefore, the larger the lookout distance and the deeper the drilling, the more under-excavation is created in relation with the position of the contour blastholes. In sorne cases (data for holes 6, 8 and 11, Fig. 12a), the general trend is not followed. Fig. 12b shows the respective MWDc3
and MWDc4 logging for holes 6, 8 and 11. One may think that local rock
conditions may cause such results and that MWD parameters should show a peak or sorne kind of variation in the signa!. This is effectively observed for hole 6, where MWDc3-c4 parameters show a significant
peak or signa! fluctuation at depth 3--4 m, in line with the over-ex-cavation peak represented in graph a for this hole. However, no dis-tinctive variation appears in the MWDc3-c4 records of holes 8 and 11.
Hole 8 shows an over-excavated section at 2.5-3.5 m, whereas hole 11 indicates under-excavation at depth 1-2 m, though no significant changes can be observed in the MWD signa! of these two holes at any depth. Other causes like drill deviations, malfunctioning of blasting, scaling, etc. may be behind such EMD outlier profiles, uncorrelated with the MWD logs; these outliers, that happen at most in one or two holes per blast (many blasts do not show any) are removed from the analysis.
Table 2 shows the statistics for the MWDc3 and MWDc4 parameters,
the lookout distance, and the EMD values for boom l.
A power function of the MWD parameters to predict the EMD is considered:
(9)
where Lctist is the lookout distance.
Since EMD has positive and negative values, an additive constant A0
has been included. The normalized damp pressure and water pressure have been removed since their contributions were found minimal. The non-linear regression model has been programed with Matlab 2016b by a Levenberg-Marquardt non-linear ordinary least squares method (Matlab, 2016). The model coefficients are given in Table 3.
The determination coefficient ofthe fit R2 is 0.74. Coefficient values
Table 2
Statistic of the MWDc3 and MWDc4 parameters for boom l.
Parameter Units Mean Std." Min. Max.
Penetration ratec4 m/min 13.01 9.40 0.04 57.10
Hammer pressurec3 bar 211.81 15.04 63.00 230.0
Feed pressurec3 bar 73.94 5.71 21.20 79.89
Damp pressurec3 bar 65.31 12.76 48.23 86.63
Rotation speedc4 rpm 34.73 30.91 0.18 98.58
Rotation pressurec4 bar 26.55 12.99 0.09 128.05
Water flowc3 l/min 81.99 28.20 53.70 145.56
Water pressurec3 bar 16.43 4.87 13.57 21.84
Lookout m 0.27 0.15 0.02 0.94
EMD m o.25b 0.30 -0.63 1.09
ª Std. is standard deviation.
b Mean absolute Value.
estimated for each parameter are significantly different from zero, i.e. their p-value is < 0.0001 for ali cases, which means that the analysis is statistically significant. According to the value and sign of the coeffi-cients, the MWD parameters affect EMD differently:
- The normalized penetration rate (PRc4 ) and rotation pressure (RPc4 )
show negative correlation (negative sign in A1 and A4 ) with EMD.
According to Schunnesson (1996, 1997), high fluctuations in the PR and RP signals indicate soft/fractured rock. High tluctuations mean high standard deviation so that, according to Eq. (8), PRc4 and RPc4
show low values. This means that low PRc4 and RP c4 values indica te
soft/fractured rock, prone to suffer over-excavation. The contrary is also true.
- The normalized hammer pressure (HP c3 ) also shows a negative
correlation with EMD (negative sign in A2 ), which indicates that,
Table 3
Non-linear regression model coefficients.
Coefficient -2.8432
PRc4 A,
-0.0341
HPc3 A2
-0.1188
pressure; in open fissures, there is no resistance far the hammer to hit the rock which results in a reduction of its pressure to avoid damage in the system. In this way, low hammer pressures values are related with over-excavated areas and vice versa.
- The normalized rotation speed (RSc4 ) shows positive correlation
with EMD (positive sign in A3 ). Schunnesson (1998) claimed that at
high feed pressure, the rotation pressure required far the rotation of the bit increases and sometimes a reduction in the rotation speed can be appreciated. The higher resistance to rotate may also trans-late into an increase in the signa! fluctuation. According to Eq. (8), the higher the standard deviation of the RS parameter, the lower the RSc4 and the lower the excavated area is created, hence the positive
sign of its exponent in Eq. (9). For the case of discontinuities, Hustrulid (1968) showed that at low feed pressure, the bit will not be in constant contact with the bottom of the hole, resulting in a free rotation of the bit that may show a lower fluctuation in the rotation speed. This way, the lower the standard deviation of the RS para-meter, the higher the RSc4 and the greater the excavated area.
- The normalized water flow (WFc3 ) has a positive correlation with
EMD (positive sign in A5 ). This can be explained by the fact that,
when discontinuities or soft rock is drilled, the control system re-quires a higher water flow due to the higher amount of drill cuttings or the water leakage to the discontinuities.
- The lookout distance presents a negative correlation with EMD, which means, as discussed befare, that the excavated area in rela-tion with the blasthole posirela-tion decreases with an increase of depth and lookout.
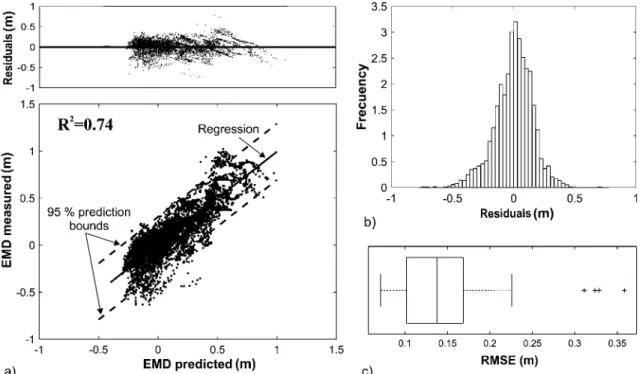
The results of the EMD predicted with the suggested model versus the EMD data are plotted in Fig. 13a. The linear regression obtained has a slope of one with a zero-constant term. Fig. 13a also shows the upper
0.0352 -0.0108
WFc3 As
0.0834 -0.0600
and lower prediction band at a 95% confidence leve!. The residuals are normally distributed (see Fig. 13b).
Fig. 13c shows the distribution of the root mean square error (RMSE) far each of the 54 blasts. The median and the 25th and 75th percentiles of RMSE are 0.142m, 0.102m and 0.186m, respectively. An illustration of the application of the model is shown in Fig. 14 far three blasts, representing the 75% (large error, Fig. 14a), 50% (ex-pected error, Fig. 14b) and 25% (small error, Fig. 14c) of the RMSE values; they correspond to blasts located at the chainages 388, 500 and 591, respectively. In the three cases, the EMD predicted is compared with the EMD measured far blastholes of boom l. Five different over-excavation ranges have been defined. For high RMSE values (Fig. 14a), visual differences between the predicted EMD and the EMD measured are apparent; these are considerably reduced when representing medium and low RMSE values (Fig. 14b and c). Fig. 14c shows a pre-dicted EMD generally in line with the EMD measured though still sorne light differences exist. Considering the noise of the MWD data - un-avoidable in the harsh conditions where such data are measured - and the additional uncertainty brought by drilling deviations, the scaling and primary support done befare scanning the excavated section, sen-sors potentially out of calibration, possible variations in the explosive linear density, etc., the quality of the fit is outstanding.
6. Conclusions
The overbreak of the remaining rock mass in tunnel blasting has been analyzed in the light of MWD records, with the purpose of de-veloping a prediction model of over- and under-excavation depths from blasting. Such predictive model may also be seen as a drill or rock index that could be used to identify zones of potentially high geotechnical risk (those far which the over-excavation prediction is high). By comparison
3.5 ~---~---~----~---~
3
2.5 >.
u
f
_:~f
·-b:,,--1 ~---~ ; 2
1.5 ~---~---~---~---~---~
I
"C
Q)
....
::::¡ 0.5
,,,
m Q)E
e
o
:!!:w
-0.5
-1 ~---~----~---~----~---~
-1 -0.5
o
0.5 1.5a) EMD predicted (m)
::::¡
e
1.5L1.
-0.5
o
0.5b)
Residuals (m)1
lm[l]m
1 • ••* •·
I0.1 0.15
e)
0.2 0.25
RMSE (m)
0.3 0.35
EMD measured
RMSE = 0.19
m
EMD predicted
13 13
12 12
11 11
- 1 0
.s
- 1 0.s
:;; 9
1-z
>-
8- ----E)
·.
:;; 9
1-z
>-
87
-
---""'"€>
._,
76
5
<>
---a..~
o
65
o
394 394 392
390
a)
386Chainage
(m)EMD measured
RMSE = 0.14
m
EMD predicted
13
12
_11
.s
10 :;;1- 9
z
>-8
7
6
5 508
506
b)
13
~'
12
11
~~~
....
I10
:;;
~,,.
'
1- 9 ~~ ~ z
~
>-
8 ~~
7 ~
...
~r~
6
5
..
'
508
-2 506 ~
504 -2
C¡,a¡ 502 2
11a9e 500
1'
\fO)
(1¡¡) 498 6
EMD measured
RMSE
= 0.10
m
EMD predicted
9
···':~
8
-~
'
7
<~ ~
'
~
I
6..
...
(~~
"""'v
:;; 5
-..;;
1-~ 'El
z
>-
4e...v
""'€> 3
-::::
2
1
·-
~
596 (~
594
o
9
8
'
r;~ (~
7
I
6·~
~
~~~
:;; 5
1-z
~~
>-
43
~
-:::
2 ~
--
~1 ~(
~
-2 596
~
-2594
o
592 2
Cha¡11a 590 4
~
''"""
e)
9e
(tn) 588 6592 2
Cha¡11a 590 4
~
''"""
9e
(tn) 588 6EMD < -0.3 e-0.3 < EMD < -0.15
-0.15 < EMD < 0.15
e
0.15 < EMD < 0.3
e
0.3 < EMD
O
Collaring -
Blasthole
Fig. 14. Representation of the predicted EMD model (right graph) and the EMD measured (left graph) for blastholes of the boom 1: (a) blast in chainage 388, 75th percentile of the RMSE; (b) blast in chainage 500, median value of the RMSE; (e) blast in chainage 591, 25th percentile of the RMSE.
of scanner profiles of the excavated sections with the blasthole posi-tions, a methodology has been developed to obtain an Excavated Mean Distance (EMD) between the blasthole and the excavated profile, which
explosive linear density, etc., are assumed to be of random nature, unavoidable in the harsh condition in which such data are measured. Quantitative predictions for different conditions would require a re-calibration of the model for the new site, following the methodology described here.
Given that blasting factors are constant (as from blast reports) the overbreak and underbreak are considered mainly influenced by the geotechnical condition of the rock mass. Such rock mass properties are assessed from MWD parameters that show the response of the jumbo to the rock before blasting. A thorough transformation of the MWD logs has been carried out to filter out systematic variations due to the nature of the drilling process and to highlight the dependence of the rock in the parameters. This transformation includes: (i) filtering out of unrealistic data, (ii) removal of the ramp-up section of the logs, (iii) normalization of systematic variations in the MWD parameters so that the influence of hole length and feed pressure are corrected and (iv) normalization with the standard deviation to account for fluctuations in the signals.
A non-linear power-form model has been developed that predicts the excavated mean distance as function of the normalized penetration rate, hammer pressure, rotation speed, rotation pressure and water flow parameters, and the lookout distance. They combine the rotational, hydraulic and percussive mechanisms of the drill, and the confinement of the rock mass by depth. The model has a determination coefficient of 0.74, with the coefficients of the model strongly significant. Residuals are essentially normally distributed. The signs of the exponents indica te that normalized penetration rate, hammer pressure, rotation pressure and the lookout distance inversely influence the excavated distance i.e. high values for them reflect hard, unaltered rock. On the other hand, normalized rotation speed and water flow are directly correlated with the excavated distance, so that high values for them indicate soft, fractured rock.
Acknowledgements
This work has been conducted under the project "TUÑEL" (PCD16264900008) funded by the Centre for Industrial Technological Development (CDTI, Government of Spain). The authors would like to thank OSSA Obras Subterráneas SA, for providing the necessary data. The support of MAXAM Civil Explosives is also acknowledged. Special thanks are due to Prof. Hakan Schunnesson of Lulea University of Technology, for his guidance in the MWD normalization analysis. We would also like to thank the anonymous reviewers for their valuable suggestions regarding the analyses and the discussion of the results.
Appendix A. Supplementary material
Supplementary data associated with this article can be found, in the online version, at https://doi.org/10.1016/j.tust.2018.08.060.
References
Andersson, P., 1994. The damage zone at tunnel driving, seminar Oct. 1992, SveBeFo report 8. Swedish Rock Engineering Research, Stockholm.
AutoCAD, 2017. Autodesk, !ne.
Barton, N., Lien, R., Lunde, J., 1974. Engineering classification of rock masses for the design of tunnel support. Rock Mech. 6 ( 4), 189-236.
Beattie, N.C.M., 2009. Monitoring-while-drilling for oppit mining in a hard rock en-vironment: an investigation of pattern recognition techniques applied to rock iden-tification. Doctoral Thesis. Dept. of Mining Engineering, Queen1s University,
Kingston, Canada.
Costamagna, E., Oggeri, C., Castedo, R., Segarra, P., Navarro, J., 2018. Assessment of contour profile quality in D&B tunneling. Tunn. Undergr. Space Technol. 75, 67-80. Cunningham, C.V.B., Goetzsche, A.F., 1990. The specifications of blast damage
limita-tions in tunnelling contracts. Tunn. Undergr. Space Technol 5, 193-198. Deere, D.U., Miller, R.P., 1966. Engineering Classification and Index Properties for Intact
Rock. Illinois University at Urbana, Department of Civil Engineering. Fritsch, F.N., Carlson, R.E., 1980. Monotone piecewise cubic interpolation. SIAM J.
Numer. Anal. 17, 238-246.
Ghosh, R., Schunnesson, H., Kumar, U., 2015. The use of specific energy in rotary drilling: The effect of operational parameters. In: International Symposium on the Application
of Computers and Operations Research in the Mineral Industry: 23/05/2015-27 /05/ 2015.
Ghosh, R., 2017. Assessment of rock mass quality and its effects on charge ability using drill monitoring technique. Doctoral dissertation. Lulecl Tekniska Universitet. Hatherly, P., Leung, R., Scheding, S., Robinson, D., 2015. Dril! monitoring results revea!
geological conditions in blasthole drilling. Int. J. Rock Mech. Min. Sci. 78, 144-154. Hjelme, J.G., 2010. Dril! parameter analysis in the Loren tunnel. M.Sc. thesis in
Geosciences. University of Oslo, Department of Geosciences.
Hoek, E., Carranza-Torres, C.T., Corkum, B., 2002. Hoek-Brown failure criterion - 2002 edition. In: Proceedings of the Fifth North American Rock Mechanics Symposium, Toronto, Canada, vol. 1, pp. 267-273.
Hoek, E., 2012. Blast Damage Factor D. Technical note for RocNews, February. Hu, Y., Lu, W., Chen, M., Yan, P., Yang, J., 2014. Comparison of blast-induced damage
between presplit and smooth blasting of high rock slope. Rock Mech. Rock Eng. 47 (1), 1307-1320.
Hustrulid, W.A., 1968. Theoretical and experimental study of percussive drilling of rock. Doctoral Thesis. University of Minnesota.
Hustrulid, W., 2010. Sorne comments regarding development drifting practices with special emphasis on caving applications. Min. Technol. 119 (3), 113-131. !barra, J.A., Maerz, N.H., Franklin, J.A., 1996. Overbreak and underbreak in underground
openings part 2: causes and implications. Geotech. Geol. Eng. 14 (4), 325-340. Johnson, J.C., 2010. The Hustrulid bar- a dynamic strength test and its application to the
cautious blasting of rock. Doctoral Thesis. Department of Mining Engineering, University of Utah.
Kahraman, S., Rostami, J., Naeimipour, A., 2016. Review of ground characterization by using instrumented drills for underground mining and construction. Rock Mech. Rock Eng. 49 (2), 585-602.
Kim, Y., Bruland, A., 2009. Effects of drilling and geological parameters on contour quality in a dril! and blast tunnel. Tunn. Undergr. Space Technol. 24 (5), 584-591. Kim, Y., Bruland, A., 2015. A study on the establishment ofTunnel Contour Quality Index
considering construction cost. Tunn. Undergr. Space Technol. 50, 218-225. Kwon, S., Lee, C.S., Cho, S.J., Jeon, S.W., Cho, W.J., 2009. An investigation of the
ex-cavation damaged zone at the KAERI underground research tunnel. Tunn. Undergr. Space Technol. 24 (1), 1-13.
Leung, R., Scheding, S., 2015. Automated coa! seam detection using a modulated specific energy measure in a monitor-while-drilling context. Int. J. Rock Mech. Min. Sci. 75, 196-209.
Liu, H., Yin, K. Karen, 2001. Analysis and interpretation of monitored rotary blasthole dril! data. Int. J. Surf. Min. Reclam. Environ. 15, 177-203.
Mahdevari, S., Haghighat, H.S., Torabi, S.R., 2013. A dynamically approach based on SVM algorithm for prediction of tunnel convergence during excavation. Tunn. Undergr. Space Technol. 38, 59-68.
Mahtab, M.A., Rossler, K., Kalamaras, G.S., Grasso, P., 1997. Assessment of geological overbreak for tunnel design and contractual claims. Int. J. Rock Mech. Min. Sci. 34 (3-4), 185-el.
Manda!, S.K., Singh, M.M., 2009. Evaluating extent and causes of overbreak in tunnels. Tunn. Undergr. Space Technol. 24 (1), 22-36.
Matlab, 2017. The MathWorks !ne., Natick, MA.
Naeimipour, A., Bahrampour, S., Rostami, J., Dogruoz, C., 2014. Ground characterization while drilling roofbolters. In: Proceedings of North American Tunneling Conference, 22-25 June, Los Angeles, CA, 11, pp. 51-59.
Navarro, J., Sanchidrián, J.A., Segarra, P., Castedo, R., López, L.M., Cienfuegos, R., 2017. MWD parameters and Drilling Control system. In: Proceedings World Tunnel Congress 2017, 9-15 June 2017, Bergen, Norway, pp. 194-203.
Navarro, J., Sanchidrián, J.A., Segarra, P., Castedo, R., Paredes, C., López, L.M., 2018. On the mutual relations of drill monitoring variables and the drill control system in tunneling operations. Tunn. Undergr. Space Technol. 72, 294-304.
NPRA - Norwegian Public Road Administration, 2004. Road Tunnel. Manual 021. ISBN 82-7207-540-7.
Oggeri, C., Ova, G., 2004. Quality on tunneling: ITA-AITES Working Group 16 final re-port. Tunn. Undergr. Space Technol. 19, 239-272.
Olsson, M., 2010. Tunnel blast design for minimizing of the damage zone. A guidance document for SKB and Posiva. Swebrec Report 2010-4, Stockholm, Sweden. Ouchterlony, F., Olsson, M., Bergqvist, l., 2002. Towards new Swedish recommendations
for cautious perimeter blasting. Fragblast 6 (2), 235-261.
Peng, S.S., Tang, D., Sasaoka, T., Luo, Y., Finfinger, G., Wilson, G., 2005. A method for quantitative void/fracture detection and estimation of rock strength for underground mine roof. In: Proceedings 24th International Conference on Ground Control in Mining, 2-4 August, Lakeview, WV, pp. 187-195.
Schunnesson, H., 1996. RQD predictions based on dril! performance parameters. Tunn. Undergr. Space Technol. 11, 345-351.
Schunnesson, H., 1997. Drill process monitoring in percussive drilling for location of structural features, lithological boundaries and rock properties, and for dril! pro-ductivity evaluation. Doctoral Thesis. Dept. of Environmental Planning and Design, Division of Applied Geology, Lulea University of Technology, Lulea.
Schunnesson, H., 1998. Rock characterization using percussive drilling. Int. J. Rock Mech. Min. Sci. 35, 711-725.
Schunnesson, H., Kristoffersson, T., 2011. Rock mass characterization using drill and crushability monitoring-A case study. Int. J. COMADEM. 14 (2), 44-52. Schunnesson, H., Elsrud, R., Rai, P., 2011. Drill monitoring for ground characterization in
tunnelling operations. In: 20th International Symposium on Mine Planning and Equipment Selection, 12-14 October, Almaty, Kazakhstan.
Schunnesson, H., 2017. Personal communication at Lulecl Techniska Universitet, Sweden.
Scoble, M.J., Peck, J., Hendricks, C., 1989. Correlation between rotary dril! performance parameters and borehole geophysical logging. Min. Sci. Technol. 8 (3), 301-312. Scoble, M.J., Lizotte, Y.C., Paventi, M., Mohanty, B.B., 1997. Measurement of blasting
damage. Mining Engineering, June 1997, pp. 103-108.
Singh, P.K., Roy, S.K., Sinha, A., 2003. A new blast damage index for the safety of un-derground coa! mine openings. Min. Technol. 112 (2), 97-104.
Singh, S.P., Xavier, P., 2005. Causes, impact and control of overbreak in underground excavations. Tunn. Undergr. Space Technol. 20, 63-71.
SN -Schweizer Norm, 2004. Conditions générales pour constructions souterraines. SIA -Société suisse des ingénieurs et des architectes, Zurich.
Tang, X., 2006. Development of real time roof geology detection system using drilling
parameters during roof bolting operation. Doctoral Thesis. Department of Mining
Engineering, University of West Virginia.
Teale, R., 1965. The concept of specific energy in rock drilling. Int. J. Rock Mech. Min. Sci. 2, 57-73.
Van Eldert, J., Schunnesson, H., Johansson, D., Saiang, D., 2018. Measurement While Drilling (MWD) technology for blasting damage calculation. In: Proceedings 12th International Symposium on Rock Fragmentation by Blasting, 11-13 June 2018, Lulea, Sweden, pp. 139-148.
Xu, D.P., Feng, X.T., Chen, D.F., Zhang, C.Q., Fan, Q.X., 2017. Constitutive representation
and damage degree index for the layered rock mass excavation response in
under-ground openings. Tunn. Undergr. Space Technol. 64, 133-145.