Search theory and unemployment
21
0
0
Texto completo
(2) DOCUMENTOS DE TRABAJO. Pontificia Universidad Católica Argentina “Santa María de los Buenos Aires”. Search Theory and Unemployment Por Francisco J. Ciocchini. Facultad de Ciencias Sociales y Económicas Departamento de Economía Documento de Trabajo Nº 6. Junio de 2006.
(3)
(4) Search Theory and Unemployment Francisco J. Ciocchini Department of Economics Universidad Católica Argentina. Abstract We study a simple search model of the labor market and use it to shed light on issues like unemployment duration, the determinants of the unemployment rate, and the potential effects of education on these two variables.. Resumen En este artículo se estudia un modelo simple de búsqueda en el mercado de trabajo. Los resultados del modelo permiten echar algo de luz sobre temas tales como la duración del desempleo, los determinantes de la tasa de desempleo y los posibles efectos de la educación sobre estas variables..
(5) 1. Introduction. In this paper we use search theory to analyze some features of the labor market, like unemployment duration, the determinants of the unemployment rate, and the impact of education on these variables. The importance of understanding these phenomena does not need too much explanation. What does deserve some explanation is why we will try to understand them by using search theory instead of the traditional Walrasian setup. We …nd no better way to do this than quoting at length from Lucas (1987): Think, to begin with, about the Walrasian market for a vector of commodities, including as one component ‘hours of labor services’, that must be at the center of a competitive equilibrium model. In this scenario, households and …rms submit supply and demand orders for labor services and other goods at various auctioneerdetermined price vectors and, when the market-clearing price vector is found, trading is consummated at those prices. Each seller of labor sells as much or as little as he pleases at these prices, each is indi¤erent to the identity of the buyer(s) of the labor services he sells, and if this spot market is repeated at later dates, there is no reason to expect any continuity in the relationship between particular buyers and particular sellers. There is no sense in which anyone in this scenario can be said to ‘have a job’ or to lose, seek or …nd a job. It seems clear enough that a model in which wages and hours of employment are set in this way can, at best, shed light on the determination of these two variables. Whatever success it may enjoy on these dimensions, it can tell us nothing about the list of labor market phenomena that have to do with sustained employer-employee relationships: their formation, their nature, their dissolution. [...] [S]uch a model clearly will not provide a useful account of observations on quits, …res, lay-o¤s and other phenomena that explicitly refer to aspects of the employer-employee relationship. [...] A theory that does deal succesfully with unemployment needs to address two quite distinct problems. One is the fact that job separations tend to take the form of unilateral decisions - a worker quits, or is laid o¤ or …red - in which negotiations over wage rates play no explicit role. The second is that workers who lose jobs, for whatever reason, typically pass through a period of unemployment instead of taking temporary work on the ‘spot’ labor market jobs that are readily available in any economy. Of these, the second seems to me much the more important: it does not ‘explain’ why someone is unemployed to explain why he does not have a job with company X. After all, most employed people do not have jobs with company X either. To explain why people allocate time to a particular activity -. 1.
(6) like unemployment - we need to know why they prefer it to all other available activities... [...] An analysis of unemployment as an activity was initiated by John McCall in a paper that integrated Stigler’s ideas on the economics of search with the sequential analysis of Wald and Bellman.[1 ] McCall’s contribution is well-known and justly celebrated, but I would like to celebrate it a little more, so I need to set out some details. We set out those details in Section 2, and show that the optimal behavior of an unemployed worker is a reservation-wage policy. In Section 3 we derive the expected duration of employment and unemployment spells. In Section 4 we obtain the steady-state unemployment rate. In Section 5 we carry out some interesting comparative statics exercises that are then used in Section 6 to inquiry about the relation between education and unemployment. In Section 7 we show how the theoretical model can be readily mapped into an econometric model. In Section 8 we o¤er some concluding remarks.. 2. A Simple Sequential Search Model. Consider an ini…nite-horizon continuos-time model where individuals occupy, at each instant, one of two states, employment (e) or unemployment (u). An unemployed individual receives employment o¤ers at rate ¸ per unit-time interval, independent of the elapsed duration of the unemployment spell.2 Each employment o¤er i 2 f1; :::; ng comes with an attached wage o¤er, wi 2 [0; w], so “employment o¤ers” and “wage o¤ers” are interchangeable expressions. Wage o¤ers are realizations of independent random variables Wi with the same cumulative distribution function F .3 This distribution is known by the worker, and constant over time. After receiving n o¤ers the individual has to decide whether to reject them or to accept one.4 If he accepts an o¤er, he will choose the one with the highest wage, w = maxfw1 ; :::; wn g. While employed, layo¤s arrive at 1 See. McCall (1970). precisely, employment o¤ers follow a time-homogeneous Poisson process with parameter ¸. Hence, the probability of receiving n o¤ers during time-interval h is q(n; h) = (¸h)n ¡¸h e . It follows that the probability of receiving no o¤ers during h is q(0; h) = e¡¸h , n! the probability of receiving one o¤er is q(1; h) = ¸he¡¸h , and the probability of receiving more than one o¤er is q(n ¸ 2; h) = 1 ¡ (1 + ¸h)e¡¸h . Applying Mac Laurin’s formula to e¡¸h we can rewrite these probabilities as follows: q(0; h) = 1 ¡ ¸h + o0 (h), q(1; h) = ¸h + o1 (h), o (h) = 0, i 2 f0; 1; 2g. Notice and q(n ¸ 2; h) = o2 (h), where oi (¢) satis…es limh!0 ih q(1;h) q(n¸2;h) = ¸ and limh!0 = 0. Therefore, for small h, q(1; h) » that, limh!0 h = ¸h, h q(0; h) » = 1 ¡ ¸h, and q(n ¸ 2; h) » = 0. Essentially, during a su¢ciently short time-interval, at most one o¤er is received. It is not di¢cult to show that the expected number of o¤ers received during time-interval h is ¸h. Therefore, the expected number of o¤ers per unit-time interval is ¸. This makes clear why ¸ is called the rate of the process. 3 That is, F (w) ´ PrfW · wg. i 4 The individual cannot decide to accept an o¤er that was previously rejected. 2 More. 2.
(7) rate ® per unit-time interval, independent of tenure.5 If the individual rejects the o¤ers he remains unemployed and obtains an instantaneous net income b¡c, until an o¤er is accepted. The parameter b measures the value of time spent as leisure (assumed constant over time).6 The value of time and out of pocket costs spent searching for a job are captured by c. The objective ofRthe individual 1 is to maximize the expected discounted lifetime income, U = E 0 e¡½t y(t)dt, where E is the expectations operator (conditional on information available at time zero), ½ > 0 is the discount rate, and y(t) is income at instant t (i.e., y(t) = w if employed at wage w at t, and y(t) = b ¡ c if unemployed at t). We start with a discrete-time version of the model in which the length of a period is h. The continuous-time version will result as we take the limit for h converging to zero. Since the problem is recursive, we can apply Bellman’s principle of optimality. “Stated in words, the principle asserts that the present decision in a sequence of decisions maximizes current net return plus the expected future stream of returns, appropriately discounted, under the presumption that decisions in the future are made optimally where the expectation taken is conditional on current information. In short, a multi-stage decision problem is converted by the principle into a sequence of single-stage decision problems” (Mortensen (1986)). Let Ve (w; t; h) denote the value of being employed at time t, the beginning of the period that goes from t to t + h, earning wage w. Ve (w; t; h) is the expected value of discounted net income from the present moment onward, for a worker who is employed at t, given that he will behave optimally in the future conditional on current information. Analogously, let Vu (t; h) be the value of unemployment.7 Consider the situation of an individual who behaves optimally and is employed at t. At each instant between t and t + h he earns w. Therefore, total income during the current period is wh. In this period, the worker learns whether he will be …red at t + h. At time t, the probability that the layo¤ occurs between t and t + h is ®he¡®h . If the worker is …red, he obtains Vu (t + h; h) (properly discounted). If he keeps the job, he gets Ve (w; t + h; h) (properly discounted). Putting all these together we get: £ ¤ Ve (w; t; h) = wh + e¡½h ®he¡®h Vu (t + h; h) + (1 ¡ ®he¡®h )Ve (w; t + h; h) : (1) Given the assumptions that b¡c and w are constant, that the future sequence of best o¤ers is i.i.d. and the distribution F is constant over time, the problem is stationary. Therefore, Ve (w; t; h) = Ve (w; h) and Vu (t; h) = Vu (h) for all t. Substituting these into (1), rearranging conveniently, dividing by h, and letting h go to zero, we get: 5 More. precisely, during time-interval h, the worker is …red with probability p(h) = ®he¡®h , p(h) and remains employed with probability 1 ¡ p(h) = 1 ¡ ®he¡®h . Notice that limh!0 h = ®. ®h. It follows that, for small h, p(h) » = 6 In some applications, b can be interpreted to include unemployment insurance compensation. 7 Since b ¡ c is constant over time, we do not include it as an argument of V (¢). u. 3.
(8) Ve (w) =. ® w + Vu ; ½+® ½+®. (2). where we have set Ve (w) ´ Ve (w; 0) and Vu ´ Vu (0).8 Equation (2) can be rewritten as follows: ½Ve (w) = w + ®[Vu ¡ Ve (w)]:. (3). This expression has an intuitive asset-pricing interpretation. Consider a riskneutral investor with required rate of return ½, who has acces to a risky asset that pays dividends at rate w per unit time when the worker is employed and b¡c per unit time when the worker is unemployed. Since the expected present value of lifetime dividends of this asset (including the current dividend) is the same as the worker’s expected discounted value of lifetime income, the asset’s price (including the current dividend) must be Ve (w) when the worker is employed and Vu when the worker is unemployed. The (net) rate of return of this asset equals the dividend rate plus any expected capital gain or loss, all divided by the price of the asset. When the worker is employed, the dividend rate is w and the expected capital gain/loss is ®[Vu ¡ Ve (w)]. The latter holds because there is a probability ® that the worker will be …red, which triggers a change in the price of the asset from Ve (w) to Vu (with probability 1 ¡ ® the worker keeps the job and the price of the asset remains at Ve (w)). It follows that the e (w)] rate of return of the risky asset is w+®[VuV¡V . To be willingly held by a riske neutral investor, this return must equal the required (risk-free) rate of return ½. e (w)] Therefore ½ = w+®[VuV¡V , which is equivalent to (3). e Imagine now the situation of an individual who behaves optimally and is unemployed at t. At each instant between t and t + h he gets b ¡ c. Therefore, total income during the current period is (b ¡ c)h. In this period, the individual receives o¤ers to start working at t + h. Both the number of o¤ers and the wage attached to an o¤er are unknown at t. With probability q(0; h) = e¡¸h he receives no o¤ers and remains unemployed, obtaining Vu (h).9 With probability n ¡¸h q(n; h) = (¸h)n!e he receives n 2 f1; 2; :::g o¤ers and has to decide whether to reject them or accept (the best) one. The individual rejects a known set of o¤ers whenever the value of being unemployed is higher than the value of becoming employed, and accepts the best o¤er otherwise. Since the wage at which the individual can start working at t + h is unknown at t, the value of this option is E maxfVe (Xn ; h); Vu (h)g, where the expectation runs over Xn ´ maxfW1 ; :::; Wn g.10 Putting all these together, and discounting properly, we 8 V (w; h) and V (h) are continuos, so lim e u h!0 Ve (w; h) = Ve (w; 0) and limh!0 Vu (h) = Vu (0). 9 We are already imposing sationarity, so we write V (h) instead of V (t + h; h). u u 10 Let G(w; n) be the probability that the best of n o¤ers is (weakly) smaller than w. Since wage o¤ers are independent realizations from F , we get: G(w; n) = PrfXn · wg = PrfmaxfW1 ; :::; Wn g · wg = PrfW1 · w; :::; Wn · wg = PrfW1 · wg::: PrfWn · wg = [F (w)]n .. 4.
(9) get: ". Vu (h) = (b ¡ c)h + e¡½h e¡¸h Vu (h) +. 1 X (¸h)n e¡¸h. n=1. n!. #. E maxfVe (Xn ; h); Vu (h)g. (4). Rearranging (4) conveniently, dividing by h, and letting h go to zero, we get: Vu =. ¸ b¡c + E maxfVe (W ); Vu g; ½+¸ ½+¸. (5). where we have set Vu (0) ´ Vu , Ve (W; 0) ´ Ve (W ), and the expectation runs over W ´ X1 .11 Equation (5) can be rewritten as follows: ½Vu = (b ¡ c) + ¸E maxfVe (W ) ¡ Vu ; 0g:. (6). Like (3), equation (6) has an asset-pricing interpretation. When the worker is unemployed, the dividend rate is b ¡ c. In addition, there is a probability ¸ that the unemployed worker will receive a wage o¤er w. If he accepts the o¤er, the price of the asset changes from Vu to Ve (w). If he rejects the o¤er, the price of the asset remains at Vu . Therefore, the expected capital gain is ¸E maxfVe (W ) ¡ Vu ; 0g. It follows that the (net) rate of ree (W )¡Vu ;0g . To be willingly held by a riskturn of the asset is (b¡c)+¸E maxfV Vu neutral investor, this return must equal the required (risk-free) rate ½. Therefore e (W )¡Vu ;0g ½ = (b¡c)+¸E maxfV , which is equivalent to (6). Vu De…ne, ! ´ ½Vu :. (7). Using (2) and (7) we obtain Ve (w) ¡ Vu = w¡! ½+® . Therefore, Ve (w) > Vu if and only if w > !. Hence, an unemployed worker will accept a job o¤er if and only if its associated wage w is higher than !. Because of this property, ! is called the reservation wage. Notice that, in this version of the model, the reservation wage is independent of the elapsed duration of the unemployment spell. Substituting (7) and Ve (w) ¡ Vu = w¡! ½+® into (6) we get: ! ¡ (b ¡ c) =. ¸ E maxfW ¡ !; 0g: ½+®. (8). Equation (6), which determines the value of !, can be rewritten as follows:12 Z w ¸ ! ¡ (b ¡ c) = (w ¡ !)dF (w): (9) ½+® ! 11 Recall. that, when h is small, the probability of receiving more than one o¤er vanishes. R R R use: E maxfW ¡ !; 0g = 0w maxfw ¡ !; 0gdF (w) = 0! 0dF (w) + !w (w ¡ !)dF (w) = Rw ! (w ¡ !)dF (w). 12 We. 5.
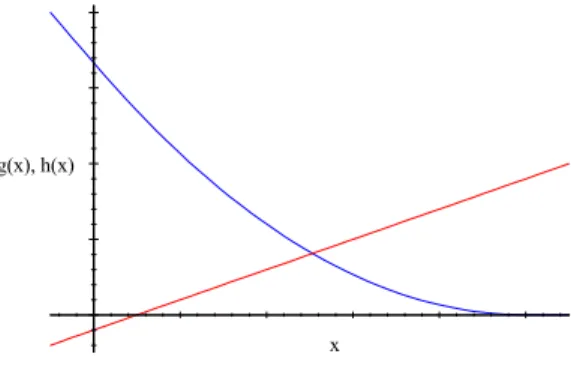
(10) The left-hand side of (9) is the marginal cost of search when the wage o¤er equals !. It is the di¤erence between what the worker would get by accepting the o¤er and what he would get by rejecting and remaining unemployed. The right-hand side is the (expected) marginal gain from search when the wage o¤er equals !. It is the expected gain of …nding an acceptable o¤er next instant, properly discounted by taking account of the frequency with which o¤ers arrive and the possibility that the worker is …red after accepting the job. We can represent the determination of w graphically. De…ne the functions Rw ¸ (w ¡ x)dF (w). Figure 1 displays these g(x) = x ¡ (b ¡ c) and h(x) = ½+® x 13 two functions. The reservation wage is the value of x at which both functions cross.. Figure 1. Determ ination of the reservation wage. g(x), h(x). x. There is nothing in Figure 1 that prevents ! from being smaller than b. This gives the idea that an individual could accept a job that pays less than what he would earn by not participating in the labor market.14 This is inconsistent with a worker’s rational participation/non-participation decision. For a rational worker to be part of the labor force as an unemployed searching worker, the value of unemployment must be at least as large as the present value of nonparticipation: Vu > ½b . Therefore: ½Vu > b. Since ! ´ ½Vu , we conclude that the worker’s participation requires ! > b. And (9) implies: ! > b , Rw ¸ ½+® b (w ¡b)dF (w) > c. That is, a rational worker participates as unemployed (! > b) if and only if the marginal return to search when the reservation wage is equal to the value of leisure is higher than the out-of-pocket cost of search. From now on, we assume this condition holds. For future reference, we note that (9) can be rewritten as follows:15 13 It. h00 (x). is not di¢cult to show that h(0) =. ¸EfW g , ½+®. 0. ¸F (x) . ½+®. h(w) = 0, h0 (x) = ¡. = refusing to participate the worker obtains b without paying the cost c. R 15 Integrate w (w ¡ !)dF (w) by parts, using u = w ¡ ! and v = F (w). ! 14 By. 6. ¸[1¡F (x)] , ½+®. and.
(11) ¸ ! ¡ (b ¡ c) = ½+®. Z. w. !. [1 ¡ F (w)]dw:. (10). It is clear from either (9) or (10) that the value of ! will depend on the distribution function F and on the values taken by b ¡ c, ¸, ½, and ®. A nice feature of the model is that we can do comparative statics very easily. Before doing it, however, it will be convenient to analize the determinants of the expected duration of employment and unemployment spells, and of the steady-state unemployment rate.. 3. Expected Duration of Employment and Unemployment Spells. Let Tu denote the (random) duration of completed unemployment spells, and let Du denote its cumulative distribution function (i.e., Du (t) = PrfTu · tg). Consider the following question: Given that the unemployment spell has already lasted t units of time, what is the probability that it will end in the next short interval h? In other words, what is the value of PrfTu 2 [t; t + h]jTu ¸ tg?16 It is standard in the literature to characterize this aspect of the distribution u ¸tg = Sduu(t) using the hazard function, µu (t) ´ limh!0 PrfTu 2[t;t+h]jT h (t) , where du (t) ´ Du0 (t) is the density function and Su (t) ´ 1 ¡ Du (t) = PrfTu > tg is the so-called survival function.17 Thus, the hazard function evaluated at t gives the rate at which unemployment spells are terminated after duration t, given that they have already lasted until t. For the model developed in the previous section, the rate at which a worker escapes unemployment equals the rate at which employment o¤ers arrive multiplied by the probability that an o¤er is accepted. Since o¤ers arrive at rate ¸ and the probability of acceptance is 1 ¡ F (!), we get: µu = ¸[1 ¡ F (!)]:. (11). Because the reservation wage is stationary, the hazard rate is independent of the elapsed duration of the unemploymen spell. This implies that the distribution 16 Using. the law of conditional probabilities we get PrfTu 2 [t; t + h]jTu ¸ tg =. Du (t+h)¡Du (t) . 1¡Du (t) 17 The terms hazard. and survival come from biostatistics, where it is standard to ask for the probability that an individual dies during interval [t; t + h] given that it has already survived up to t. When talking about unemployment spells, these terms ara a bit counterintuitive because a higher probability of survival means a higher probability of remaining unemployed.. 7.
(12) of completed unemployment spells is exponential with parameter µu :18 du (t) = µu e¡µu t ;. (12). Su (t) = e¡µu t :. (13). With the distribution of completed unemployment spells at hand we can calculate their expected duration. We obtain:19. EfTu g =. 1 : µu. (14). We can repeat the calculations for employment spells. Letting Te denote the duration of completed employment spells, and using analogous notation, we obtain: µe = ®;. (15). de (t) = ®e¡®t ;. (16). Se (t) = e¡®t ;. (17). 1 : ®. (18). and. EfTe g =. 4. Unemployment Rate. Consider an economy populated by a continuum of mass L of ex ante identical workers. A constant labor force is consistent with our two-state model in which individuals always participate in the labor market. Let E(t) and U (t) be the mass of employed and unemployed individuals at time t, respectively. It follows that E(t) + U (t) = L for all t. We want to calculate the instantaneous change 18 Recall. µu (¿ ) =. that µu (¿ ) =. d ln Su (¿ ) ¡ d¿. du (¿ ) Su (¿). and notice that. du (¿ ) Su (¿ ). d ln Su (¿ ) d¿. for all ¿ ¸ 0. Then R for all ¿ ¸ 0. Integrating between 0 and t we get ln Su (t) = ¡ 0t µu (¿ )d¿ . Rt. = ¡. Su (t) = e¡ 0 µu (¿ )d¿ . This, togheter with du (t) = µu (t)Su (t), implies du (t) = Therefore R ¡ 0t µ u (¿ )d¿ µu (t)e . When the hazard rate is independent of the elapsed duration we have Rt Rt u t. Hence, (12) 0 µ u (¿ )d¿ = 0 µ u d¿ =R µ R and (13) follow. 19 We have EfT g = 1 td (t)dt = 1 tµ e¡µ u t dt. Integrating by parts using u = t and u u u 0 0 v = ¡µu e¡µu t we obtain (14). A similar procedure can be used to show that the variance of Tu is V arfTu g = µ12 . u. 8.
(13) d U(t). At each instant, the fraction in the number of unemployed individuals, dt of workers that become unemployed equals the hazard rate for employment, µe . Similarly, the fraction of workers that become employed equals the hazard rate for unemployment, µu . Therefore:. d U (t) = µ e E(t) ¡ µ u U (t): dt. (19). Let u ´ U L be the steady-state unemployment rate, where U is the constant d U (t) = 0 in (19), and using E = L¡U , mass of unemployed workers. Imposing dt we obtain:. u=. µe ® ; = µ e + µu ® + ¸[1 ¡ F (!)]. (20). where the second equality follows from (11) and (15). This expression shows that the steady-state unemployment rate increases with the job-separation rate and decreases with the job-…nding rate. We can rewrite (20) as follows: u =. 1 µu. 1 µu. + µ1e. . Combining this with (14) and. (18) we get:. u=. EfTu g . EfTu g + EfTe g. (21). The steady-state unemployment rate increases with the expected duration of completed unemployment spells, and decreases with the expected duration of completed employment spells. Equation (21) is interesting because it shows that the unemployment rate, which is an average across workers at each moment, re‡ects the average outcomes experienced by individual workers across time. Thus, there is a link between economy-wide averages at a point in time and the time-series averages for a representative agent (Ljungqvist and Sargent (2004)). We can think of each individual’s labor-market history as a continuos-time Markov chain de…ned on two states, employment and unemployment. The instantaneous transition rate from unemployment to employment is constant over time and equal to ¸[1 ¡ F (!)], while the instantaneous transition rate from employment to unemployment is also constant and equal to ®. This provides an alternative way of deriving the steady-state unemployment rate as the steadystate probability of unemployment for this chain. A well known statistical result establishes that the latter is equal to the ratio between ® and ® + ¸[1 ¡ F (!)].. 5. Comparative Statics. We are now ready to study the e¤ects of changes in the primitives of the model on the reservation wage, the hazard rates, the expected duration of completed. 9.
(14) employment and unemployment spells, and the steady-state unemployment rate. In what follows, we focus on the interior case ! 2 (b; w). Consider the e¤ect of an increase in b ¡ c. This can happen either becasue b increases (an increase in the value of leisure) or because c decreases (a reduction in out-of-pocket expenditures while searching for employment). Totally di¤erentiating (10) we obtain: ½+® @! = 2 (0; 1): @(b ¡ c) ½ + ® + µu. (22). Thus, an increase in b ¡ c increases the reservation wage, but less that one for one. This can be obtained from Figure 1, where the upward-sloping line (which represents the marginal cost of search) shifts to the right by a distance equal to the change in b ¡ c. This induces an increase in ! which is smaller than the increase in b ¡ c because the other curve (which represents the marginal revenue from continued search) is downward sloping. The increase in ! induces an increase in F (!), so the probability of accepting a job o¤er, 1 ¡ F (!), decreases. This, in turn, generates a reduction in the hazard rate for unemployment, µu = ¸[1 ¡ F (!)]. The hazard rate for employment, µ e = ®, is not a¤ected. The expected duration of unemployment spells, EfTu g = µ1u , increases while the duration of employment spells does not change, EfTe g = ®1 . The steady-state e unemployment rate, u = µeµ+µ , increases. u Imagine that the discount rate, ½, goes up. This reduces the marginal gain from continued search. In Figure 1, the downward-sloping curve shifts down while the upward-sloping curve does not shift. Hence, the reservation wage goes down. The analytical expression, obtained by totally di¤erentiating (10), is: ¸ @! =¡ @½ (½ + ®)(½ + ® + µu ). Z. w. !. [1 ¡ F (w)]dw < 0:. (23). Therefore, F (!) falls, µu increases, µe does not change, EfTu g falls, EfTe g does not change, and u decreases. An increase in the arrival rate of job o¤ers, ¸, increases the reservation wage, !. This is easily obtained from Figure 1, where the marginal revenue curve shifts up while the marginal cost line does not move. The analytical expression for this change is: Z w @! 1 = [1 ¡ F (w)]dw > 0: (24) @¸ ½ + ® + µu ! The e¤ect on the hazard rate for unemployment is a bit more complicated. The reason is that, unlike the previous cases, ¸ has both a direct e¤ect and an indirect e¤ect on µ u = ¸[1 ¡ F (!)]. The direct e¤ect is clearly positive: for a constant level of !; an increase in ¸ increases µu . The indirect e¤ect, however, tends to reduce µ u because the increase in ! reduces the probability of accepting an o¤er, 1¡F (!). The net e¤ect is ambiguous, as can be seen from the following. 10.
(15) expression: ¸F 0 (!) @µu = [1 ¡ F (!)] ¡ @¸ ½ + ® + µu. Z. w !. [1 ¡ F (w)]dw R 0:. (25). Therefore, the e¤ect on the expected duration of unemployment and on the steaty-state unemployment rate is also ambiguous. For the intuitive result that an increase in job availability reduces unemployment duration, the …rst term in the right-hand side of (25) must be bigger than the second. Burdett (1981) shows that a su¢cient condition for this to happen is a log-concave wage-o¤er density funciton. Consider now an increase in the arrival rate of layo¤s, ®. This has the obvious e¤ect of increasing the hazard rate for employment, µe , and reducing the expected duration of employment spells, EfTe g = ®1 . The impact on the reservation wage can be obtained from Figure 1, where the marginal gain curve shifts down, implying a reduction in !. In particular: Z w ¸ @! =¡ [1 ¡ F (w)]dw < 0: (26) @® (½ + ®)(½ + ® + µu ) ! This induces an increase in µ u and a reduction in EfTu g. Since people get …red more often but at the same time the job-…nding rate increases, the change in u = µe µe +µ u is ambiguous. More restrictions are needed to obtain the intuitive result that the steady-state unemployment rate increases when the job-separation rate does. Finally, we want to investigate the e¤ects of changes in the probability distribution of wage o¤ers, F . We focus on two kinds of changes: a translation of F to the right, and a mean-preserving spread.20 A translation to the right has the e¤ect of increasing the mean of the wage distribution while keeping all higher moments unchanged. In Figure 1, the marginal return curve shifts up and to the right for all x smaller than w. Also, at the point where the two curves cross, the shift to the right equals ¹ (the increase in EfW g). Since the marginal cost curve has positive slope, the resulting increase in ! is smaller than ¹. This can be con…rmed by totally di¤erentiating (10): µu @! = 2 (0; 1): @¹ ½ + ® + µu. (27). The e¤ect of the translation on the probability of accepting an o¤er, and then on the hazard rate for unemployment, is trickier because it is not clear at …rst that 20 A cumulative distribution function G is said to be a translation of another distribution function F if there exists a constant ¹ such that G(w + ¹) = F (w) for all w. When ¹ is positive, the translation is to the right. A distribution indexed by ¾2 , F (¢; ¾2 ), is said to have been obtained from a distribution indexed by ¾ 1 , F (¢;R¾1 ), by a mean-preserving spread if the two distributions have the same mean and satisfy: 0x [F (w; ¾2 ) ¡ F (w; ¾ 1 )]dw ¸ 0 for all x. For in…nitesimal changes in ¾, R the di¤erential version of the previous expression is: 0x F¾ (w; ¾)dw ¸ 0 for all x, where the integrand is the partial derivative of F with respect to ¾.. 11.
(16) the area under the new density function and to the right of the new reservation wage is higher than the area under the old density function and to the right of the old reservation wage. However, the fact that @! @¹ is smaller than one implies that this is actually true. Formally: @! @µu = (1 ¡ )¸F 0 (!) > 0: @¹ @¹. (28). It follows from (28) that both EfTu g and u fall when the average wage o¤er increases. Mean-preserving spreads have the property of increasing the variance of a distribution without changing its mean. One can show that: Z ! ¸ @! = F¾ (w; 0)]dw ¸ 0; (29) @¾ ½ + ® + µu 0 where the non-negative sign follows from the very de…ntion of mean-presearving spread. The impact on µu is, in general, ambiguous: @µu @! = ¡¸F 0 (!) ¡ ¸F¾ (!; 0) R 0: @¾ @¾. (30). This implies that a mean-preserving spread has an ambiguous e¤ect on EfTu g and u.. 6. Education and Unemployment. A thorough study of the relationship between education and unemployment is outside the scope of this paper since it would requiere us to extend the model by making the decision to invest in education endogenous. That being said, we can still use the results of the previous section to shed some light on the issue. To this end, we have to think about the likely di¤erences on the parameters of the model across individuals with di¤erent education levels.21 A lower discount rate is one of the factors that would induce higher investmet in education. Hence, we would expect a negative relation between this parameter and education. If we think of ½ as an interest rate we obtain a similar conclusion, since higher education is usually associated with better possibilities of …nancing search. The relation between b ¡ c and education can be negative, both because of the greater foregone earnings of more educated people and because of their typically lower unemployment bene…ts. This is not guaranteed, however. One can imagine more educated workers being better connected to other people or institutions that may help them search at a lower cost. Also, since b depends on individuals’ preferences for leisure, one cannot rule out the possibility of more educated people with a higher value for this parameter. 21 The. analysis in this section follows the one in Mincer (1991).. 12.
(17) There are reasons to think that ® - the instantaneous probability of being …red or laid o¤ - is lower for more educated people. On one hand, more educated people tend to receive more on-the job training, which makes …ring them more costly for the …rms. On the other hand, hiring more educated workers may entail higher …xed costs for …rms (e.g., screening, hiring, fringe bene…ts independent of hours, etc.), which can also make …rms more reluctant to …re them. It is also possible that the job matching process is easier for more educated people, which would also reduce the probability of being …red. The arrival rate of job o¤ers while unemployed, ¸, is likely to be higher for more educated workers. One reason is that, because of higher foregone earnings, more educated individuals have incentives to spend more resources on the search process, either by searching more intensively (more hours per week) or by incurring other kinds of expenditures (advertising, transportation, etc.). It is also likely that more educated workers can gather information about market opportunities more e¢ciently, and that the intensity of search by …rms is higher for this type of workers. Both phenomena are associated, in the context of our model, with an increase in ¸. Finally, and in accordance with empirical data, it is reasonble to expect that the wage-o¤er distribution for more educated workers has a higher mean that the one for less educated workers. Combining the preceding analysis with the comparative-statics results of the previous section we conclude that, in all likelihood, more educated workers will have a higher reservation wage. The impact of more education on the hazard rate for unemployment is ambiguos. Some factors, like ® and ½, make the hazard lower for more educated workers, while others, like the mean of the wage distribution, make the hazard higher. Accordingly, the impact of more education on the expected duration of completed unemployment spells, is ambiguous. The e¤ect of more education on the hazard rate for employment is likely to be negative. This implies a higher expected duration of completed employment spells for more educated workers. Finally, the impact of more education on the steady-state unemployment rate is ambiguous.. 7. Econometrics. One of the nice features of search theory is that it provides a framework to structure and analyze labor-market data. This can be shown by means of a simple example.22 Suppose we have a random sample of n individuals. An observation for individual i 2 f1; :::; ng consists of the duration of unemployment, ti , and a vector of time-independent explanatory varaibles, xi . For individuals that were employed at the time of the survey, ti measures the length of the last completed unemployment spell. For individuals that were unemployed, ti measures the elapsed duration of the current unemployment spell, and is therefore right censored. If the model described in the preceding sections is correct, the 22 Extensions. to more complicated setups can be found in Lancaster (1990).. 13.
(18) density and survival functions for unemployment are: du (ti ; i) = µui e¡µui ti ;. Su (ti ; i) = µ ui e¡µui ti ;. (31). where µui = ¸i [1 ¡ F (! i ; i)] is the individual-speci…c hazard rate. Since ¸i , F (¢; i), and ! i are usually unobserved, it is standard to model the hazard rate directly, as a function of the vector of explanatory variables. The most common version is the exponential form µui = µu (xi ; ¯) = e¡xi ¯ ;. (32). where ¯ is a parameter vector to be estimated. Let A, C, and U be the sets of all, censored, and uncensored observations, respectively. Combining (31) and (32), and abusing notation, whe can write the log-likelihood function as follows: P ln du (ti ; xi ; ¯) + ln Su (ti ; xi ; ¯) i2U P Pi2C = ln µu (xi ; ¯) ¡ µu (xi ; ¯)ti i2UP i2A P ¡x =¡ xi ¯ ¡ e i ¯ ti. l(¯ j x; t) =. P. i2U. (33). i2A. where x ´ (x1 ; :::; xn ) and t ´ (t1 ; :::; tn ). The maximum-likelihood estimator, ¯ML , is obtained by maximizing l(¯ j x; t) with respect to ¯.. 8. Concluding remarks. We conclude like we started, with a quote from Lucas (1987): Here, then, is a prototype (at least) of a theory of unemployment. Let us take it seriously and criticize it. Indeed, the model explicitness invites hard questioning. Why can the worker not work and search at the same time (the way economists do)? Doesn’t he learn anything about his job opportunities as he searches? If he is no di¤erent from other workers, why does he face a distribution of wage possibilities (as opposed to opportunities to work ad ‘the’ going wage)? These are all good questions, and we could think of more. Some of them are hard to deal with, some quite easy. But before turning to some of these questions, note this: in so criticizing McCall’s model, we are thinking about unemployment, really thinking about what it is like to be unemployed in ways that …x-price and other macroeconomic-level unemployment theories can never lead us to do. Questioning a McCall worker is like having a conversation with an out-of-work friend: ‘Maybe you are setting your sights too high’, or ‘Why did you quit your old job before you had a new one lined up?’ This is real social science: an attempt to model, to understand, 14.
(19) human behavior by visualizing the situations people …nd themselves in, the options they face and the pros and cons as they themselves see them. Many of the extensions listed in Lucas’ quotation are already available in the literature, including on-the-job search, on-the-job wage changes, on-thejob learning, directed search, two-sided search and matching, endogenous wage determination, etc. In addition to Mortensen (1986), two excellent surveys of this literature are Mortensen and Pissarides (1999), and Rogerson et al. (2004). Numerous papers use search-theoretic models to empirically study labor-market issues. Eckstein and van den Berg (2006) survey this literature. Search models have also been used to study the feedback between labor- and credit-market imperfections (Wasmer and Weil (2004)). Last but not least, search theory has been used to ask normative questions, especially with regard to the optimal design of unemployment insurance schemes (e.g., Shimer and Werning (2006)).. 15.
(20) References Burdett, K. (1981). A Useful Restriction on the O¤er Distribution in Job Search Models, in G. Eliasson, B. Holmlund and F. Sta¤ord (eds.), Studies in Labor Market Behavior: Sweden and the United States, Stockholm, Sweden: I.U.I. Conference Report. Eckstein, Z. and van den Berg, G. (2006). Empirical Labor Search: A Survey, forthcoming in Journal of Econometrics. Lancaster, T. (1990). The Econometric Analysis of Transition Data, Cambridge University Press. Lucas, R. (1987). Models of Business Cycles, Yrjö Jahnsson Lectures, Basil Blackwell. Ljungqvist, L. and Sargent, T. (2004). Recursive Macroeconomic Theory, Second Edition, MIT Press. McCall, J. (1970). Economics of Information and Job Search, The Quarterly Journal of Economics, Vol. 84, No. 1 (February), pp. 113-126. Mincer, J. (1991). Education and Unemployment, NBER Working Paper No. 3838, September. Mortensen, D. (1986). Job Search and Labor Market Analysis, in O. Ashenfelter and R. Layard (eds.), Handbook of Labor Economics, Vol. 2, Amsterdam: North Holland, pp. 849-919. Mortensen, D. and Pissarides, C. (1999). New Developments in Models of Search in the Labor Market, in O. Ashenfelter and D. Card (eds.), Handbook of Labor Economics, Vol. 3, Amsterdam: North Holland, pp. 2567-2627. Rogerson, R., Shimer, R. and Wright, R. (2004). Search-Theoretic Models of the Labor Market: A Survey, NBER Working Paper No. 10655, August. Shimer, R. and Werning, I. (2006). Reservation Wages and Unemployment Insurance, mimeo, Massachusetts Institute of Technology. Wasmer, E. and Weil, P. (2004). The Macroeconomics of Labor and Credit Market Imperfections, The American Economic Review, Vol. 94, No. 4 (September), pp. 944-963.. 16.
(21) Pontificia Universidad Católica Argentina “Santa María de los Buenos Aires”. Facultad de Ciencias Sociales y Económicas Departamento de Economía Documentos de Trabajo Publicados: Nº 1: Millán Smitmans, Patricio,“Panorama del Sector de Transportes en América Latina y el Caribe”, Noviembre de 2005. Nº 2: Dagnino Pastore, Ángeles Servente y Soledad Casares Bledel, “La Tendencia y las Fluctuaciones de la Economía Argentina”, Diciembre de 2005. Nº 3: González Fraga, Javier,“La Visión del Hombre y del Mundo en John M. Keynes y en Raúl Prebisch”, Marzo de 2006. Nº 4: Saporiti de Baldrich, Patricia Alejandra, “Turismo y Desarrollo Económico”, Abril de 2006. Nº 5: Kyska, Helga y Marengo, Fernando, “Efectos de la devaluación sobre los patrimonios sectoriales de la economía argentina”, Mayo de 2006..
(22)
Figure
Documento similar
There are five main criticisms that are apparent in evolutionary archaeology: I absence of a well-defined unit of cultural transmission: 2 rejection of human intent; 3 absence of
