We hope that this report will be seen as a definitive snapshot of progress in the integration of migrants in Ireland. This report provides a map of the current situation in Ireland and indicates specific areas of concern that need targeted action.
Glossary: Abbreviations and Irish Terms
EU12 EU member states that joined in 2004 and 2007: Cyprus, Czech Republic, Estonia, Hungary, Latvia, Malta, Poland, Slovakia, Slovenia, Romania, Bulgaria.
Introduction
Integration Monitor: Key Findings Employment Indicators
Executive Summary
Education Indicators
Social Inclusion Indicators
The proportion of British citizens who own their homes is closer to that of Irish citizens. Sport participation, whether active participation in sport or social participation (measured as volunteering, attendance and club membership), is very similar for Irish and UK citizens.
Active Citizenship Indicators
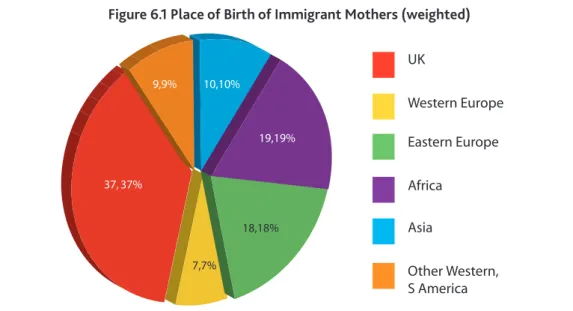
Special Focus on Immigrant Children in Irish Schools
These mothers (and their spouses) are also less likely to provide help with homework than Irish parents. When social integration is taken into account, the proportion of Irish children and immigrant children who report being picked on or bullied in the past year does not differ significantly.
Policy Issues
Education (2011)
Social Inclusion (2009)
Active Citizenship (end 2010)
- The Challenges of Measuring Integration
- Defining Integration
- The Integration Monitor
One of the common basic principles4 of the integration policy for immigrants is that it is necessary to develop clear indicators to adjust the policy and evaluate progress with integration (see Annex 1). This monitor seeks to provide a balanced and rigorous assessment of the extent of integration of immigrants in Ireland using the most up-to-date and reliable indicators available.
Introduction, Policy and Context
- Challenges of Monitoring Outcomes Among Immigrants
- Employment Employment Rate
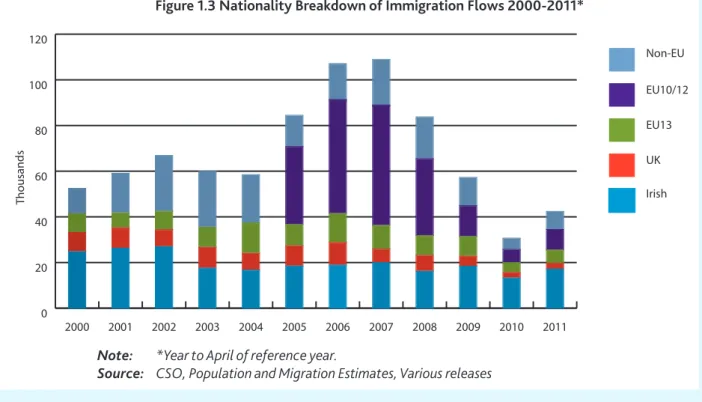
- Overview of Main Trends in Migration in Ireland
- Overview of Irish Migration Policy and Legislation
- Integration Policy
- Employment, Unemployment and Activity Rates
Thus, integration can be simply defined as 'the process of being an accepted part of society', as an individual and as a group (Penninx, 2010). The CSO has indicated that it will publish revised population estimates for the years 2007 to 2011 (i.e. the period during which this difference appeared) later in 2012 after a full analysis at a detailed level has been completed. of differences with the final registration results. 18.
Employment and Integration
- Self-Employment, Occupation and Sector
- Summary of Employment Indicators
- Educational Outcomes for Adults in Ireland
- Highest Educational Attainment As has been previously documented, immigrants in
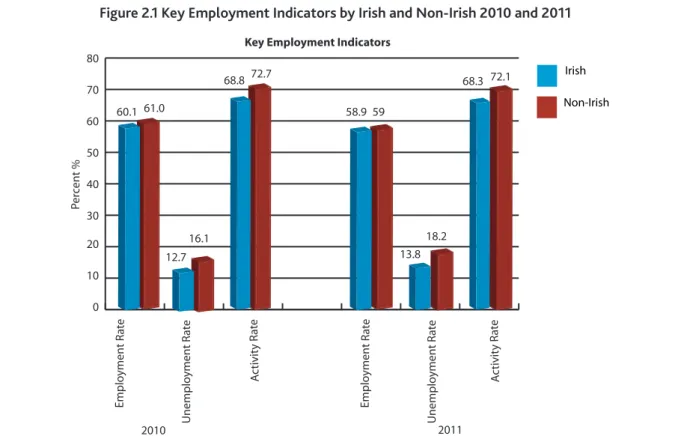
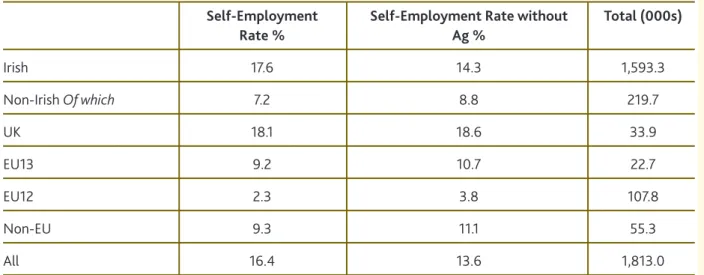
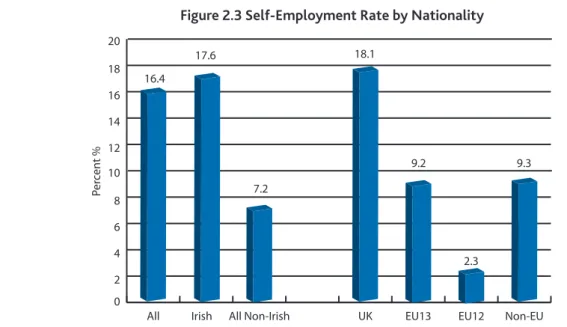
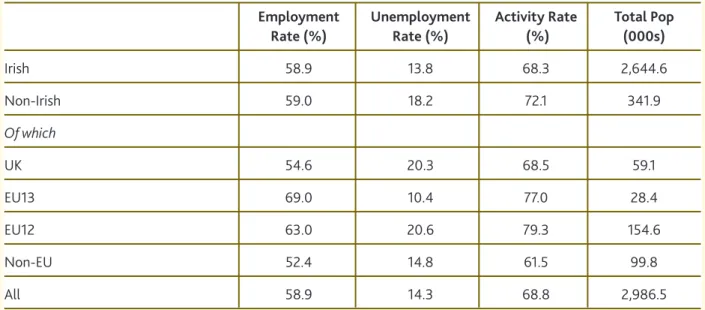
The unemployment rate among Irish people rose from 4.6 percent to 13.8 percent over the same period. The unemployment rate for non-Irish nationals in the 15-64 age group rose dramatically to 18.2 per cent of the labor force, an increase of 2.1 percentage points since the first quarter of 2010 (see Annual Integration Review 2010). The self-employment rate for Irish citizens, at nearly 18 percent, is significantly higher than for non-Irish citizens, which is 7 percent.
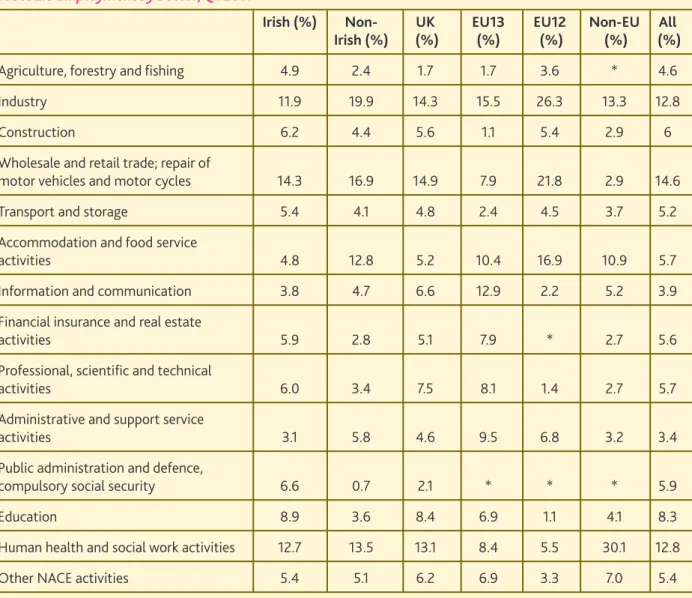
EU13 citizens are concentrated in the information and communications sector (13 percent), compared to less than 4 percent of Irish citizens. There is also a higher proportion of Irish nationals in professional positions (14 per cent) compared to the non-Irish national average (9 per cent). For prime-age and older workers, the unemployment rate is higher for non-Irish nationals.
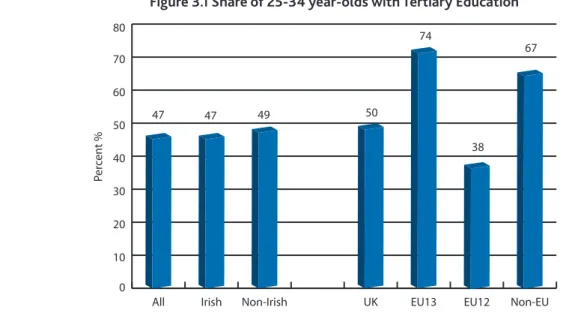
The table shows that there is a higher proportion of non-Irish citizens with third-level education (45 percent) than Irish citizens (32 percent).
Education and Integration
- Early School Leavers Among Adult Immigrants
- Immigrant Children in Irish Schools
- Summary of Findings on Educational Attainment
- Household Income
Educational outcomes for adults are the focus of the first part of this chapter, section 3.1, which compares educational outcomes for Irish and non-Irish adults in Ireland. This should be taken into account when comparing third level attainment between Irish and non-Irish nationals. The proportion of Irish and non-Irish nationals with a second-level higher education diploma and a post-graduate diploma is very similar for both groups.
So for this age group there is no clear difference in the overall proportion of Irish and non-Irish nationals who have third level qualifications. So when we compare the proportion with tertiary education among 25-34 year olds in Figure 3.1, the proportion of non-Irish nationals with tertiary education is very similar to that of Irish nationals. Second, while most non-Irish nationals can access third-level and further education, most must pay fees to do so.
Appendix 4 discusses the changes in the survey and the non-Irish sample in more detail.
Social Inclusion and Integration
- Poverty Rates
- Health Status
- Home Ownership
- Active and Social Participation in Sport
Estimates of median equivalent income for Irish and non-Irish citizens and for different national groups are presented in Table 4.1. The median disposable household income for non-Irish nationals is about 90 percent of that of Irish nationals.76 The total figure for non-Irish nationals hides considerable differences between groups. The equivalent income of non-Irish citizens is 97 per cent of that of Irish citizens in 2009 and 87 per cent in 2008.
Equivalent income fell slightly for Irish citizens between 2008 and 2009, and rose slightly for non-Irish citizens. A slightly higher proportion of non-Irish nationals are disadvantaged (nearly 19 percent), although this is not significantly different from the poverty rate for Irish nationals. Irish citizens (17 percent). The rate of persistent poverty among non-Irish nationals (6.5 percent) is higher than among Irish nationals (5.4 percent).
So while the 'at-risk-of-poverty' rate among non-Irish nationals is not higher in 2009, the consistent poverty rate is slightly higher.

Evidence from the Irish Sports Monitor
Summary of Inclusion Indicators
For a general comparison between Irish and non-Irish citizens, we note that non-Irish citizens have slightly lower disposable household income. 92 In 2010, non-Irish nationals accounted for 28% of registered volunteers at volunteering centers (direct correspondence with Volunteering Ireland, thanks to Peter Szlovak). At-risk-of-income-poverty rates do not differ between Irish and non-Irish citizens in 2009.
In fact, in 2009 there was no difference between the median equivalent income of Irish and non-Irish people. However, we see a change in consistent poverty: in 2008 there were no differences between Irish and non-Irish citizens, consistent poverty is now somewhat higher among the non-Irish group. With home ownership, the gap widened somewhat between 2008 and 2009 between Irish and non-Irish.
It should be noted that the first two indicators do not allow us to directly compare outcomes between Irish and non-Irish; instead they describe the context and opportunities for integration.
Citizenship
The active participation of immigrants in the democratic process and the possibility of acquiring the citizenship of a Member State are emphasized in the Common Basic Principles of Integration (CBP) as essential for the integration of migrants. Equal access of immigrants to institutions, goods and services ensured by the granting of permanent or long-term residence status is also critical. To measure integration in the field of active citizenship, three indicators were proposed at the ministerial conference in Zaragoza: the share of immigrants who acquired citizenship; share of immigrants with permanent or long-term residence permits; and the proportion of immigrants among elected representatives.
This chapter presents some new information on the number of persons who acquired citizenship and long-term residence permits in 2010. Since the publication of the 2010 Annual Monitoring of Integration, there have been several important policy changes in the field of active citizenship, particularly in relation to access to citizenship through naturalization. Continued delays in the implementation of the Immigration, Residence and Protection Act 2010 mean that Ireland remains without statutory long-term residence status.
Box 5.1 details access to citizenship, box 5.2 access to long-term residence and box 5.3 access to political participation.
Active Citizenship 95
- Long-Term Residence
- Voting and Elected Representatives
- Summary of Findings on Active Citizenship
- Introduction
- Defining the Children of Immigrants in the Growing Up in Ireland Study
The share of immigrants who have acquired permanent or long-term residence has been agreed by EU Member States as a key indicator of integration results102, as active citizenship supports migrants' integration, participation in the democratic process and self-esteem. Available data shows that in the six years between 2005, non-EEA nationals aged 16 and over were allowed long-term residence in Ireland. Non-EEA nationals granted long-term residence under the provisions of the Bill would have the right to reside in the State, travel in and out of the State, work, and receive healthcare like Irish nationals , social security and education to the same extent as citizens.
106 To apply for long-term residency as a spouse/dependent, the applicant must be legally resident in the state as a spouse/dependent for the required five years. An NGO Coalition Briefing Paper on the bill states that the proposals in the bill are weak and that access to long-term resident status involves meeting vague criteria that are stricter than current ones. The issued Stamp 4 entitles the holder to work in the state without holding a work permit.
The proportion of people from outside the EEA who have naturalized in the period since 2005 has increased since then.

Defining Immigrants in the Study
Thematic Focus: Immigrant Children in Irish Schools
- Academic Performance in Reading and Mathematics
- Attitudes to School and Engagement
- Support for Learning at Home (Mothers’ Reports)
- Children’s Peer Relationships
- Summary of Findings on the Children of Immigrants in Irish Schools
- Policy Issues
- Issues for Future Data Collection
The difference in the proportion of Irish and immigrant pupils with a non-English-speaking background is statistically significant for the presented indicator (p<0.05). All other proportions do not differ significantly from the proportion of Irish children in the lowest reading quintile. Overall, immigrant children are slightly less likely to be in the lowest math quintile, both English-speaking and non-native.
None of the proportions presented are significantly different from the proportion of Irish children in the lowest Mathematics quintile. Note: The difference between the proportions of Irish and immigrants from a non-English speaking background in the highest quintile is statistically significant (p<0.05). Note: The difference in the proportions of Irish and Immigrant students is statistically significant for each of the indicators presented (p<0.05).
The difference in the proportions of Irish children and Asian children is not statistically significant.
Issues for Policy and Data Collection
Furthermore, it has changed between 2008 and 2009, so differences may be due to differences in the composition of this very diverse group. In Chapter 5, we note that, in relation to naturalization applications, significant progress has been made on certain barriers to integration identified in the 2010 Annual Integration Monitor. Continued delays in the passage of the Immigration, Residence and Protection Bill 2010 means that Ireland remains without a statutory long-term residence permit.
For example, the entitlements of family members of long-term residence holders are not clearly set out in the Bill. In Chapter 1, we document a significant decrease in funding to the Office for the Promotion of Migrant Integration, and a decrease in funding to organizations that support it. In the short term, we recommend that continued efforts be made to encourage the participation of non-Irish nationals in the EU-SILC and the QNHS.
The increase in the proportion of non-Irish nationals in the EU-SILC between 2008 and 2009 is encouraging in this regard, but concerns remain about this sample.
Bibliography
- Common Basic Principles For Immigrant Integration Policy In The European Union
- Definition of Indicators
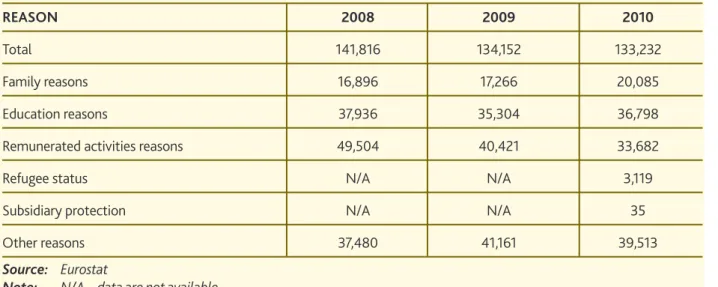
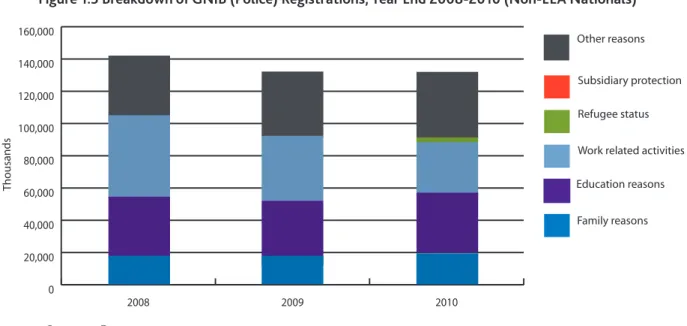
- Valid Permits by Reason
- Key Datasets Utilised for This Research Report
The Labor Market Characteristics and Labor Market Impacts of Immigrants in Ireland”, The Economic and Social Review 37, No. Households are asked to participate in the survey for five consecutive quarters and are. First, the QNHS is only a survey of private households, certain groups are excluded in the selection of the sample.
Here we see that the majority of non-Irish citizens in the working age group are in the 25-44 age group, as in the 2010 Integration Monitor. This is likely to have had implications for the non-Irish sample between the two surveys, given the rapid immigration of non-Irish citizens into period between 2002 and 2006. The proportion of non-Irish citizens is much higher in the EU-SILC 2009 than in the 2008 sample.
131 Some differences in the samples may result from the fact that the EU SILC data is drawn from an entire calendar year, and the QNHS is only one quarter.