Index Report 2017
Social Inclusion Monitor Europe
Daniel Schraad-Tischler, Christof Schiller,
Sascha Matthias Heller, Nina Siemer
1 2 3 4 5 6 7 8 9 10 11 12 13 14 15
17 18 19 20 21 22 23 24 25 26 27 28
Denmark Sweden Finland Czech Republic Slovenia Netherlands Germany Austria Luxembourg France United Kingdom Estonia Belgium Slovakia EU Average Poland Malta Ireland Lithuania Latvia Portugal Cyprus Hungary Croatia Spain Italy Bulgaria Romania Greece
7.39 7.31 7.14 6.84 6.74 6.73 6.71 6.69 6.55 6.29 6.22 6.19 6.18 5.91 5.85 5.79 5.79 5.66 5.61 5.46 5.36 5.31 5.18 5.07 4.96 4.84 4.19 3.99 3.70
Social Justice Index
1
0 2 3 4 5 6 7 8 9 10
Malta
I II III IV V VI
6.20 4.54 6.46 4.89 7.66 4.73
1
0 2 3 4 5 6 7 8 9 10
Netherlands
I II III IV V VI
6.98 6.09 6.82 7.53 7.70 5.27 1
0 2 3 4 5 6 7 8 9 10
Austria
I II III IV V VI
6.70 6.33 7.06 6.72 7.22 6.10
1
0 2 3 4 5 6 7 8 9 10
France
I II III IV V VI
6.65 5.93 5.90 6.20 7.50 5.59
1
0 2 3 4 5 6 7 8 9 10
Poland
I II III IV V VI
5.77 6.86 5.85 5.77 4.69 4.73 1
0 2 3 4 5 6 7 8 9 10
Belgium
I II III IV V VI
6.06 6.19 6.02 6.41 7.64 5.12
1
0 2 3 4 5 6 7 8 9 10
Germany
I II III IV V VI
6.29 6.54 7.21 6.97 8.05 5.69
1
0 2 3 4 5 6 7 8 9 10
Portugal
I II III IV V VI
5.01 4.92 5.97 5.86 6.04 4.89 1
0 2 3 4 5 6 7 8 9 10
Bulgaria
I II III IV V VI
1.39 6.23 5.44 4.02 5.20 5.20
1
0 2 3 4 5 6 7 8 9 10
Greece
I II III IV V VI
2.53 5.27 3.46 4.36 3.99 3.60
1
0 2 3 4 5 6 7 8 9 10
Romania
I II III IV V VI
1.77 4.91 5.50 4.33 4.21 5.18 1
0 2 3 4 5 6 7 8 9 10
Croatia
I II III IV V VI
4.21 6.91 4.35 4.85 6.00 4.72
1
0 2 3 4 5 6 7 8 9 10
Hungary
I II III IV V VI
4.73 5.20 6.33 4.48 5.33 4.72 Poverty prevention
Equitable education Labor market access Social cohesion and non-discrimination Health
Intergenerational justice I
II III IV V VI
5 6 7 8 9 10 11 12 13 14 15
17 18 19 20 21 22 23 24 25 26 27 28
Slovenia Netherlands Germany Austria Luxembourg France United Kingdom Estonia Belgium Slovakia EU Average Poland Malta Ireland Lithuania Latvia Portugal Cyprus Hungary Croatia Spain Italy Bulgaria Romania Greece
6.74 6.73 6.71 6.69 6.55 6.29 6.22 6.19 6.18 5.91 5.85 5.79 5.79 5.66 5.61 5.46 5.36 5.31 5.18 5.07 4.96 4.84 4.19 3.99 3.70
1
0 2 3 4 5 6 7 8 9 10
Slovakia
I II III IV V VI
6.67 5.99 5.49 5.63 5.38 5.13 1
0 2 3 4 5 6 7 8 9 10
Cyprus
I II III IV V VI
4.40 6.72 5.36 5.54 6.27 3.91
1
0 2 3 4 5 6 7 8 9 10
Ireland
I II III IV V VI
4.80 5.87 6.09 6.53 6.35 5.39
1
0 2 3 4 5 6 7 8 9 10
Slovenia
I II III IV V VI
6.60 7.30 6.61 7.07 6.44 6.24 1
0 2 3 4 5 6 7 8 9 10
Czech Republic
I II III IV V VI
7.81 6.35 6.46 6.11 7.61 5.66
1
0 2 3 4 5 6 7 8 9 10
Italy
I II III IV V VI
4.16 5.40 5.17 4.88 5.79 4.10
1
0 2 3 4 5 6 7 8 9 10
Spain
I II III IV V VI
4.35 5.32 4.10 5.88 7.04 4.75 1
0 2 3 4 5 6 7 8 9 10
Denmark
I II III IV V VI
7.00 7.84 7.63 7.31 7.43 7.19
1
0 2 3 4 5 6 7 8 9 10
Latvia
I II III IV V VI
4.21 7.25 6.24 5.02 3.91 6.07
1
0 2 3 4 5 6 7 8 9 10
Sweden
I II III IV V VI
6.62 7.77 7.03 7.50 8.16 7.97 1
0 2 3 4 5 6 7 8 9 10
Estonia
I II III IV V VI
5.18 7.14 6.99 6.26 5.17 6.69
1
0 2 3 4 5 6 7 8 9 10
Lithuania
I II III IV V VI
3.83 7.26 6.07 5.97 5.75 6.24
1
0 2 3 4 5 6 7 8 9 10
United Kingdom
I II III IV V VI
5.70 6.10 7.10 6.14 7.09 5.47 1
0 2 3 4 5 6 7 8 9 10
Finland
I II III IV V VI
7.03 7.62 6.73 7.46 6.99 7.20
1
0 2 3 4 5 6 7 8 9 10
Luxembourg
I II III IV V VI
6.58 6.08 6.47 7.20 7.82 5.65
I. Key findings, in brief 6
II. Dimensions of social justice:
empirical findings 2017 17
1. Poverty prevention 17 2. Equitable education 28 3. Labor market access 35 4. Social cohesion and
non-discrimination 48
5. Health 60
6. Intergenerational justice 66
III. Methodology 80
IV. Twenty-eight country profiles 89
Austria 89
Belgium 90
Bulgaria 92
Croatia 94
Cyprus 95
Czech Republic 97
Denmark 98
Estonia 100
Finland 102
France 103
Germany 105
Greece 107
Hungary 109
Ireland 110
Italy 112
Latvia 114
Lithuania 115
Luxembourg 117
Malta 119
Netherlands 120
Poland 122
Portugal 124
Romania 125
Slovakia 127
Slovenia 129
Spain 130
Sweden 132
United Kingdom 134
References 136 Figures 140 Appendix 142 Publishing information 176
1. Europe is recovering not only economically, but also in the domain of social justice
After years of downward movement, an upward trend in the domain of social justice is evident in the broad majority of EU member states. Although far from all member states have regained their pre-crisis levels, the most recent EU Social Justice Index data give cause for hope that the worst is over not just in economic terms, but also from a social perspective. At the top of this year’s Social Justice Index are the northern European states of Denmark, Sweden and Finland. Round- ing out the top group are the Czech Republic, Slovenia, the Netherlands, Austria and Germany, while Greece, despite again posting slight gains this year, remains clearly in last place.
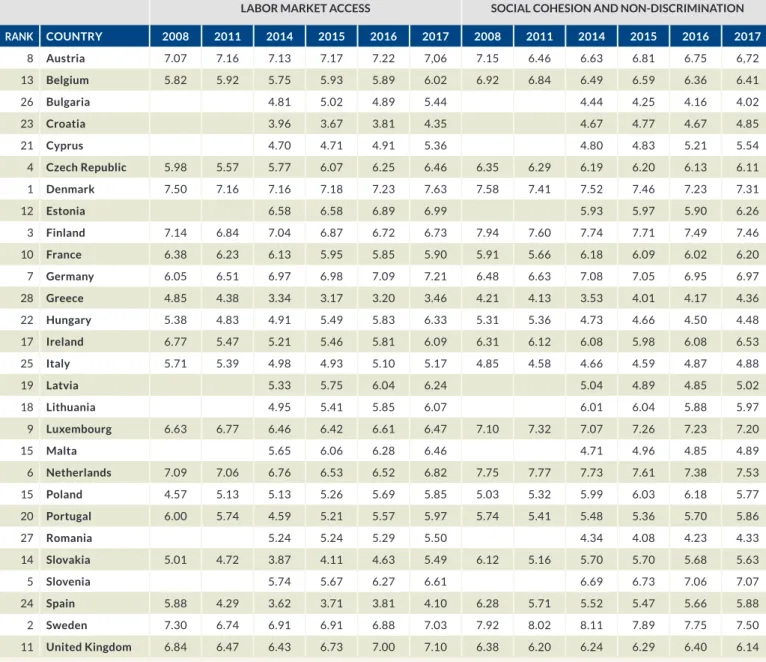
Labor market recovery as a driver of social improvements
Recovery in the labor market has been the primary driver of improved participa- tion opportunities in the EU. Job opportunities have improved in 26 of the 28 states as compared to the previous year. Recent data show the unemployment rate as a cross-EU average to have fallen to 8.7%. In 2013, at the height of the social crisis, this was 11% on a cross-EU basis (2008: 7%). An upward trend is also evident for the employment rate, which has risen from 64.1% (2013) to 66.6% (2016). An additional positive sign is that the recovery in the labor market has visibly reached the countries hit hardest by the crisis, even if the overall volume of joblessness remains very high particularly in southern Europe. In Greece, for example, the unemployment rate has fallen from 27.7% (2013) to 23.7% (2016), while in Spain a decline from 26.2% to 19.7% has been evident in the same time period. Among the countries that suffered from the euro crisis, Ireland and Portugal have shown the strongest recoveries. Alongside improved economic trends, these countries’
recent labor market reforms have also begun to bear fruit. Even if both countries remain below their pre-crisis levels, developments have been positive. For exam- ple, in Ireland, the unemployment rate of 13.3% in 2013 has since fallen to 8.1%.
A similar trend is evident in Portugal, where the unemployment rate has declined significantly from 17% to 11.5% in the same time period.
I. Key findings, in brief
Youth-unemployment rates in southern Europe have also dropped back somewhat from the absolute record levels seen in past years. In Greece, for example, this rate has fallen from nearly 60% in 2013 to its current level of 47.3%. A similar picture appears in Spain, with a decline from 55.5% to 44.4%. In Italy, the youth-un- employment rate is now 37.8% – a decline of nearly five percentage points from its peak of 42.7% in 2014. However, youth-unemployment rates in all three cri- sis-struck countries remain around twice as high as before the crisis. Overall, the youth-unemployment rate EU-wide has fallen from 23.6% in 2013 to a cur- rent rate of 18.7%. As a trend, this is a welcome development. However, it cannot be regarded as a full recovery, as the youth-unemployment rate as an overall cross-EU average is still above the pre-crisis level (2008 EU average: 15.6%). Par- ticularly in the southern European countries, the share of young people being left behind by the labor market remains far too great.
Change to 2008 1
2 3 4 5 6 7 8 9 10 11 12 13 14
15
17 18 19 20 21 22 23 24 25 26 27 28
Denmark Sweden Finland Czech Republic Slovenia Netherlands Germany Austria Luxembourg France United Kingdom Estonia Belgium Slovakia EU Average Poland Malta Ireland Lithuania Latvia Portugal Cyprus Hungary Croatia Spain Italy Bulgaria Romania Greece
-0.11 -0.11 +0.06 +0.22
-0.30 +0.48 -0.17 +0.08 +0.03 +0.13
+0.04 -0.09
+1.36
-0.43
+0.05
-0.12
-0.74 -0.30
-0.75 2015
2014 2016 2017
0 1 2 3 4 5 6 7 8 9 10
2011 Country 2008
Rank
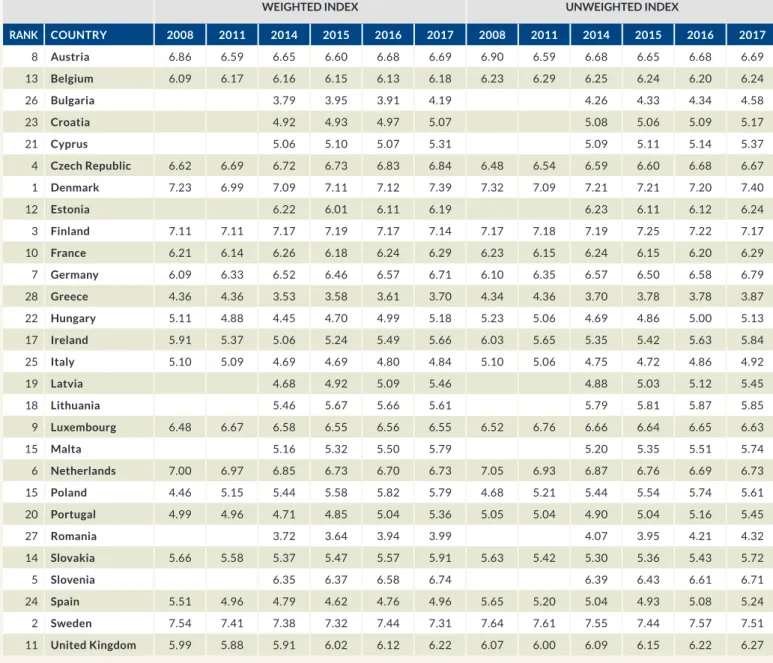
FIGURE 1 EU Social Justice Index (weighted) Social Justice Index
Source: Own calculations.
7.39 7.31 7.14 6.84 6.74 6.73 6.71 6.69 6.55 6.29 6.22 6.19 6.18 5.91 5.85 5.79 5.79 5.66 5.61 5.46 5.36 5.31 5.18 5.07 4.96 4.84 4.19 3.99 3.70 7.23 6.99 7.09 7.11 7.12 7.54 7.41 7.38 7.32 7.44 7.11 7.11 7.17 7.19 7.17 6.62 6.69 6.72 6.73 6.83 6.35 6.37 6.58 7.00 6.97 6.85 6.73 6.70 6.09 6.33 6.52 6.46 6.57 6.86 6.59 6.65 6.60 6.68 6.48 6.67 6.58 6.55 6.56 6.21 6.14 6.26 6.18 6.24 5.99 5.88 5.91 6.02 6.12 6.22 6.01 6.11 6.09 6.17 6.16 6.15 6.13 5.66 5.58 5.37 5.47 5.57 6.02 5.96 5.60 5.63 5.73 4.46 5.15 5.44 5.58 5.82 5.16 5.32 5.50 5.91 5.37 5.06 5.24 5.49 5.46 5.67 5.66 4.68 4.92 5.09 4.99 4.96 4.71 4.85 5.04 5.06 5.10 5.07 5.11 4.88 4.45 4.70 4.99 4.92 4.93 4.97 5.51 4.96 4.79 4.62 4.76 5.10 5.09 4.69 4.69 4.80 3.79 3.95 3.91 3.72 3.64 3.94 4.36 4.36 3.53 3.58 3.61 Unit: Score
The poverty risk is falling slightly – yet the gap between northern and southern Europe remains large
As a result of this overall positive employment trend, the risk of poverty and social exclusion has also fallen slightly across the European Union. While a total of 24.7% of the EU population faced this threat at the height of the social crisis in 2012/2013, this is now “only” 23.4%, according to the most recent data. How- ever, the social gap between northern and southern Europe remains very large, as many of the crisis-struck states continue to tread water or show only very min- imal forward progress with regard to poverty prevention. For example, the share of people at risk of poverty or social exclusion in Greece still sits at a shockingly high 35.6%, followed by 27.9% in Spain and 28.7% in Italy. As a comparison, FIGURE 2 Social Justice Index – dimensions and indicators
Social Justice Index
Poverty prevention
Equitable education
Labor market access
Social cohesion and non-discrimination
Health Intergenerational justice triple weight double weight double weight normal weight normal weight normal weight
At risk of poverty or social exclusion,
total population At risk of poverty or social exclusion (children, seniors)
Population living in quasi-jobless
households Severe material
deprivation (total population, children, seniors) Income poverty (total population, children, seniors)
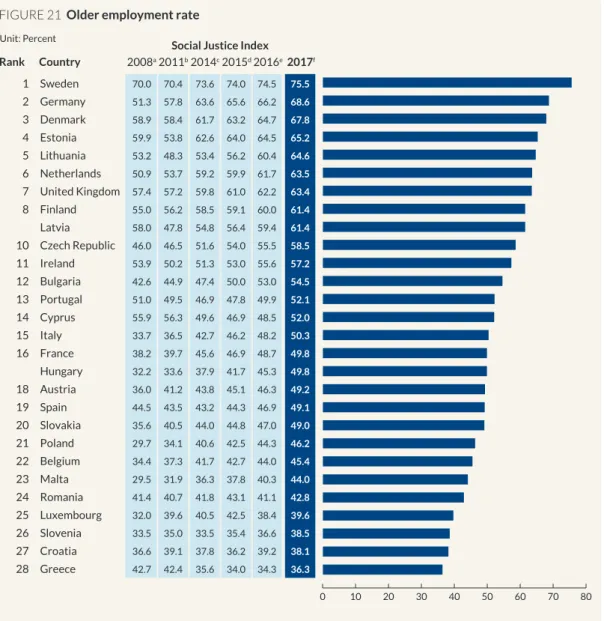
Employment Older employment
Employment foreign-born/
native-born Employment women/men Unemployment
Long-term unemployment
Youth unemployment
Low-skilled unemployment
Involuntary temporary employment In-work poverty Low pay incidence
Employment disabled/
non-disabled Education policy
(qualitative) Socioeconomic background and
student performance
Pre-primary education expenditure Early school
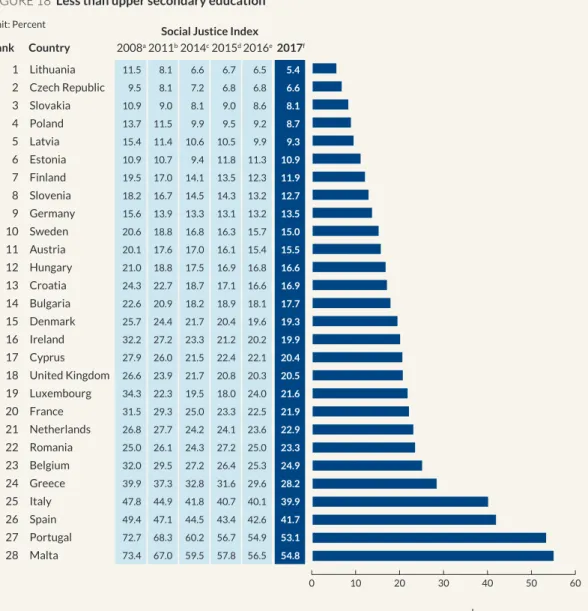
leavers Less than upper
secondary education PISA results
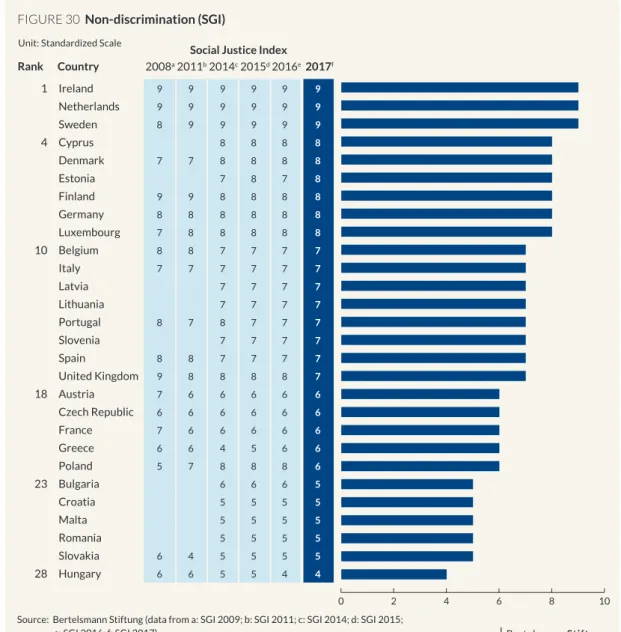
Social inclusion policy (qualitative) Gini coefficient Non-discrimination
policy (qualitative) Gender equality
in parliaments Integration policy
(qualitative) NEET Less than upper
secondary education foreign-born/
native-born Discrimination against people with
disabilities
Health policy (qualitative) Self-reported unmet needs for
medical help Healthy life expectancy Health system
accessibility and range Health system
outcomes
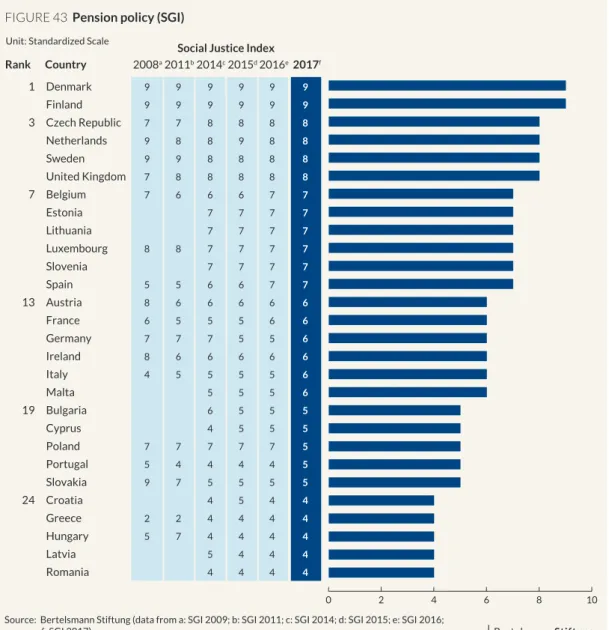
Family policy (qualitative) Pension policy
(qualitative) Environmental
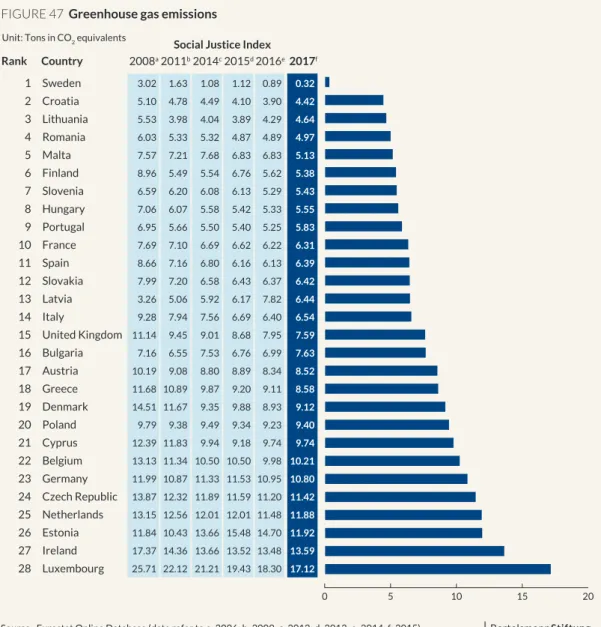
policy (qualitative) Greenhouse gas
emissions Renewable
energy Research and development
spending Public debt
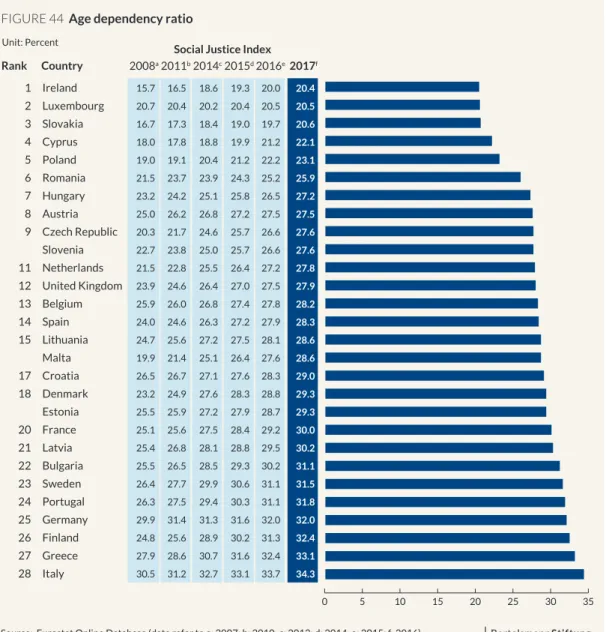
Age dependency
Source: Own representation.
in Denmark, Finland and the Czech Republic – the three best-scoring countries in the area of poverty prevention – the corresponding shares are only between 16.7% and 13.3%.
For certain societal groups such as children and youth, the risk of poverty and social exclusion remains significantly higher; indeed, 26.5% of children and youth EU-wide are at risk of poverty and social exclusion. In countries such as Greece and Spain, this rate remains very high, with the countries showing respective ratios of 37.5% and 32.9%. It is particularly alarming that in Greece, the share of children suffering from severe material deprivation has even risen again, to a current level of 26.7%. This share has thus almost tripled since 2007 (9.7%).
Material deprivation means that the people affected are undergoing conditions of severe hardship, and can no longer afford fundamental necessities of daily life (for example, an adequately heated apartment or a telephone). In the other cri- sis-struck southern European countries, by contrast, the rate of severe material deprivation among children has again fallen slightly. Thus, these countries follow the overall trend for this important indicator: EU-wide, the rate of material depri- vation among children and youth has now fallen from its peak in 2012 (11.8%) to a current rate of 8.6%.
There remains a very large gap between young and old, with the share of children and youth suffering under so-called severe material deprivation being signifi- cantly higher as a cross-EU average than the corresponding share among the older population. The difference is a full three percentage points (8.6% as com- pared to 5.4%). However, in comparison to the previous year, the gap between the generations has become somewhat smaller, after increasing significantly in the course of the crisis. This latter effect was due to the fact that in most countries, pensions and old-age provisions for older people did not fall as significantly as the incomes of the younger population. Now, since younger people are clearly benefiting slightly from the better labor market and economic situation, the dis- tance between old and young is shrinking somewhat.
The fact that the situation for younger people has again improved somewhat can be deduced from the so-called NEET rate as well as from the falling youth-unem- ployment trends. This indicator (NEET stands for “not in education, employment or training”) offers a particularly clear reflection of problems in the transition between the education system and the labor market. Young people who are com- pletely outside the labor market and the education system find themselves in a very precarious situation, which radically limits future opportunities for those affected. At a cross-EU average rate of 16.7%, the share of young people between 20 and 24 years of age who are not in school, employment or training is cer- tainly still above the pre-crisis level (2008: 15%), but the overall trend is positive.
Even in the crisis-struck southern European states, the share of young people in this situation has declined – from about 31.3% in 2013 to 23% in Greece today, from 26.3% to 21.2% in Spain, from 27.2% to 19.6% in Croatia, and from 20.6%
to 17.2% in Portugal, all during the same time period. Only Italy shows a rather small decline – here, the NEET rate remains at a startlingly high level of 29.1%.
Thus, Italy retains a clear last place within this indicator. In contrast to the south- ern European countries, the lowest NEET rates can be found in the Netherlands (6.9%), Malta (8.1%) and Denmark (8.5%).
The summary of key indicators addressing opportunities for children and young people, which collectively constitute our sub-index on this topic, clearly reflects the division of countries in the Social Justice Index more generally.1 Here, Den- mark, Slovenia, the Netherlands, Finland and Sweden perform best. At the other end of the spectrum are the southern and southeastern European countries of Spain, Italy, Hungary, Bulgaria and Romania. However, it can be expected that with the continuation of the labor market recovery, the gap between northern and southern Europe will once again shrink, as will differences regarding partic- ipation opportunities both for the overall population and for children and youth specifically.
1 Four key indicators are included in the sub-index presented here: The number of children and youth under 18 that are at risk of poverty or social exclusion; the influence of socioeconomic background on educational outcomes; the rate of early school leavers; and the so-called NEET rate, which captures all young people that are not employed or taking part in any form of education or training. For more details, see the Methodology chapter in the full study, accessible at www.
sgi-network.org.
1 2 3 4 5 6 7 8 9 10 11 12 13 14 15 16 17
18 19 20 21 22 23 24 25 26 27 28
Denmark Slovenia Netherlands Finland Sweden Estonia Germany Austria Luxembourg Poland Czech Republic Croatia Latvia Lithuania United Kingdom Ireland Cyprus EU Average Belgium Malta Slovakia Portugal Greece France Spain Italy Hungary Bulgaria Romania
-0.31
+0.35 -0.37 +0.17
+0.84 +0.00 +0.55 +0.59 +0.02
+0.42 -0.38
+0.16
-1.07 +0.98 -0.72 -0.42 -0.27 -0.64 -0.04
0 1 2 3 4 5 6 7 8 9 10
FIGURE 3 Child and youth opportunity index
7.58 7.31 7.18 7.01 7.00 6.77 6.74 6.68 6.54 6.42 6.33 6.32 6.29 6.24 6.22 6.15 6.02 6.02 5.91 5.84 5.81 5.73 5.34 5.25 4.92 4.70 4.66 3.81 3.69 7.26 6.91 6.99 7.07 6.95
6.93 6.87 6.87 6.94 7.11 7.10 7.14 7.29 7.39 7.14 7.28 7.03 7.02 7.32 7.00 7.31 7.35 7.49 6.70 6.50 6.57 5.86 5.86 6.66 6.68 6.70 6.56 6.25 6.54 6.55 6.56 5.99 6.63 6.72 6.52 6.54 5.66 5.90 5.95 6.09 6.25 6.69 6.79 6.69 6.65 6.71 5.71 5.93 6.12 5.25 5.54 5.74 5.91 6.41 6.33 5.41 5.13 5.37 5.61 5.83 6.09 4.84 5.16 5.55 5.71 5.51 6.04 6.15 5.98 5.71 5.63 5.74 5.84 5.65 5.34 5.79 5.88 5.82 5.27 5.29 5.51 5.93 5.90 4.79 4.99 4.86 4.44 4.50 4.72 4.95 5.41 5.78 5.36 4.54 4.88 5.06 5.65 5.22 5.35 5.33 5.23 4.87 3.96 4.15 4.21 4.59 5.24 4.72 4.47 4.59 4.60 4.84 3.88 3.98 4.35 4.80 3.03 3.23 3.32 3.71 3.63 3.55
Change to 2008 2015
2014 2016 2017 2011
Country 2008
Rank Social Justice Index
Source: Own calculations.
Unit: Score
Improvements in education indicators too, but stagnation with regard to intergenerational justice
In the majority of member states, a certain improvement with respect to educa- tional opportunity is evident as compared to previous years’ surveys. For example, the share of young people leaving school before graduating has declined EU-wide in comparison to previous years – from 14.7% in 2008 to 10.7% today. However, countries continue to show significant discrepancies regarding this indicator; for example, while Lithuania and Slovenia have a rate of under 5%, the most recent corresponding values for Malta and Spain remain at nearly 20%. However, the long-term trend remains positive.
The country distribution is also quite heterogeneous with regard to the indica- tor measuring influence of socioeconomic background on educational outcomes.
Here, alongside the Nordic countries of Finland and Denmark, the Baltic countries of Estonia and Latvia are also well positioned, as their educational systems accord children even from socially weak families opportunities equal to those of children from socially better-placed families. Remarkably, however, Cyprus, Spain and Italy also perform well in this regard. However, education quality as measured by students’ PISA results is higher particularly in Finland and Estonia. It is precisely these two countries that demonstrate that justice and quality in the educational system can go hand in hand. By contrast, Bulgaria, the Czech Republic, Hungary and France show the largest shortcomings with regard to the relationship between social background and educational outcomes.
Finally, it must be emphasized that a number of worrisome developments are evi- dent in countries with populist governments. In Hungary, which has seen a series of controversial educational reforms in recent years, the relationship between social background and educational outcomes has grown significantly stronger over the past years. In Poland too, the new right-conservative government has reversed important reforms implemented by its predecessors, which had in pre- vious years contributed to a significant improvement in educational opportunities and educational quality.
The EU is stagnating in the domain of intergenerational justice, both as an overall average as well as in individual countries. This is a worrisome sign with regard to the European Union’s future sustainability, as aging societies mean younger generations will feel the burden of a lack of sustainability and high debt levels more strongly. The share of people who are no longer of working-age and thus are dependent on younger generations has significantly increased in most EU countries.
In addition, the debt levels of many member states, despite minimal improve- ments in the overall EU average between 2013 and 2016, remain very high. The discrepancies within the EU are enormous; while the best-placing Estonia, with a debt-to-GDP ratio of 9.5%, is the only country that can once again boast a single-digit value for the first time since 2010, Greece remains stuck with a record-setting mountain of debt totaling 181.3% of GDP. Nor have the other coun- tries at the lower end of the spectrum – such as Italy, Portugal and Cyprus (all with values over 100% of GDP) – achieved any reduction in their indebtedness in comparison to the previous year. The most significant improvements have been
shown by Germany, which was able to reduce its national debt by 13 percentage points between 2010 and 2016, to 67.7% of GDP. The north-south division of the EU visible throughout this indicator thus gives further cause for concern: Despite improvements in the labor market, the countries marked by crisis have still not managed to reduce the financial burden they are bequeathing to future genera- tions, while the already well-situated countries are having fewer problems with this issue. Factors such as this, along with the already relatively high rates of youth unemployment, increase the probability of emigration among the younger generation’s well-educated ranks (a so-called brain drain), again with negative consequences for the economy and society. The fact that investment in research and development is effectively stagnant in cross-European comparison is thus also problematic. EU countries can prepare for the future only with sustainable, innovative solutions.
In many countries, reforms are also necessary with regard to the future living conditions of older people, as a downward slide looms if no changes are made.
As an overall trend, the rate of old-age poverty has not yet increased. However, Estonia, Latvia, Lithuania and Croatia show just how devastating insufficiently reformed pension systems can be for future developments. All four countries have demonstrated labor market improvements and have emerged from the worst of the crisis; however, each has now been confronted by an extremely high and steadily increasing risk of poverty and social exclusion for the over-65 population.
In Latvia, which brings up the rear in this indicator’s rankings, the share of older people at risk of poverty and social exclusion has risen from 33% in 2011 to 43.1%
today. Nor is Germany, with a corresponding increase from 14.8% in 2010 to 18.3%
today, excluded from this trend. For the future, social-security systems must not only secure the standard of living of today’s elderly, but also better address the increasingly interrupted employment histories of the currently young and middle generations. Otherwise, these individuals will be at greater risk of poverty in old age than is already the case today.
2. A step in the right direction:
The new European Pillar of Social Rights
This year, the EU Commission launched a comprehensive framework for ensuring social justice within all member states in the form of the European Pillar of Social Rights. The document’s focus is on the protection and rights of workers, as well as of population groups that cannot participate in employment. The goal is to harmonize social conditions in the various member states, enable all citizens to participate socially and economically according to their capabilities, and protect all members of the population against poverty and social exclusion. In this way, the EU should be better prepared for the future.
Overall, a multidimensional approach is needed in order to provide for greater equity of participation in Europe. There is quite clearly no panacea here able to solve all problems. Even the new European Pillar of Social Rights cannot do this, as it is initially focused on very general and fundamentally formulated rights and princi- ples. However, the formulation of the pillar is a very important step toward giving member states an obligation to create better social conditions and opportunities.
Given the very different welfare-state systems and concepts in the individual EU member states, each government must find its own, inevitably context-sensitive solutions. The EU Pillar of Social Rights formulates 20 principles that correspond very strongly with the dimensions of our Social Justice Index. Taken together, the individual objectives of the European Pillar and the present index could serve very well as a general orientation aid helping to identify reform necessities in particu- larly important areas. In the promotion of social justice, the following aspects are of particular significance:
Poverty prevention: As outlined above, children and young people in the EU remain disproportionately affected by poverty. With its new Pillar, the EU establishes the right to be protected from poverty as a child, and particularly emphasizes that children within disadvantaged groups are entitled to targeted support in order to improve their prospects. In our previous SJI analyses, young migrants and – even outside the eastern European countries – the chil- dren of the Roma minorities show a particularly striking need for support.
The northern European countries in particular offer a positive example of how child poverty can be quite effectively fought if socially disadvantaged groups receive targeted support through a functioning tax-and-transfer system.
However, both in the 20 principles of the new European Pillar and in our study, it is clear that financial measures are not the only factor for addressing child poverty over the long term. Rather, if sustainable remedy is to be achieved, it is important to invest in equality of opportunity both in the education system and the labor market.
Equitable access to education: Investment in high-quality early-childhood education is a key instrument for providing equal participation opportuni- ties. This idea is also reflected in the Pillar of Social Rights, with affordable, high-quality early-childhood education and care declared to be a right for every child. The EU further emphasizes the right to high-quality education, training and lifelong-learning, which helps lead to success and flexibility in the labor market, and enables people to participate fully in societal life. With regard to the issues addressed in the EU principles, many studies show that integrative school systems, in which students stay together for long periods of time rather than being divided into age-based school classes after only a few years, are a better alternative with regard to individual learning out- comes and educational equity. An additional effective means of providing for greater quality and equity in education can be the targeted employment of highly qualified teachers in high-risk schools, enabling individual support for children with special needs. In general, to minimize the negative influence of socioeconomic background on educational outcomes, it is important that socially weaker families receive targeted support allowing them to invest in good education, for instance through the reduction of fees for preschools and whole-day schools.
Labor market access: Nearly all EU states must take on the challenge of creat- ing incentives for a high employment level, while at the same time facilitating the transition from precarious to secure employment. In this area, the prin- ciples of the EU Pillar of Social Rights are very specific: Governments should be required to support job searchers with individualized, ongoing support, and after 18 months at the latest, perform a detailed analysis jointly with the
affected individuals examining what causes and solutions might personally exist for them. This takes into account the fact that long-term unemployment represents one of the greatest risk factors with regard to poverty. The share of long-term unemployed individuals within the EU population as a whole has improved since 2013, falling from 5.2% to 4.1% today. However, it remains sig- nificantly above the pre-crisis level (2008: 2.6%). The current total comprises almost half of all unemployed people in the EU. With regard to the fight against youth unemployment too, which remains a serious problem particularly in the crisis-struck southern European countries, the EU member states must make greater efforts. This applies to improving vocational training, further reduc- ing the number of early school-leavers, and better facilitating the transition from the education system into the labor market. There is frequently a great discrepancy between the demands of the labor market and the skills made available by the education system. The “youth guarantee” anchored in the new EU Pillar represents one step in the right direction. Improved cross-border labor mobility is also an important factor, which – as required in the EU Pillar of Social Rights – should go along with the right to transfer social-insurance entitlements and the implementation of continuing-education programs.
Furthermore, an efficient cross-border approach is necessary, which should include improved cooperation between national employment agencies and the reduction of bureaucratic hurdles to the mutual recognition of educational and professional qualifications.
Social cohesion and nondiscrimination: Great economic and social inequities not only impair sustainable growth, but also have a negative effect on social cohesion within a society. An effective anti-discrimination legislative regime (and its implementation) is a critical factor in increasing equality of opportu- nity. The EU Pillar of Social Rights addresses this issue at rather general level, but makes clear that everyone has the right to protection against discrimination and unequal treatment, and that opportunities for underrepresented groups should be promoted. Ireland, Sweden and the Netherlands, for example, show model anti-discrimination policies according to the criteria considered in the current study. In addition, a coherent and effective integration and immigra- tion policy is essential given the realities of demographic change. Most EU states are increasingly dependent on immigration in order to compensate for negative economic effects induced by societal aging. Integration policy must thus work toward opportunities for equal access for migrants within labor markets and education systems, while opening effective pathways with regard to issues such as family reunification, the expansion of political-participation opportunities, and naturalization. However, in many places this is threatened by nationalist-populist currents that are gaining strength within individual countries. If the EU countries were to act in solidarity, the large number of refugees could also become a definite opportunity for Europe.
Health: Poor health conditions and health-related inequities generate high social and economic costs. Public health measures must thus aim at achieving high-quality health care for the largest possible portion of the population, at the lowest possible cost. In this year’s Social Justice Index, Sweden, Germany, Luxembourg and the Netherlands perform best overall in this regard. In addi- tion to political measures to create equitable access opportunities, an addi- tional focus should be placed on the aspect of prevention. If effective health
care is achieved, health care systems will see significant financial relief and individual health statuses will improve. Overall, it must be borne in mind that opportunities for societal and economic participation are not limited only by structural inequities within a health care system, but also by individual health statuses, which depend in turn on the factor of healthy or unhealthy lifestyles.
Intergenerational justice: Against the background of the present survey, var- ious policy measures promoting intergenerational justice can be grouped, including improved opportunities for families through investment in the child-care infrastructure, reduction of the public debt, and the expansion of the renewable-energy share. The Nordic states in particular stand out with regard to intergenerationally just policy activity, with policy strategies that support young people and families with exemplary preschool, whole-day school and flexible parental-leave offerings. Their successful approach to combining parenting and working life thus offers a model for political reform in other countries.
The dimensions and political fields of activity for strengthening social justice described here are correlated with one another, and indeed are often mutually interdependent. Poor educational opportunities, for example, lead to impaired labor market prospects, and thus also less opportunity to earn a higher income.
Parents with low incomes can in turn invest less in the education of their children – with the subsequent danger of a vicious circle emerging. This is why it is so important that EU member states and EU institutions take a holistic look at the causes of social injustice, its effects, and opportunities for political intervention on the issue. This is now happening with the new European Pillar of Social Rights, and it is to be hoped that the member states regard the goals formulated in this document as a binding standard for their policy. Because one thing is certain:
Material prosperity and economic performance alone are not sufficient to produce social justice, as the distribution of countries in the following two graphics clearly shows.
FIGURE 4 Social Justice 2017 and GDP per capita 2016
Unit: Social Justice Index score / GDP per capita, PPP
Social Justice Index 2017
GDP per Capita 2016 8
7
6
5
4
Czech Republic Slovenia
Finland DenmarkSweden
France
Belgium
Greece Romania Bulgaria
Cyprus Estonia
Slovakia
Malta Poland
Lithuania
Spain Italy Portugal
Hungary Letvia Croatia
United Kingdom
Austria
Ireland Netherlands
Germany
FIGURE 5 Social Justice 2008 and GDP per capita 2007
Unit: Social Justice Index score / GDP per capita, PPP
Social Justice Index 2008
GDP per Capita 2007 8
7
6
5
4
Czech Republic
Finland Sweden
Denmark
France
Belgium
Greece Slovakia
Poland
Spain Italy Portugal
Hungary
United Kingdom Austria
Ireland Netherlands
Germany
20,000 30,000 40,000 50,000 60,000
20,000 30,000 40,000 50,000 60,000
Source: Own calculations.
Source: Own calculations.
1. Poverty prevention
The most recent Eurostat data suggests that the Czech Republic, Finland, Denmark and the Netherlands – countries where “only” 13.3 to 16.7% of the population is at risk of poverty or social exclusion – continue to demonstrate the most success in preventing poverty. In the EU overall, the percentage of those at risk of poverty and social exclusion has fallen once again and stands at 23.4%. However, Greece, Romania and Bulgaria, the EU’s three worst-performing countries in this regard, register a whopping 35.6% to 40.4%.
In Greece, the risk of poverty and social exclusion has remained stubbornly high at 35.6% since 2013. This fact underscores the ongoing dramatic state of social affairs in the country. In Spain, where far-reaching structural reforms have yielded improvements in some economic indicators, the percentage of those at risk of poverty and social exclusion has, according to the most recently avail- able Eurostat data, been reduced to 27.9% after having peaked at 29.2% in 2014.
However, pre-crisis values of 23.3% in 2007 are still far out of reach. The country experts for Spain assess the latest developments as follows: “Those at a higher risk of marginalization include immigrants, unemployed youth and elderly people with minimal pensions. Particularly serious is the child-poverty rate of nearly 30%, according to different reports published by the Council of Europe’s Com- missioner for Human Rights or the Spanish statistical authority (INE). Women (in particular those in precarious employment and heading a single-parent family) are more vulnerable than men. Finally, the share of employed people living under the poverty threshold is also very high, one of the worst cases in the EU. Two back-to-back recessions (2008 – 2009 and 2010 – 2013) further impoverished vulnerable households and broadened the gap between the poorest and wealth- iest sectors of the population (…) The combined impact of economic difficulties ( rising unemployment rates along with cuts in salaries and benefits) and austerity measures (affecting health care, education, social services and disabled-person support programs) have exacerbated marginalization. The National Action Plan on Social Inclusion for the 2013 – 2016 period has clearly proved insufficient, and privately run social organizations have been unable to fill the service-provision gap.”2
Sweden registers the most dramatic increase in the overall risk of poverty and social exclusion compared to previous years (2007: 13.9%; 2015: 16%; 2016:
2 Molina, Ferret, and Colino (2017), available at www.sgi-network.org.
II. Dimensions of social justice: empirical
findings 2017
18.3%). The country experts highlight the most recent challenges facing the Swedish welfare state: “If we compare Sweden with other countries, we find that recent developments challenge the country’s historical position as a leader in the public provision of welfare through wealth redistribution and as a country with extremely low levels of poverty. Together, the data and recent developments sug- gest that Sweden is gradually losing its leading role in these respects and is today largely at par with other European countries in terms of its poverty levels and income distribution.”3
Developments in Poland show, by contrast, the most positive trend in this regard.
Indeed, Poland stands out as an exception within the EU, as the risk of poverty and social exclusion has fallen steadily from 34.4% in 2007 to its current rate of 21.9%. The country experts credit both the current and the previous government
3 Pierre, Jochem and Jahn (2017), available at www.sgi-network.org.
1 2 3 4 5 6 7 8 9 10 11 12 13 14 15
16 17 18 19 20 21 22
24 25 26 27 28
Czech Republic Finland Denmark Netherlands Austria Slovakia France Sweden Slovenia Luxembourg Germany Malta Belgium Poland United Kingdom EU Average Estonia Portugal Ireland Hungary Cyprus Spain Croatia Latvia Italy Lithuania Greece Romania Bulgaria
+0.43 +0.14 -0.21 -0.17 -0.38 +0.71 +0.31 -0.50
-0.62 +0.14
+0.12 +2.61 -0.21
-0.38 -0.69 +0.28
-1.26
-0.64 -1.75
0 1 2 3 4 5 6 7 8 9 10
FIGURE 6 Poverty prevention
7.81 7.03 7.00 6.98 6.70 6.67 6.65 6.62 6.60 6.58 6.29 6.20 6.06 5.77 5.70 5.33 5.18 5.01 4.80 4.73 4.40 4.35 4.21 4.21 4.16 3.83 2.53 1.77 1.39 7.22 7.55 7.50 7.45 7.64 6.84 6.96 7.17 6.86 6.98 6.98 6.62 6.62 6.72 6.77 7.24 7.38 7.19 7.05 7.07 7.00 6.48 6.51 6.41 6.62 5.89 6.08 6.27 6.60 6.60 6.46 6.41 6.67 6.58 6.77 7.67 7.41 7.07 6.96 7.17 6.13 6.13 6.41 7.19 6.91 6.46 6.46 6.58 6.08 6.29 6.15 6.08 6.22 5.27 5.32 5.65 5.84 6.03 6.03 5.94 5.96 2.81 4.37 4.85 5.11 5.42 5.61 5.46 5.09 5.25 5.39 5.89 5.87 4.97 5.06 5.22 5.39 4.80 5.23 5.04 4.97 4.45 4.45 4.66 5.49 4.49 3.88 4.40 4.80 4.00 3.88 2.72 3.43 4.28 4.37 4.47 4.11 5.44 4.78 4.49 4.04 4.19 3.88 4.02 4.07 2.65 3.21 3.64 4.80 5.04 4.21 4.26 4.16 3.66 4.49 4.02 4.26 4.40 2.50 2.43 2.50 1.04 1.41 2.10 1.00 1.46 1.18
Change to 2008 2015
2014 2016 2017 2011
Country 2008
Rank Social Justice Index
Source: Own calculations.
Unit: Score
for these improvements: “Social inequalities have visibly declined since the early 2000s. This has partly been due to Poland’s strong economic performance and the EU structural funds which were predominantly aimed at helping less-developed regions and relatively poor households. In addition, previous governments have been successful in mitigating regional disparities through regional-development policies. Moreover, government policies have helped improve families’ financial conditions, especially those suffering from poverty, and have increased average educational attainments. The most dramatic pockets of poverty have shrunk, and income inequality has fallen substantially since the early 2000s. In-depth sociological studies have shown that poverty in Poland is not inherited across generations. Still, the PiS was able to capitalize on looming popular dissatisfaction with social inclusion in the country. By raising family allowances and increasing the minimum wage, the PiS government has contributed to a further decline in social inequality.”4
4 Matthes, Markowski, and Bönker (2017), available at www.sgi-network.org.
1 2 3 4 5 6 7 8 9 10 11 12 13 14 15 16 17 18 19 20 21 22 23 24 25 26 27 28
Czech Republic Finland Denmark Netherlands Austria Slovakia France Sweden Slovenia Luxembourg Germany Malta Belgium Poland United Kingdom Estonia Portugal Ireland Hungary Cyprus Spain Croatia Latvia Italy Lithuania Greece Romania Bulgaria
2015d
2014c 2016e2017f 2011b
2008a
FIGURE 7 At risk of poverty or social exclusion, total population
Source: Eurostat Online Database (data refer to a: 2007 or 2010; b: 2010; c: 2013; d: 2014; e: 2015;
f: 2015 or 2016).
13.3 16.6 16.7 16.8 18.0 18.1 18.2 18.3 18.4 18.5 19.7 20.1 20.7 21.9 22.2 24.4 25.1 26.0 26.3 27.7 27.9 28.5 28.5 28.7 30.1 35.6 38.8 40.4 15.8 14.4 14.6 14.8 14.0 17.4 16.9 16.0 17.3 16.8 16.8 18.3 18.3 17.9 17.7 15.7 15.1 15.9 16.5 16.4 16.7 18.9 18.8 19.2 18.3 21.4 20.6 19.8 18.4 18.4 19.0 19.2 18.1 18.5 17.7 13.9 15.0 16.4 16.9 16.0 17.1 18.3 20.4 20.4 19.2 15.9 17.1 19.0 19.0 18.5 20.6 19.7 20.3 20.6 20.0 19.7 21.2 24.0 23.8 22.4 21.6 20.8 20.8 21.2 21.1 34.4 27.8 25.8 24.7 23.4 22.6 23.2 24.8 24.1 23.5 22.0 21.7 23.5 26.0 24.2 25.0 25.3 27.5 27.5 26.6 23.1 27.3 29.9 27.7 26.0 29.4 29.9 34.8 31.8 28.2 25.2 24.6 27.8 27.4 28.9 23.3 26.1 27.3 29.2 28.6 31.1 31.1 29.9 29.3 29.1 35.1 38.2 35.1 32.7 30.9 26.0 25.0 28.5 28.3 28.7 28.7 34.0 30.8 27.3 29.3 28.3 27.7 35.7 36.0 35.7 47.0 41.5 41.9 40.3 37.4 60.7 49.2 48.0 40.1 41.3
0 10 20 30 40 50
Country Rank
Social Justice Index Unit: Percent
In sharp contrast to Poland and despite its excellent labor market performance, Germany has in recent years made little headway in mitigating the risk of poverty and social, as some 19.7% of the total population is currently at risk of poverty or social exclusion (2013: 20.3%).
1 2 3 4 5 6 7 8 9 10 11 12 13 14 15 16 17 18
20 21 22 23 24 25 26 27 28
Denmark Finland Slovenia Czech Republic Netherlands Germany Sweden Austria Estonia Belgium France Luxembourg Malta Poland Slovakia Latvia Portugal Croatia United Kingdom Ireland Cyprus Lithuania Spain Italy Hungary Greece Bulgaria Romania
FIGURE 8 At risk of poverty or social exclusion, children (0-17)
Source: Eurostat Online Database (data refer to a: 2007 or 2010; b: 2010; c: 2013; d: 2014; e: 2015;
f: 2015 or 2016).
13.8 14.7 14.9 17.4 17.5 19.3 19.9 20.0 21.2 21.6 22.6 23.0 24.0 24.2 24.4 24.7 27.0 27.2 27.2 28.8 29.6 32.4 32.9 33.5 33.6 37.5 45.6 49.2 14.2 15.1 15.4 14.5 15.7 15.1 14.2 13.0 15.6 14.9 14.7 15.2 17.5 17.7 16.6 21.5 18.9 16.4 19.5 18.5 17.2 16.9 17.0 17.1 16.8 19.7 21.7 19.4 19.6 18.5 14.9 14.5 16.2 16.7 14.0 18.5 22.4 22.9 23.3 22.3 20.1 24.0 22.3 23.8 22.5 21.6 23.2 21.9 23.2 23.3 19.6 22.9 20.8 21.6 21.2 21.2 22.3 26.0 26.4 23.0 23.9 26.7 32.0 31.3 28.2 37.1 30.8 29.8 28.2 26.6 25.8 25.3 25.5 23.6 24.9 32.8 42.2 38.4 35.3 31.3 26.9 28.7 31.7 31.4 29.6 29.4 29.4 29.3 29.0 28.2 27.6 29.7 32.6 31.2 30.3 26.2 34.1 34.4 30.4 28.8 20.8 21.8 27.7 24.7 28.9 29.9 35.8 35.4 28.9 32.7 28.6 33.3 32.6 35.8 34.4 28.6 29.5 32.0 32.1 33.5 34.1 38.7 43.9 41.8 36.1 28.2 28.7 38.1 36.7 37.8 60.8 49.8 51.5 45.2 43.7 51.8 48.1 51.4 50.7 46.8
0 10 20 30 40 50
2015d
2014c 2016e2017f 2011b
2008a Country
Rank
Social Justice Index Unit: Percent
Of particular concern is the fact that the risk of poverty among children and youth is significantly higher than that for the total population in the EU. While the EU average for the risk of poverty and social exclusion among the total population is 23.4%, the EU average for children and youth at risk of poverty and social exclu- sion – though it has declined somewhat – remains alarmingly high at 26.5%. In most southern European crisis countries, we’ve observed as slight reduction in this rate. For example, in Spain, the share of children and youth at risk of poverty and social exclusion currently stands at 32.9% as compared to 34.4% in 2015.
Slight reductions have also been recorded in Greece (2015: 37.8%; 2016: 37.5%) and Portugal (2015: 29.6%; 2016: 27%).
In the countries with the best rates for this indicator – Finland, Denmark, and Slovenia – trends are mixed. We see positive changes since the economic and financial crisis in Denmark (2016: 13.8%; 2013: 15.4%) and Slovenia (2016: 14.9%;
2013: 17.5%). In Finland, however, we see an increase in the poverty rate among children from 13% (2013) to 15.6% (2014), with most recent figures showing only modest improvements (2016: 14.7%). Sweden, on the other hand, significantly dropped in the ranking, featuring a 19.9% risk of poverty and social exclusion among children and youth as compared to 14% in the previous year. Despite its excellent labor market performance since the crisis, Germany has also failed to bring about any major reduction in child poverty and has actually seen its rate increase from 18.5% in 2015 to a current 19.3%. As is the case in many other EU states, there are, however, profound regional differences with regard to poverty rates for children in Germany. Children in single-parent households, for example, are disproportionately affected by poverty and social exclusion.
Also worth noting is the fact that stark generational imbalances – an issue addressed in previous SJI editions – persist: figures for the risk of poverty and social exclusion among the 65+ generation are, once again, far lower than those for children and youth.
Whereas an average of 17.7% of senior citizens EU-wide are at risk of poverty and social exclusion, 26.5% of children and youth across the EU are at risk. This can be accounted for in part by the fact that throughout the crisis, pensions in most countries have not shrunk as much as incomes among younger generations. This is most vivid in the case of Spain, where the share of children and youth at risk of poverty and social exclusion is still more than two times higher than that of senior citizens. On this latter point, Spain is even doing relatively well in compar- ative terms; the country is at 14.4%. In several countries, therefore, intra-familial redistribution and cross-generational support again play an increasingly import- ant role in the overall national welfare mix. In direct comparison to the 2015 data, however, the EU average risk of poverty for children and youth declined slightly, while the average for seniors indeed rose. If we look exclusively at the aspect of relative income poverty among senior citizens, Spain features a rate (13%) lower than countries such as Sweden (16.8%), Germany (17.6%) and Slovenia (17.6%).
However, there are also notable exceptions among the EU countries, where old- age poverty is an even more pressing issue than child poverty. Croatia, in addi- tion to the Baltic states of Estonia, Latvia and Lithuania shows the most dramatic results – all four of them are at the bottom of the 2016 evaluation as they feature a larger percentage that is at risk of poverty both compared to the previous year and to 2013. Croatia, with its current old-age poverty rate (income poverty) of 27%, features a pension politics that is representative of these four countries, as described by the country experts: “Like some other East-Central European coun- tries, Croatia introduced a three-pillar pension system with a mandatory second pillar in the late 1990s. The average effective replacement rate for pensions is around 40%, partially due to the fact that many pensioners retire early. As a result, pensioner poverty is rather high in Croatia. The rules for calculating benefits are generally equitable. However, war veterans enjoy strong privileges, and inequal- ities between cohorts have been introduced through irregular supplements that have reflected the electoral cycle. As a consequence of the aging of the population, the low general employment rate and the decline in the effective retirement age,
the system is neither fiscally sustainable nor intergenerationally fair. The public pension fund has shown a persistent deficit, which represents a significant risk to the stability of the system.”5
In Estonia, today more than one-third (2016: 40.2%; 2015: 35.8%; 2013: 24.4%) of persons aged 65 or over are at the risk of poverty, which marks a dramatic increase from the previous year. Estonia thus registers by far the worst results in the EU when it comes to old-age poverty. The Estonia country experts explain: “Old-age pension benefits are indexed, which guarantees slight annual increases based on social tax revenues and the cost of living. In 2016, this indexation resulted in an average pension-payment increase of 5.7%. Due to the low absolute level of ben- efits (€396 per month), elderly people still struggle to make ends meet. Because
5 Petak, Bartlett, and Bönker (2017), available at www.sgi-network.org.
1 2 3 4
6 7 8 9 10 11 12 13 14 15 16 17
19 20 21 22 23 24 25 26 27 28
Luxembourg Denmark France Czech Republic Netherlands Slov