Development of a frit free SPE based in column prconcentration system for capillary electrophoresis / C Barbas [et al ]
6
0
0
Texto completo
(2) 472. L. Saavedra et al. / Journal of Pharmaceutical and Biomedical Analysis 44 (2007) 471–476. 2001, Guzman and Stubbs reviewed the online sample preconcentration and microreactions in capillary electrophoresis using selective adsorbents based on chemical or biological specificity [8]. Recently our group has updated these reviews with the last developments in the area [9]. From this work it can be concluded that only four articles in the recent literature handle small organic molecule preconcentration with SPE–CE mechanisms and only for standards [10–13]. In our experience retaining frits configurations could be problematic depending on the resolution needed. The appearance of backpressure into the system makes the use of an external pressure source a must in order to get positive movement of the BGE inside the capillary. Otherwise electric field driving force might not be sufficient to overcome the backpressure resistance. In that cases the parabolic flow profile, typical from hydrodynamicdriven separations, yields to a general peak broaden that leads to an efficiency loss. 3-Nitrotyrosine in urine is a non-invasive marker for oxidative stress [14]. Due to its potential significance several analytical methods have been described for the determination of 3-nitrotyrosine alone or bound to proteins [15,16]. These methods have to overcome the important limitation that the low concentration in which this analyte is usually found in such complex matrices brings about. A capillary electrophoresis (CE) method was developed for nitrated and chlorinated aromatic aminoacids, as well as their parent compounds, employing largevolume sample stacking, but only for standards [17]. Our group developed a capillary electrophoresis method that permitted 3nitrotyrosine measurement in urine of diabetic rats without any other sample pre-treatment more than dilution with acetonitrile and centrifugation. It employed the large-volume sample stacking pre-concentration technique using the EOF pump to increase sensitivity [18]. Nevertheless, the complexity of the profile made desirable a cleaning step simultaneous to the preconcentration. Therefore the aim of this work was to develop an in-line frit free preconcentration device for capillary electrophoresis and to apply it to 3-nitrotyrosine measurement in rat urine. 2. Materials and methods 2.1. Chemicals Unless otherwise indicated all the chemicals used in these experiments were purchased from Sigma (St. Louis, MO, USA). o-Phosphoric acid (85%) was from Merck (Darmstadt, Germany). Sodium hydroxide was from Panreac (Madrid, Spain). HPLC quality acetonitrile was from Scharlab (Barcelona, Spain). Acetic acid was from Prolabo-MERKeurolab (Fontenay, France). Ultrapure water was obtained with a Milli-Q Plus System from Millipore (Bedford, MA, USA).. AZ, USA). The 30 and 60 m MCX beads were obtained from the corresponding Waters OASIS® MCX SPE cartridges. A subsequent particle size selection was made manually by using 50 and/or 100 m sieves. The 360 m i.d. plastic sleeve was from SCI (Lake Havasu City, USA). The separation BGE consisted in 150 mM phosphate buffer adjusted to pH 7.4 with NaOH. The elution BGE consisted in 80/20 (v/v) phosphate buffer/acetonitrile, being the buffer 220 mM phosphate adjusted to pH 7.4 with NaOH. The rinsing solvent was phosphoric acid 250 mM in water. The composition for all the buffers employed was optimised to match the separation BGE conductivity in order to minimize current variations along the separation process. The total capillary length was 60 cm and the effective capillary length was 45.5 cm measured from the preconcentrator to the capillary window. The voltage applied was +25 kV and the system was kept at 25 ◦ C. A positive pressure from the inlet to the outlet of 0.5 psi was applied during the separation. Samples were injected hydrodynamically at 10 psi for the desired period of time. The detection system allowed the collection of all wavelengths ranging from 200 and 500 nm. Between injections the built-in preconcentrator was regenerated by flushing subsequently elution BGE, rinsing solvent and water, all of them for 5 min at 10 psi. 2.3. Preconcentrator assembly The procedure described below has been optimised for the dimensions of the Beckman P/ACE MDQ capillary electrophoresis cartridge. Nevertheless, the position of the preconcentrator and all the subsequent operating procedures can be adapted to any other cartridge configuration. The preconcentrator was assembled by using fragments of capillaries with different internal diameters. The preconcentration chamber consisted in a piece of capillary of 150 m i.d. and about 0.5 cm long. It was cut using a diamond-on-a-wheel based cutter for capillaries from Agilent Technologies. Attached to this was assembled a 50 or 75 m i.d. and 4.7 cm long piece of capillary using a plastic micro tube of 360 m i.d. The SPE beads were packed into the preconcentration chamber using a vacuum pump. Because of the capillaries internal diameters and the size of the beads used the packing material remains only in the 150 m i.d. piece of capillary without trespassing beyond the connection point. Finally, the rest of the capillary (e.g. 50 or 75 m i.d. and 55 cm to make a ∼60 cm total length capillary) was assembled on the other tip of the preconcentration chamber using the same 360 m i.d. plastic micro tube. This configuration was built inside of a Beckman P/ACE MDQ capillary cartridge so that the preconcentrator stays inside the cartridge leaving the capillary tips unmodified for the proper operation of the instrumentation. Fig. 1 shows the aspect, under the microscope, of the preconcentrator once it has been set up.. 2.2. Instrumentation 3. Results and discussion CE experiments were carried out in a Beckman P/ACE MDQ capillary electrophoresis system equipped with PDA (photo diode array) detector. 150 m and 75 m internal diameter fused silica capillaries were from Polymicro Technologies (Phoenix,. SPE-based preconcentrators lay its selectivity on the different affinity of the analytes between two phases, regardless the concrete mechanism in each case (SAX, SCX, mixed modes.
(3) L. Saavedra et al. / Journal of Pharmaceutical and Biomedical Analysis 44 (2007) 471–476. 473. Fig. 1. Picture of the preconcentrator under 4× optic microscope. The preconcentration chamber houses the packed beads (30 m average size in this case). The rest of the electrophoretic capillary, with noticeable lower internal diameter, extends towards both sides of the preconcentrator allowing the immobilization of the beads without the need of retaining frits in the system.. or C18). These transitions are governed by the corresponding equilibrium constants so that the higher the constant is the more efficient the peak will be due to the quick desorption from the SPE sorbent to the separation buffer or solvent. Otherwise a poor efficient desorption step might yield to peak fronting or tailing and a general Gaussian shape loss. This last factor is intrinsic to each analyte–sorbent–solvent combo and it is not necessarily a problem but in our experience it is something to count with and, of course, one the parameters to be optimised. The selection of the type of solid phase particles was developed off line, taking always into consideration the employment of stationary phases with different selectivity to the CE method. The retention of 3-nitrotyrosine, highly polar, spiked at low concentration in urine was a challenge mainly when trying to increase the volume of sample added to the cartridge to increase the preconcentration. A second factor to consider was the availability of the adequate particle size. After testing several SPE phases and from different manufacturers, a strong cationic exchanger (previously described) provided the best results. MCX Waters OASIS® beads have a composition that is hydrophilic–lipophilic-balanced for both strong reversedphase retention and cationic exchange. As nitrotyrosine is an aminoacid derivative, it can show either positive or negative charge, depending on the pH, and therefore the sample would be charged in acidic media, but the CE separation was developed afterwards at higher pH towards the positive end (normal polarity) to increase selectivity. 3.1. Optimization of experimental conditions The dual mechanism of interaction of this particular sorbent requires the use of elution solvents that work over both retention mechanisms. Table 1 gathers the pKa values and molecular structure for 3-nitrotyrosine. In a first stage a single connection configuration, both with and without frits, with a plug length of packing material ranging from 2 to 4 cm was tested. The capillary set up consisted in a ∼8.5 cm and 150 m i.d. capillary fragment, in which the SPE. beads have been previously packed, attached to a 51 cm long and 50 or 75 m i.d. bare capillary to make a total capillary length of 60 cm. The connection between fragments was done by using a 360 m i.d. plastic micro tube that can house the regular 365 m e.d. capillaries without comfort. The optimization of the preconcentration procedure was carried out with a 0.1 mg/mL standard solution of 3-nitrotyrosine prepared freshly from a stock solution of 1 mg/mL. Working pH was set at 2.0 to avoid a premature desorption from the preconcentrator during the capillary fill up step. Sample was loaded into the capillary for the desired time and was eluted afterwards with a small injection of 200 mM sodium citrate pH 6.4 and methanol (1:1). The elution solvent composition was previously optimised in our lab. After the separation process, done in sodium phosphate 150 mM pH 2.0 at 20 kV and 1 psi as additional pressure to overcome the backpressure generated by the preconcentrator, a peak corresponding to 3-nitrotyrosine was obtained. Nevertheless, the system did not meet the expectations yielding performance inconvenients such as (i) excessive backpressure generation into the capillary which virtually makes the EOF to be null, (ii) air bubbles generation in the preconcentrator due to superficial tension phenomena when solvents and packed material get in touch, and (iii) chromatographic, and not electrophoretic, peak shape is obtained resulting in broader and tailed peaks so that peak capacity is dramatically reduced. These problems were tackled in a second stage by constructing a preconcentrator set up as described in Section 2 (see Fig. 1). In this new configuration the length of the preconcentrator has been dramatically reduced. This requires less elution solvent providing better desorption performance and higher efficiencies. On the other hand load capacity, and so the preconcentration capability, is subsequently reduced. In addition, the backpressure generated into the system is despicable allowing the generation of an electrodriven buffer movement inside the capillary (EOF). Moreover, as a consequence of this new sandwich-type configuration as well as for the particle size/internal diameter combination used the SPE packed material remain unmovable regardless the direction of the flow. This. Table 1 pKa values and molecular structures for 3-nitrotyrosine Name. Mw. pKa. 3-Nitro-l-tyrosine. 226.2. 2.20 7.20 9.11. Structure.
(4) 474. L. Saavedra et al. / Journal of Pharmaceutical and Biomedical Analysis 44 (2007) 471–476. Fig. 2. Schematic representation of the PFT-based procedure developed for the 3-nitrotyrosine preconcentration. The capillary is rinsed with the sample for the desired period of time at 10 psi. Secondly the sample matrix is removed from the capillary by rinsing with the wash solvent. Thirdly the separation BGE is introduced in reverse direction until the preconcentrator position. Fourthly a small amount of elution solvent is introduced into the capillary while applying voltage. Finally a new separation BGE vial replaces the elution one at the inlet tip to carry on with the separation.. feature allowed the used of the partial filling technique (PFT) which has been widely employed in CE to control the fill of the capillary up to a certain point mainly in chiral analysis to avoid the chiral selector to pass through the detection window [19–21] or in CE–MS coupling to avoid undesired substances to come into the ionisation chamber [22]. In this case the use of PFT allowed us to use a slightly alkaline buffer to achieve the separation avoiding partial or total analyte loss from the OASIS® MCX sorbent during the rinse step. The optimised procedure is described as follows: (i) once the capillary is set on the CE system it is rinsed with the sample for the desired time and pressure. In this step the preconcentrator retains the target analytes with the dual mechanism previously described. This step may take several minutes; (ii) the capillary is rinsed with an aqueous solution of phosphoric acid 250 mM in order to move the remaining sample through the waste. Because of the low pH of this solution analytes are not released from the preconcentrator; (iii) separation buffer, consisting in sodium phosphate 150 mM pH 7.4, is introduced into the capillary in reverse direction, that is, from the outlet towards the inlet. This process is stopped just before the buffer reaches the preconcentrator. The time needed for this rinse is calculated experimentally and will be discussed later on in this paper; (iv) a small amount of elution buffer, consisting in sodium phosphate 220 mM pH 7.4 and mixed with acetonitrile afterwards (80:20), is introduced into the capillary by applying the separation voltage (+25 kV) plus 0.5 psi of additional pressure for 1 min. The composition of this buffer has been designed to have an effect on both retention mechanisms; (v) finally, the inlet vial containing the elution buffer is replaced for another one containing BGE and the separation process goes on as normal. During the separation time the short plug of elution buffer introduced into the capillary moves towards the outlet as a consequence of the EOF generated into the system. At the time it reaches the preconcentrator the analytes will be released and separated electrophoretically in the rest of the capillary. Fig. 2 shows schematically the fol-. lowed procedure. The composition and concentration of all the solvents in these steps have been optimised so that they have the same conductivity in order to have the current stabilized during the separation. Linear response, in terms of area against injection time, has been demonstrated with this methodology for 3-nitrotyrosine standards up to 30 min injection at 10 psi using a 1 g/mL solution. Longer injection times were also assayed but they deviated from the tendency achieved for lower times. Table 2 summarizes the data collected from these experiments. 3.2. Partial filling technique calculations The correct use of the PFT requires of the control of fluid dynamics inside the capillary. When it comes to hollow open tubular structures that is not an issue and most informatic applications, like the Beckman’s CEexpert® [23], provide exact calculations in a simple way. In the experiments described in this paper these kind of theoretical calculation are not possible as the capillary is built from pieces of different internal diameter and the particles packed into it might produce certain degree of backpressure making these estimations just useless. An experimental procedure to calculate the time needed for introducing the BGE up to the desired point has been developed instead. Having the capillary mounted in the CE system it is filled with water. Then a small amount acetic acid solution is injected and pushed by pressure at 10 psi exclusively. Once the peak has been Table 2 Experimental data obtained for 3-nitrotyrosine 1 g/mL at different injection times using the SPE-based in-capillary preconcentrator Injection time (min). Migration time (min). Area (AU). 5 15 30. 12.6 12.0 11.6 R.S.D. = 4.2%. 175,423 943,958 1,799,491 r2 = 0.993. Data were collected with a PDA detector at 430 nm..
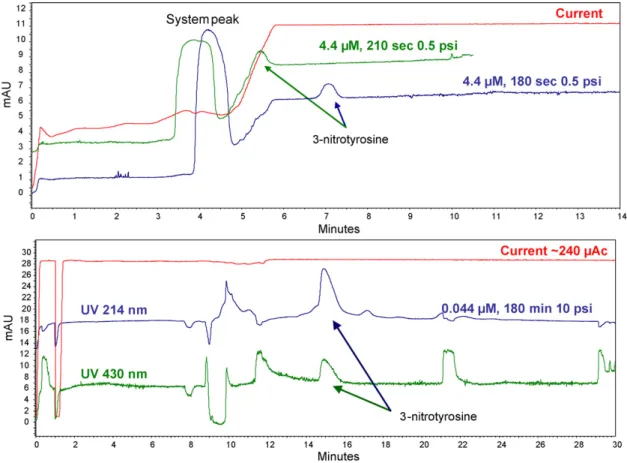
(5) L. Saavedra et al. / Journal of Pharmaceutical and Biomedical Analysis 44 (2007) 471–476. detected and bearing in mind that the distance from the inlet to the detector is 50 cm the linear velocity, expressed in cm/min at 10 psi, can be calculated. Finally, with this experimental data, the precise amount of time for filling the capillary up to the preconcentrator can be calculated as the capillary involved is 55 cm long (see Section 2.3). 3.3. Influence of particle size The Waters OASIS® MCX sorbent is available in two different average particle sizes, 30 and 60 m. Both can be packed into the capillary with no problem whatsoever but different physic characteristics may occur. The smaller the particle size the higher the packing efficiency and the higher the active surface is, providing higher loading capacity for samples. On the other hand smaller particles are more difficult to pack and higher backpressure on the system is observed [9]. 3.4. Preconcentration factor In off-line SPE preconcentration factor is usually calculated dividing the volume of sample or standards before the SPE process by the final volume obtained after the extraction. Exact volume flushed through the capillary is not possible to determine in this in-capillary system mainly because the total empty volume inside the capillary is unknown. Instead of that, a preconcentration factor has been calculated by comparing the. 475. maximum amount of time that can be injected of the most diluted solution that can be detected both in the preconcentrator system and in a hollow comparable capillary. An equivalent but empty capillary was assembled with the same dimensions as the preconcentrator one for this purpose. In this capillary it has been possible to detect a 4.4 M standard of 3-nitrotyrosine injected for 210 s at 0.5 psi, which is about 20% of the total capillary volume. In these conditions the peak is detectable at 214 nm but not quantifiable as it is partially swallowed by a system peak. With the SPE-based in-capillary system detection of a 0.044 M standard solution injected for 180 min at 10 psi was possible. Although the final method with such injection time is long, it works unattended and therefore it is easier than off line preconcentration steps. Detection was performed at 214 nm but sensitivity was good enough to see the peak at 430 nm as well, which produces a much cleaner electropherogram yet less sensitive. Although the amount of analyte introduced into both capillaries is not comparable the in-capillary preconcentration system has been able to measure a 100-fold less concentrated solution of 3-nitrotyrosine. Fig. 3 shows the electropherograms for both conditions. 3.5. Application to urine samples In a later stage, the system was used for the determination of 3-nitrotyrosyne in rat urine. Basal nitrotyrosine was not detectable, the lower level that could be detected was 4.4 M. Fig. 3. Electropherograms corresponding to the maximum injection time of the less concentrated solution that can be detected both in the preconcentrator system (the bottom electropherogram at two different wavelengths) and in a equivalent open tubular capillary (the upper one at 214 nm only)..
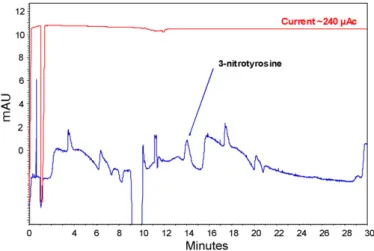
(6) 476. L. Saavedra et al. / Journal of Pharmaceutical and Biomedical Analysis 44 (2007) 471–476. from contaminations or tedious manipulations when the sample amount is an issue. Moreover, the combination can provide 2D separations. References. Fig. 4. Profile obtained for both 3-nitrotyrosine added in rat urine. Injection was at 10 psi for 30 min for the sample. Analysed at +15 kV and 0.5 psi using sodium phosphate 150 mM pH 7.4 as BGE. Detection was at 430 nm. Whole procedure is described in Section 2.. spiked into the urine. This higher value, as compared with pure standards, is due to a lowest injection time (30 min versus 180 min). As the sample matrix compete with the active sites in the SPE particles and saturates them, longer injection times did not provide a higher signal. Fig. 4 shows the electropherograms obtained for a treated sample under the conditions described in Section 2. 4. Conclusions An in-line frit free device has been developed coupling SPE and CE advantages. The device is based in particle and capillaries relative sizes and prevents the appearance of backpressure into the system and bubble formation. Clean up and preconcentration have been shown while preventing samples. [1] D.M. Osbourn, D.J. Weiss, C.E. Lunte, Electrophoresis 21 (2000) 2768–2779. [2] M. Urbanek, L. Krivankova, P. Bocek, Electrophoresis 24 (2003) 466–485. [3] R.L. Chien, Electrophoresis 24 (2003) 486–497. [4] P. Britz-McKibbin, S. Terabe, J. Chromatogr. A 1000 (2003) 917–934. [5] A.R. Timerbaev, T. Hirokawa, Electrophoresis 27 (2006) 323–340. [6] N.A. Guzman, M.A. Trebilcock, J.P. Advis, J. Liq. Chromatogr. 14 (1991) 997–1015. [7] J.R. Veraart, H. Lingeman, U.A. Brinkman, J. Chromatogr. A 856 (1999) 483–514. [8] N.A. Guzman, R.J. Stubbs, Electrophoresis 22 (2001) 3602–3628. [9] L. Saavedra, C. Barbas, J. Biochem. Biophys. Methods, in press. [10] B.M. Simonet, A. Rios, M. Valcarcel, Electrophoresis 25 (2004) 50–56. [11] F.W. Tempels, J. Teeuwsen, I.K. Kyriakou, G. Theodoridis, W.J. Underberg, G.W. Somsen, G.J. de Jong, J. Chromatogr. A 1053 (2004) 263–268. [12] X.Z. Wu, R. Umeda, Anal. Bioanal. Chem. 382 (2005) 848–852. [13] B. Yang, F. Zhang, H. Tian, Y. Guan, J. Chromatogr. A 1117 (2006) 214–218. [14] M. Schwemmer, B. Fink, R. Kockerbauer, E. Bassenge, Clin. Chim. Acta 297 (2000) 207–216. [15] D. Tsikas, A. Mitschke, M.T. Suchy, F.M. Gutzki, D.O. Stichtenoth, J. Chromatogr. B 827 (2005) 146–156. [16] L.F. Marvin, T. Delatour, I. Tavazzi, L.B. Fay, C. Cupp, P.A. Guy, Anal. Chem. 75 (2003) 261–267. [17] T. Tabi, K. Magyar, E. Szoko, Electrophoresis 26 (2005) 1940–1947. [18] N. Maeso, A. Cifuentes, C. Barbas, J. Chromatogr. B 809 (2004) 147– 152. [19] S. Fanali, Z. Aturki, C. Desiderio, A. Bossi, P.G. Righetti, Electrophoresis 19 (1998) 1742–1751. [20] Y. Tanaka, K. Otsuka, S. Terabe, J. Chromatogr. A 875 (2000) 323–330. [21] J. Ruta, C. Ravelet, C. Grosset, J. Fize, A. Ravel, A. Villet, E. Peyrin, Anal. Chem. 78 (2006) 3032–3039. [22] S.A. Shamsi, Electrophoresis 23 (2002) 4036–4051. [23] Beckman Coulter Inc., CE Expert Lite, Available at http://www. beckmancoulter.com/resourcecenter/labresources/ce/ceexpert.asp..
(7)
Figure

Documento similar
On the other hand at Alalakh Level VII and at Mari, which are the sites in the Semitic world with the closest affinities to Minoan Crete, the language used was Old Babylonian,
The aim of the empincal analysis is to measure the length of the vacancy chains generated by a first acquisition in a new development to make it comparable to other empincal
We study the height of a liquid in a tube when it contains a great number of thin vertical bars and when its border is finely strained1. For this, one uses an
No obstante, como esta enfermedad afecta a cada persona de manera diferente, no todas las opciones de cuidado y tratamiento pueden ser apropiadas para cada individuo.. La forma
La consulta d’aquesta tesi queda condicionada a l’acceptació de les següents condicions d'ús: La difusió d’aquesta tesi per mitjà del servei TDX (www.tdx.cat) ha estat
Furthermore, in the SEM, a positive and significant predictive relationship of CM was found on academic engagement and the intention to teach based on a disempowering climate: if
The Dwellers in the Garden of Allah 109... The Dwellers in the Garden of Allah
These users can be common users of the Observatory’s public website (general audience), the graduates involved in the Observatory’s studies, the Spanish universities that
