THE USE OF RUBRICS TO ASSESS COMPETENCES
Fernando González-Andrés
1, Beatriz Urbano López de Meneses
2 1University of León (SPAIN)
2
University of Valladolid (SPAIN)
Abstract
The current teaching and learning process proposed by the Bologna process, requires a new, varied and continuous assessment, based on learning competences. The evaluation of the learning competences must be aligned with the teaching outcomes and requires the participation of all of those involved in the learning process. The present innovation learning project presents an experience in the use of rubrics to assess learning competences in Agricultural Engineering Higher Education. In a first step the competences to assess were collected and criteria and levels of achievement were assigned. Three competences were considered, i) Capacity to analyse and summarise, ii) Ability to communicate both in technical and non-expert forums and iii) Critical thinking. In a second step the digital Rubistar tool was used to create a rubric for the assessment of competences. A rubric matrix of three competences for three stages and three levels of achievement (9x3) were obtained. In a third step the rubric was shared with students at the beginning of the semester using the Moodle on-line teaching platform. In a fourth step the teachers and the students completed a digital survey and scored the achievement of competences, at the end of the semester. The survey was carried out using the Jotform digital tool. A focus group compared the punctuations given by students and teachers. The results of the innovation learning experience shows i) the alignment of the evaluation with the teaching-learning process, ii) the participation of all the involved the evaluation process, iii) the students self-monitoring of their learning process contributing to their teaching responsibility, iv) the students self-evaluation measuring their work quality and possible improvement.
Keywords: Competences in Agricultural Higher Education, Innovation Teaching project, Rubistar, Jotform, Focus Group.
1 INTRODUCTION
The European Higher Education Area (EHEA) learning process, proposed by the Bologna Declaration, is based on a competences model. Therefore, the teaching process, including the evaluation, must be designed and developed according to the competences that the students need to acquire [1]. In this sense, it is required to establish and develop a continuous, varied and formative [2] new evaluation system based on competences [3] and aligned with the expected learning outcomes [4]. This kind of evaluation is scarce by now, being a challenge for EHEA [4]. It is needed to develop a novel assessment tool [5] capable to measure the progress, evolution and acquisition of competences by the students. The evaluation of the learning competences must be aligned with the teaching outcomes and requires the participation of all of those involved in the learning process. In this sense Tejada [6] indicates competences assessment, is one of the most important tasks of the higher education learning process due to its implications and characteristics which evaluates the student ability to respond to situations that could need to face in the future [7]. Many of those requirements can be found in rubric as tool of assessment of progress at teaching environment [8]. A rubric is commonly defined as a tool that articulates the expectations for an assessment by listing criteria, and for each criteria, describing levels of achievement [9].Rubrics can be used for any assessment in a course, or for any way to ask students to demonstrate what they've learned. They can also be used to facilitate self and peer-reviews of student work. When used by students as part of a formative assessment, they can help students to understand both the holistic nature and/or specific analytics of learning expected, the level of learning expected, and then make decisions about their current level of learning to inform revision and improvement [9].
2 METHODOLOGY
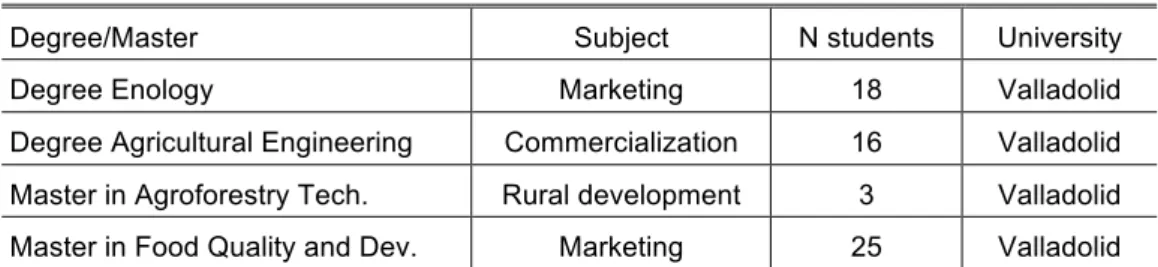
The innovation teaching project used a linear methodology in four steps. In a first step the competences to assess were collected and the criteria and levels of achievement were assigned. The competences were collected from the guides provided by the Degrees and Masters Higher Education National Committee. Three competences were considered, i) Capacity to analyse and summarise (C1), ii) Ability to communicate both in technical and non-expert forums (C2) and iii) Critical thinking (C3). The criteria and level of achievement were agreed by teachers´ focus group. For the implementation of the rubric, four subjects of Degree and Master were considered (Table 1). The sampling of participant students totalled 62 by January 2018, with an average age 24.55 (the younger aged 21 and older 41). The sample counted 45.16% men and 54.84% women.
Table 1. Sampling of studies, subjects and students involved in the innovation teaching project assessing competences by rubrics.
Degree/Master Subject N students University
Degree Enology Marketing 18 Valladolid
Degree Agricultural Engineering Commercialization 16 Valladolid Master in Agroforestry Tech. Rural development 3 Valladolid
Master in Food Quality and Dev. Marketing 25 Valladolid
In a second step the digital Rubistar tool was used to create a rubric for the assessment of competences. Rubric contained three essential features: criteria students are to attend to in completing the assessment, markers of quality (level 1, level 2 and level 3), and punctuating (Likert scale anchored extremes 1-very low achievement to 5-complete achievement). Criteria were used in determining the level at which student work meets expectations. Markers of achievement give students a clear idea about what must be done to demonstrate a certain level of mastery, understanding and proficiency. A rubric matrix of three competences for three stages and three levels of achievement (9x3) were obtained (Table 2).
Table 2. Rubric used to assess the competences.
Competence Category Level 1 Level 2 Level 3
C1 Formal aspects Accomplish guide Cover objectives Include flow chart Solving problems Address a real case Solve problems Deal with market
Adaptation Adapt to market Adapt signature Eco. & Techn. C2 Presentation In time and form Time distribution Proper support
Expression Proper vocabulary Address subject Express fluently Audience interest Audience attentive Create interest Answer questions C3 Formal conclusions SWOT or similar Deal premises Own recommend. Address objectives Address objectives Derive objective Novel conclusion Practical implications Future lines Feasible Adapt to market
In a third step the rubric was implemented. The rubric was shared with students at the beginning of the semester using the Moodle on-line teaching platform. The students worked and could self-revise their work according analytics of learning expected and the level of learning expected. Students made decisions about their current level of learning to inform revision and improvement.
the intra-groups correlation. The SPSS 20.0 program was used to analyse the data. A focus group compared the punctuations given by students and teachers validating the use of rubrics to assess the teaching competences. Table 3 summarizes the methodology, methods and outcomes of each stage of the teaching innovation project developed.
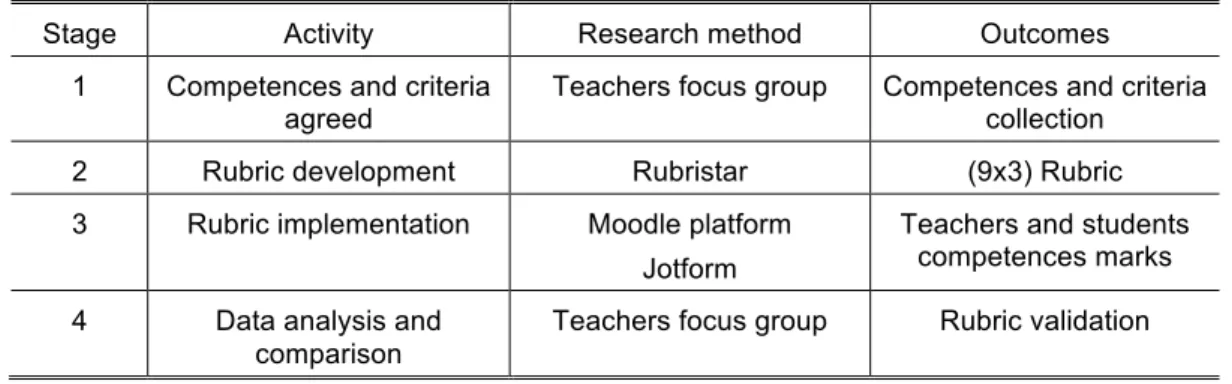
Table 3. Activities, methods and outcomes carried out at each stage of the teaching innovation project.
Stage Activity Research method Outcomes
1 Competences and criteria
agreed Teachers focus group Competences and criteria collection
2 Rubric development Rubristar (9x3) Rubric
3 Rubric implementation Moodle platform Jotform
Teachers and students competences marks
4 Data analysis and comparison
Teachers focus group Rubric validation
3 RESULTS
The development of the rubric leads teachers to separate the learning competences by the sum of its parts criteria. Then, levels of achievement of learning competences were considered by teachers in the rubric. This evaluation approach using rubric made teachers to realize the competences that the students need to acquire [1]. The rubric was capable to measure the progress, evolution and acquisition of competences by the students [5] according to the European Higher Education Area (EHEA) learning process, proposed by the Bologna Declaration. In this sense, teachers concluded the ability of the rubric to align the evaluation with the Bologna teaching-learning process.
The implementation of the rubric entailed novel scenery for students scoring their own work. This novel experience considers the participation of students in the evaluation process, involving them as participants in the learning process. Although the rubric was at students´ disposal at the beginning of the semester, the teachers noticed students pay attention to it when the evaluation. It has sense due to the novelty of this experience for the students. Nevertheless, once they have checked rubric, the teachers noticed the students´ efforts to fulfil the criteria understanding both the holistic nature and/or specific analytics of learning expected and the level of learning expected [9]. In this sense teachers concluded rubric served students´ self-evaluation measuring their work quality and possible improvement. Students assume their teaching responsibility.
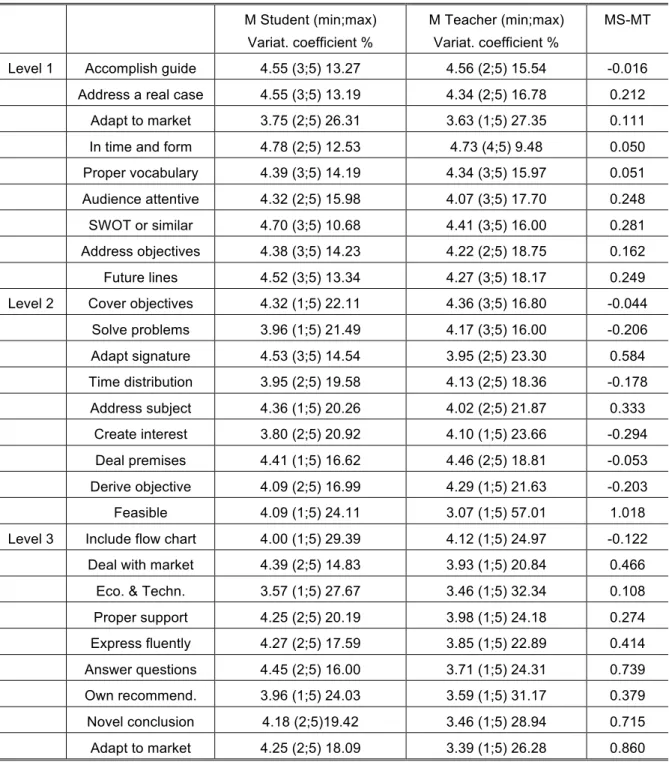
Table 4. Means, minimum, maximum and variation coefficient in percentage and means difference between punctuations given by students and teacher to the achievement of the criteria describing
in the learning competences assessed.
M Student (min;max) Variat. coefficient %
M Teacher (min;max) Variat. coefficient %
MS-MT
Level 1 Accomplish guide 4.55 (3;5) 13.27 4.56 (2;5) 15.54 -0.016
Address a real case 4.55 (3;5) 13.19 4.34 (2;5) 16.78 0.212
Adapt to market 3.75 (2;5) 26.31 3.63 (1;5) 27.35 0.111
In time and form 4.78 (2;5) 12.53 4.73 (4;5) 9.48 0.050
Proper vocabulary 4.39 (3;5) 14.19 4.34 (3;5) 15.97 0.051
Audience attentive 4.32 (2;5) 15.98 4.07 (3;5) 17.70 0.248
SWOT or similar 4.70 (3;5) 10.68 4.41 (3;5) 16.00 0.281
Address objectives 4.38 (3;5) 14.23 4.22 (2;5) 18.75 0.162
Future lines 4.52 (3;5) 13.34 4.27 (3;5) 18.17 0.249
Level 2 Cover objectives 4.32 (1;5) 22.11 4.36 (3;5) 16.80 -0.044
Solve problems 3.96 (1;5) 21.49 4.17 (3;5) 16.00 -0.206
Adapt signature 4.53 (3;5) 14.54 3.95 (2;5) 23.30 0.584
Time distribution 3.95 (2;5) 19.58 4.13 (2;5) 18.36 -0.178
Address subject 4.36 (1;5) 20.26 4.02 (2;5) 21.87 0.333
Create interest 3.80 (2;5) 20.92 4.10 (1;5) 23.66 -0.294
Deal premises 4.41 (1;5) 16.62 4.46 (2;5) 18.81 -0.053
Derive objective 4.09 (2;5) 16.99 4.29 (1;5) 21.63 -0.203
Feasible 4.09 (1;5) 24.11 3.07 (1;5) 57.01 1.018
Level 3 Include flow chart 4.00 (1;5) 29.39 4.12 (1;5) 24.97 -0.122
Deal with market 4.39 (2;5) 14.83 3.93 (1;5) 20.84 0.466
Eco. & Techn. 3.57 (1;5) 27.67 3.46 (1;5) 32.34 0.108
Proper support 4.25 (2;5) 20.19 3.98 (1;5) 24.18 0.274
Express fluently 4.27 (2;5) 17.59 3.85 (1;5) 22.89 0.414
Answer questions 4.45 (2;5) 16.00 3.71 (1;5) 24.31 0.739
Own recommend. 3.96 (1;5) 24.03 3.59 (1;5) 31.17 0.379
Novel conclusion 4.18 (2;5)19.42 3.46 (1;5) 28.94 0.715
Adapt to market 4.25 (2;5) 18.09 3.39 (1;5) 26.28 0.860
The students variation in the achievement of criteria (variation coefficient %) shows a large variation in the feasibility of the solutions to solve problems (V.C. = 57.01%), economical and technological solutions of problems (V.C. = 32.34%) and original own recommendations in the solutions (V.C. = 31.17%). The larger variation appears in critical thinking criteria and concludes a different acquisition by students. Teachers´ focus group attributed this variation to the students´ different baseline knowledge to face the studies and pointed out the need to revise the admission requirements of students.
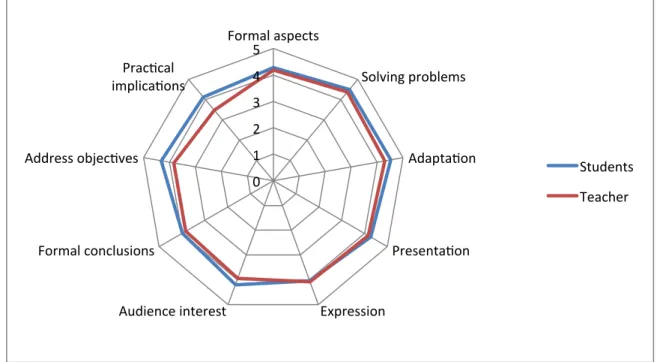
The analysis of the aggregated criteria shows similar values between students and teachers on the expression criteria (MS-MT = -0.047) and larger variations in the practical implications of the students´ work (MS-MT= 0.651) and the conclusions achievement of the objectives of the work (MS-MT = 0.476) (Figure 1).
Figure 1. Difference mean punctuation to competences criteria by teachers and students.
Between students, the teachers marked the higher difference in the interest of the audience in the works presentation (V.C. = 35.02%). It is interesting to point out the high difference between students in the acquisition of criteria competences under both students and teacher punctuation, ranged from 12.99% to 35.02% (Table 5).
Table 5. Means punctuations given by students and teacher to the achievement of the aggregate criteria of competences to assess.
Competence Category M Students [Variat. Coefficient %] M Teacher [Variat. Coefficient %] MS-MT
C1 Formal aspects 4.28 [19.56] 4.18 [21.62] 0.102
Solving problems 4.50 [14.82] 4.38 [15.60] 0.117
Adaptation 4.53 [12.99] 4.30 [17.60] 0.231
C2 Presentation 4.27 [20.11] 4.16 [19.05] 0.111
Expression 4.04 [20.99] 4.08 [21.26] -0.047
Audience interest 4.20 [19.61] 3.94 [35.02] 0.254
C3 Formal conclusions 3.99 [25.45] 3.84 [26.77] 0.151
Address objectives 4.32 [17.96] 3.84 [23.78] 0.476
Practical implications 4.13 [20.62] 3.48 [28.82] 0.651
0 1 2 3 4 5
Formal aspects
Solving problems
Adapta;on
Presenta;on
Expression Audience interest
Formal conclusions Address objec;ves
Prac;cal implica;ons
Students
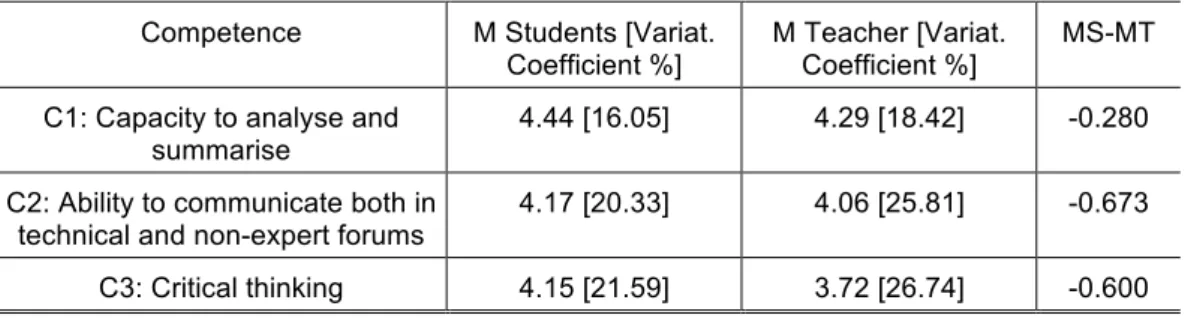
The competences evaluation (Table 6) showed teachers higher perception of competences achievement than students, negative difference between students and teachers punctuation. The competence less achieved both students and teachers was students´ critical thinking. The competence higher achieved by students and teachers was the capacity to analyse and summarise. Teachers agreed students´ capacity to analyse and summarise caused by the social media and information and communication technologies used by younger students that promotes to analyse and summarise.
Table 6. Means punctuations given by students and teacher to the achievement of learning competences to assess.
C3: Critical thinking 4.15 [21.59] 3.72 [26.74] -0.600
4 CONCLUSIONS
The rubric approach to evaluation makes teachers to realize the competences that the students need to acquire. Rubric is capable to measure the progress, evolution and acquisition of competences by the students according to the European Higher Education Area (EHEA) learning process. In this sense, teachers concluded the ability of the rubric to align the evaluation with the Bologna teaching-learning process.
The teachers notice the students´ efforts to fulfil the criteria understanding both the holistic nature and/or specific analytics of learning expected and the level of learning expected. In this sense was concluded that the rubric served students´ self-evaluation measuring their work quality and possible improvement. Students assume their teaching responsibility.
It was concluded students presented higher perception in the achievement of formal aspects of the work than in practical solutions to agricultural engineering market problems that can cause insecurity to face the future labour market by the students.
The larger variation (57.01%-31.17%) appears in critical thinking competence and concludes a different acquisition by students. Teachers´ focus group attributed this variation to the students´ different baseline knowledge to face the studies and pointed out the need to revise the admission process.
The competence less achievement both students and teachers was students´ critical thinking. The competence higher achievement by students and teachers was the capacity to analyse and summarise.
Students make decisions about their current level of learning to inform revision and improvement.
ACKNOWLEDGEMENTS
This innovation teaching project was financially supported by the Innovation Teaching Area Projects call of the University of Valladolid.
REFERENCES
[1] M.P. García-Sanz, “La evaluación de competencias en Educación Superior mediante rúbricas: un caso práctico”, RevistaElectrónicaInteruniversitariadeFormacióndelProfesorado, vol. 17, no. 1, pp. 87–106, 2014.
[3] C. Rust, “Towards a scholarship of assessment”, Assessment and Evaluation in Higher Education, vol. 32, no. 2,pp.229–237, 2007.
[4] J.B. Biggs, Calidad del aprendizaje universitario. Madrid: Nancea, 2005.
[5] A. Fernández March, “La evaluación orientada al aprendizaje en un modelo de formación por competencias en la educación universitaria”, Revista de Docencia Universitaria, vol. 8, no. 1, pp. 11–34, 2010.
[6] J. Tejada, “La Evaluación de las competencias en contextos no formales: dispositivos e instrumentos de evaluación”, Revista De Educación, vol. 354, pp. 731–745, 2011.
[7] A. Zabala, L. Arnau, 11 ideas clave. Cómo aprender y enseñar competencias. Barcelona: Graó, 2007.
[8] J. Alsina, Rúbricas para la evaluación de competencias: Cuadernos de docencia universitaria. Barcelona: Octaedro-ICE Universidad de Barcelona, 2013.
[9] H. Andrade, “Teaching with rubrics”, College Teaching, vol. 53, no. 1, pp. 27–30, 2005. [10] A. Medina Rivilla, M.C. Domínguez Garrido, C. Sánchez Romero, “Evaluación de las
competencias de los estudiantes: modelos y técnicas para la valoración”, Revistade InvestigaciónEducativa, vol. 31, no. 1, pp. 239–255, 2013.