Effects of sound on growth, viability, protein production yield and gene expression in Escherichia coli
92
0
0
Texto completo
(2)
(3)
(4) “If there were ever anything. like a magic potion that could be poured into man to bring him to a higher plane, then this magic potion would be made of sounds.”. Ursula Seiler.
(5) Dedication This research is the result of mixing my two biggest interests in life: genetics and music. I dedicate this work to those who have heard “you can only choose one of them” and to those that were there encouraging me to continue no matter the difficulties. To my mom, dad and two brothers, who were the first ones that accepted the way I saw the world. To the Acuña family for fostering my love for music, to the González family for helping me to develop my resilience, to the Montes-Reyna family for their warmth and to my godparents that have always looked out for me, to Paty and Eva for treating me as part of their family. To my music teachers, Elena and Angelo, who coordinated the music Minor which forced me to create a way to combine music with biotechnology. To my teachers (Elsy, Adriana, Tenchita, Bertha, Oscar, Silverio, Doris, Janet, Rocío, Aurora, Victor, Daniel, Marco, Julio, Guy, Juan Ignacio, Jorge, Hugo, Carolina, David) who taught me everything I know about biotechnology and sound. To my coworkers from X4 project (Adrián, Poncho, Daniel, Tomás, Andrés, Joe, Alma, Edith, Fede, Paty) who were the first ones to listen to my “weird” ideas about using sound in biotechnology. To my graduate colleges (María, Eva, Annia, Ariana, Emaús, Delia, Emilio, Gus, Karen, Héctor, Ingrid, Jesús S, Mónica, Gil, Perla, Sofía, Isaac, Carlos, Vero, Javier, Paulyna, Erika, Melissa A, Melissa M, José, Lily, Soledad, Shirley, Gaby, Laura) because they understand this kind of struggle. To the CB staff and teachers (Gaby, Mary Q, Vero, Bere, Aydee, Felipe, Benji, Luis Mario, Alberto, Mirna, Karla, Edgardo, Cristina, Daniel, Brenda) who helped me meet my goals with their extensive knowledge. To the bioprocess group (Jorge, Pepe, Calef, Fanny, Wendy, Raquel, Isabela, Alex, Stephy, Tere, Paco), the molecular biology group (Chema, César, Bong Min, Sergio, Mario, Alex, Lola, Cuauhtémoc, Héctor, Constantino, Marion, David), Willson’s lab (Richard, Mary, Victoria, Katerina, Kristen, Kate, Gavin, Ahmad, Dimple, Atul, Binh, Ujwal, Heather, João, Adheesha, Jay, Abraham, Michelle) and “little helpers” (Li Lu, Carolina, Sabrina, Karen, Suria, Melissa R, Sergio, Manne, Melissa G, Salim, Gilberto, Fátima, Fernanda, Priscila, Noemi, Abraham) because each one of them welcomed me, advised me and guided me throughout crucial moments of the whole project. To my undergraduate friends (Kiwi, Valeria, Poncho, Mayra, Gaby, Neto, Roberto, Cristina, Marifer, Flavio, Thelma, Loreto, Daniel, Román, Valentina, Aleyda, Isaac, Camilo, Minerva, Adria, Mariana, Eduardo, Nataly, Vane, Teo, Pao, Laura, Carlos, Yoxter, Anita, Lex, Ramón), new friends (Mau, Cheke, Juan Carlos, Katy), music (Kike, Poncho, Emiliano, Lalo, Rodo, Orlando, Gil, Roger, Sofía, Luis, Carlos, Rich, Adrián, Edén, Fer, Iris, Angie, Cassandra, Emmy, Ita, David, Gus, Juan, Dan, Jorge, Bruno, Neztor, Jesús, Gris, Enrique, Beto), from Puebla (Gastón, Male, Arturo, Nash, Aridaí, Cassandra, Oleńka, Gaby, Emy, Seok, Clau, Tere, Emy, Marixay, Beto, Memo, Flaco, Pablo, Mano y Mana, Bere), from Taller Ciencia Viva (Yolis, Christian, Angie, Barbie, Jenny), from internet (Elena, Lucjia, Magda, Rocío, Alex, Joe), and from Pokémon (Karla, Done, Coach, Panxho, Ever, David, Tsuro, Rola, Kike, Adam, LuisFig, Emad, Aurora, Mojica, Martín, Lara). To Esteban and Don Juan who fed me for almost 10 years. And especially to Chucho who has been my right hand for almost 10 years (professionally, personally, emotionally, intellectually) and Edda for being the person who has best known and cared about Edgar by giving him unconditional confidence, inspiration, support, patience, and encouragement. You three were my main motivation for pushing through this work..
(6) Acknowledgements This project had obstacles even before its conception, nothing could have been accomplished if it were not for the contribution of every one of you. For this reason, I would like to kindly thank: ✓ Jorge Benavides, José Manuel Aguilar, David Ibarra, Victor Treviño and Guy Cardineau. for their time, energy, patience, advice and support given to this dissertation. ✓ Tecnológico de Monterrey for the tuition support and Consejo Nacional de Ciencia y. Tecnología (CONACyT) for the living support through the PhD scholarship No. 388204. ✓ Research Group with strategic focus on Bioengineering, Biosystems and Synthetic. Biology (3Bs) of Tecnológico de Monterrey (Account number 0020209I13) for the financial support. ✓ Mary Crum and Dimple Chavan-Patil for their molecular teachings while in University of. Houston. ✓ Jesus Hernández, Héctor Castañeda, Laura Acevedo, Felipe López and Li Lu Lam for. their support in laboratory techniques. ✓ The Molecular Biology seminars for their suggestions to overcome areas of opportunity in. the methodology and data presentation. ✓ To José González, Edgardo Escalante and Richard Willson for reviewing the statistical. methods used in this dissertation. ✓ To every person mentioned in the dedication for helping me keep my sanity..
(7) Effects of sound on growth, viability, protein production yield and gene expression in Escherichia coli. by. Edgar Acuña González. Abstract The effect of sound on biological systems is a subject that has been previously explored, mainly in relation to its use to increase agricultural production. However, the potential of this phenomenon has not been exploited properly because present studies have focused only on one or two sound elements for the characterization of their biological effects. In this sense, the effects of other sound wave elements have been overlooked. In the present work, the effects of frequency, amplitude, duration, intermittence and pulse individually and in combination - were characterized in Escherichia coli through the measurement of its biomass, viability and yield production of recombinant protein. The treatments of frequency and duration increased the concentration of biomass in 19% and 44% respectively at time 24 h; however, high variability was observed in both treatments. The amplitude treatment had a significant effect on the viability, which the duration of the exponential phase was doubled. The intermittency treatment increased the yield of recombinant protein 1.5 times without significant contribution of the other sound elements. Based on this observation, the effect that intermittency could have on the upregulation of the expression of genes involved in the production of recombinant proteins was investigated. The RNA of three candidate genes (BarA, CheA and CpxR) was quantified in the presence of an intermittent sound. All genes were upregulated (1.38, 2.66 and 1.33 times respectively); however, only upregulation related to chemotaxis (CheA) was statistically significant. Finally, an omnidirectional sound source was adapted to small-volume commercial bioreactors to characterize the distribution of sound within the container. It was determined that the implementation of sound induction in a commercial bioreactor is feasible, although limited to certain specific frequencies close to 500 and 1000 Hz. The integral nature of this characterization presents a deeper understanding of bacterial systems and also offers a way through which it is possible to explore its application for industrial purposes.. iv.
(8) Resumen El efecto del sonido en sistemas biológicos es un tema que ya ha sido explorado anteriormente, principalmente en relación a su uso para aumentar la producción agrícola. Sin embargo, el potencial de este fenómeno no ha podido ser aprovechado debidamente ya que la mayoría de los estudios se han enfocado solamente en uno o dos elementos del sonido para la caracterización de sus efectos biológicos. En este sentido, los efectos de otros elementos de onda de sonido han sido pasados por alto. En el trabajo presente, los efectos de la frecuencia, amplitud, duración, intermitencia y pulso – individualmente y en combinación – fueron caracterizados en Escherichia coli a través de la medición de su biomasa, viabilidad y rendimiento de producción de proteína recombinante. Los tratamientos de frecuencia y duración aumentaron la concentración de biomasa en 19% y 44% respectivamente a las 24 h; sin embargo, en ambos tratamientos se observó alta variabilidad. El tratamiento de amplitud tuvo un efecto significativo en la viabilidad en la cual se duplicó la duración de la fase exponencial. El tratamiento de intermitencia aumentó el rendimiento de proteína recombinante 1.5 veces sin contribución significativa de los otros elementos del sonido. Con base en esta observación, se investigó el efecto que la intermitencia pudiere tener sobre la regulación positiva de en la expresión de genes involucrados en la producción de proteína recombinante. Se cuantificó el RNA de tres genes candidato (BarA, CheA y CpxR) ante la presencia de un sonido intermitente. Todos los genes fueron regulados positivamente (1.38, 2.66 y 1.33 veces respectivamente); sin embargo, sólo aquel relacionado con la quimiotaxis (CheA) fue estadísticamente significativo. Finalmente, se adaptó una fuente de sonido omnidireccional a biorreactores comerciales de poco volumen para caracterizar la distribución del sonido dentro del recipiente. Se determinó que la implementación de inducción con sonido en un biorreactor comercial es factible, aunque limitado a ciertas frecuencias específicas cercanas a 500 y 1000 Hz. La naturaleza integral de esta caracterización presenta una comprensión más profunda acerca del efecto del sonido sobre los sistemas bacterianos y también ofrece una vía a través de la cual es posible explorar su aplicación para fines industriales.. v.
(9) List of Figures Chapter 2 Figure 2.1. Visual representation sound as a longitudinal wave (A) and as a transverse wave (B). ......................................................................................................................................................... 7 Figure 2.2. Scale that represents the relationship between sound-pressure level (dB) and sound pressure (Pa). ............................................................................................................................... 10. Chapter 3 Figure 3.1. Graphic representation of the basic elements that constitute a sound wave: (A) frequency, (B) amplitude, (C) duration, (D) intermittence and (E) pulse. .................................... 20 Figure 3.2. Flow chart that explains the sequence of the experimental stages of the present work. ....................................................................................................................................................... 21 Figure 3.3. Plasmid map of p10_NanoLuc: pUC57 containing A ScFv antibody (GenI = 768 bp) fused with a bioluminescent reporter (nLUC = 522 bp) and cloned in pUC57 (2710 bp) by EcoRV. ............................................................................................................ ¡Error! Marcador no definido. Figure 3.4. Parts of the sound wave inductor device (A) and its assembled form (B): [1] sterilized flask, [2] beaker, [3] plastic supporter, [4] speaker, [5] sound generator, [6] flexible tubing, [7] sample receiver, [8] flask swab, [9] lid with two outlets, [10] syringe, [11] 0.45 mm filter, [12] tweezers, [13] cotton..................................................................................................................... 24 Figure 3.5. Peak design for pulsed audios. ................................................................................. 26 Figure 3.6. Design of an omnidirectional point source speaker.................................................. 37 Figure 3.7. Horizontal assembly of the point source speaker (left) with the bioreactor (right). .. 38. Chapter 4 Figure 4.1. Visual representation of signal output for the audio files used for the sound individual elements experiment. ................................................................................................................... 41 Figure 4.2. Biomass growth kinetics for each sound treatment (dark gray) that differs in frequency (FRQ), amplitude (AMP), duration (DUR), intermittence (IMT), pulse (PLS) and no sound (CTL) in comparison to a standard treatment (light gray). ..................................................................... 44 Figure 4.3. Biomass viability kinetics for each sound treatment (dark gray) that differs in frequency (FRQ), amplitude (AMP), duration (DUR), intermittence (IMT), pulse (PLS) and no sound (CTL) in comparison to the standard treatment (light gray).. ................................................................. 45. vi.
(10) Figure 4.4. Total biomass (A) and luminescent protein production yield (B) produced after 24 h of growth in the presence of different sound treatments that differed in frequency (FRQ), amplitude (AMP), duration (DUR), intermittence (IMT) and pulse (PLS) compared to a standard treatment (STD)............................................................................................................................................. 46 Figure 4.5. (A) Luminescent protein production yield after 24 h of growth using the sound conditions described in Table 3.2 (Group A). (B) Absolute values of the standardized effects that sound elements (a = Frequency, b = SD Inter, c = SS Rate, d = Duration and e = Pulse) had on the production of recombinant protein in Escherichia coli. .......................................................... 51 Figure 4.6. (A) Luminescent protein production yield after 24 h of growth using the sound conditions described in Table 3.2. (Group B). (B) Absolute values of the standardized effects that sound elements (a = Frequency, b = Pulse) had on the production of recombinant protein in Escherichia coli. ............................................................................................................................ 52 Figure 4.7. (A) Luminescent protein production yield after 24 h of growth using the sound conditions described in Table 3.2. (Group C). (B) Absolute values of the standardized effects that sound elements (a = Duration, b = SD Inter, c = SS Rate) had on the production of recombinant protein in Escherichia coli. ............................................................................................................ 53 Figure 4.8. Amplified fragments using the total genomic DNA of Escherichia coli and the primers listed in Table 3.3. ........................................................................................................................ 55 Figure 4.9. Values of the normalized gene expression per treatment (∆Ct)............................... 56 Figure 4.10. Frequency response for the 1L empty bioreactor measured on the top (A), midpoint (B) and bottom (C). ....................................................................................................................... 59 Figure 4.11. Frequency response for the 1L bioreactor with half volumetric capacity measured on the top (A), in the water’s surface (B), and top with stirring (C). .................................................. 60. Figure 4.12. Frequency response for the 2L empty bioreactor measured on the top (A), midpoint (B) and bottom (C). ....................................................................................................................... 61 Figure 4.13. Frequency response for the 2L bioreactor with half volumetric capacity measured on the top (A), in the water’s surface (B), and top with stirring (C). .................................................. 62. Annexes Figure A.1. Luminescent protein production yield after 24 h of growth in the presence of specific frequency treatments in terms of 1/3-octave bands..................................................................... 78 Figure A.2. Luminescent protein production yield after 24 h of growth in the presence of specific frequency treatments between 400 Hz and 600 Hz using an 8 Hz bandwidth............................ 78. vii.
(11) List of Tables Chapter 2 Table 2.1. Musical notes and their corresponding frequencies in the standard tuning (440 Hz). 9 Table 2.2. Representation of the duration of sounds/rests measured in beats. ......................... 11 Table 2.3. Relationship between Italian tempo terms and their respective pulses measured in beats per minute. .......................................................................................................................... 12 Table 2.4. List of sound conditions from previous reports classified into two categories: singlefrequency stimuli or musical stimuli.............................................................................................. 16. Chapter 3 Table 3.1. Treatments for the individual sound elements experimental stage: control treatment (CTL), standard treatment (STD), frequency treatment (FRQ), amplitude treatment (AMP), duration treatment (DUR), intermittence treatment (IMT) and pulse treatment (PLS). ............... 27 Table 3.2. Conditions for the sound elements interaction experiment stage: all sound elements (Group A), oscillatory elements (Group B) and silence-related elements (Group C).................. 30 Table 3.3. List of primers used for the sound gene expression experiment in Escherichia. coli.34. viii.
(12) Contents Abstract. iv. List of Figures. vi. List of Tables. viii. Index. ix. 1. Introduction ................................................................................................................. 1 1.1. Dissertation Hypothesis ........................................................................................ 3 1.2. Dissertation Objectives ......................................................................................... 4 1.3. Dissertation Structure ........................................................................................... 5 2. Background ................................................................................................................. 6 2.1. Sound properties................................................................................................... 6 2.2. Sound elements .................................................................................................... 8 2.2.1. Frequency....................................................................................................... 8 2.2.2. Amplitude........................................................................................................ 8 2.2.3. Duration ........................................................................................................ 10 2.3. Biological sound effects ...................................................................................... 13 3. Materials and methods .............................................................................................. 20 3.1. Materials ............................................................................................................. 21 3.1.1. Chemicals and reagents ............................................................................... 21 3.1.2. Escherichia coli strain construction............................................................... 22 3.1.3. Sound induction device................................................................................. 23 3.1.4. Sound wave design ...................................................................................... 24 3.2. Sound elements experiments.............................................................................. 26 3.2.1. Individual sound elements ............................................................................ 26 3.2.2. Frequency screening .................................................................................... 28 3.2.3. Sound elements interaction .......................................................................... 29 3.2.4. Escherichia coli biomass concentration and viability determination.............. 31 3.2.5. Recombinant protein production yield determination .................................... 31 3.3. Gene expression analysis ................................................................................... 32 3.3.1. Primer design................................................................................................ 33 3.3.2. RNA extraction.............................................................................................. 34 3.3.3. cDNA synthesis ............................................................................................ 35 3.3.4. Quantitative PCR .......................................................................................... 36 ix.
(13) 3.4. Methods for sound-bioreactor system ................................................................. 36 3.5. Statistical analysis............................................................................................... 39 4. Results and Discussion ............................................................................................. 40 4.1. Sound induction device validation ....................................................................... 40 4.2. Sound elements results....................................................................................... 42 4.2.1. Effect of individual sound elements .............................................................. 42 4.2.2. Effects of frequency ...................................................................................... 48 4.2.3. Effect of the interaction of sound elements ................................................... 49 4.3. Gene expression analysis ................................................................................... 54 4.3.1. Primer validation ........................................................................................... 54 4.3.2. Comparative Ct (2-∆∆Ct).................................................................................. 55 4.4. Sound-bioreactor system .................................................................................... 58 5. Conclusions and future studies ................................................................................. 65 5.1. Proposed future studies ...................................................................................... 66 5.2. Future studies in bioacoustics technology........................................................... 67 References.................................................................................................................... 68 Annexes ........................................................................................................................ 78 Vitae .............................................................................................................................. 79. x.
(14) Chapter 1. Introduction. 1. Chapter 1 1. Introduction Sound is a type of energy that propagates in the form of waves through matter. In physics, sound waves and their mechanical properties on inanimate systems have been well characterized. This type of characterization has made possible to develop technological advances such as modern telecommunications (telegraph, telephone, radio and television) and navigation (SONAR); and more recently in industry for degassing liquids,1 deagglomeration of solids2 and separation.3 However, sound research in life sciences has not received enough attention despite the fact that at all times, due to its ubiquity, it provides environmental information to living organisms which only those who were able to identify and adapt accordingly, ensured their survival. Out of those limited sound studies, most of them are focused on sterilization of microorganisms,4 or improvement of agricultural production and very few of them addresses how sound affects unicellular organisms. Regardless of the quantity of studies describing sound effects on organisms, the specific process by which it influences different molecular mechanisms is still poorly understood. It has been suggested that sound promotes the vibration of the cell membrane while increasing selectivity towards certain compounds that stimulate cell growth,5 but other hypotheses state that sound waves can regulate gene expression by modifying transcription factors6,7 or by activating physical stress mechanoreceptor channels.8-12 More recently, it has been stated that living organisms respond to a combination of sound patterns which could carry biological information13 and that cell membranes have the capacity to decode and transmit this information, thus spreading the effect within a certain population.14 One of the main reasons why these hypotheses have not been confirmed so far is that these studies have used sound only to pinpoint any biological effect rather than focusing on intrinsic characteristics of sound. Thus, to be able to accurately correlate how sound influences a biological effect, it is necessary to design specific sound treatments that highlight each sound element and test them, individually or in combination, to verify a change in a physiological state. Using this proposed methodology, a deeper understanding of the effect of sound waves on living organisms, their physiological state could be predicted and even modulated. This knowledge may eventually lead to the development of new technology in fields such as applied microbiology, bioengineering, agroindustry and medicine in more than one way, especially because it has.
(15) Chapter 1. Introduction. 2. already been described that sound can alter the metabolism,15-17 enhance antibiotic susceptibility,18-21 promote resistance towards stressful environments,22-24 modulate activity of enzymes,5,10,25,26 increment biomass production8,10,27-29 and influence gene expression.7,30-32 Considering the latter, several applications can be proposed. For instance, using sound stimulus specifically designed to regulate metabolic pathways punctually depending on the growth stage without the need of metabolic engineering. In other words, to generate sound treatments that can influence the growth or synthesis rate in an organism of interest by matching the sound element with the organism’s growth phase. A specific example might be using certain sound parameters that speeds up growth during log phase and some others that slows down at the end of the growth to prevent product over accumulation. Another application could be to use sound as a form of selective sterilization for industrial or medical purposes. In relation to antibiotic susceptibility, some sound treatments could have different effects according to the organism. For example, certain sound conditions could enhance resistance towards stress in an organism of industrial interest and, similarly, those same conditions could be detrimental to pathogens. This phenomenon could be implemented in bioreactors or operating rooms to prevent pathogen cross contamination.. In addition, another possible new application of sound in industry would be to increase protein production yield in microbial recombinant systems using gene promoters sensible to sound. Considering that protein production yield highly depends on the gene expression of the system, overexpressing recombinant proteins in a cell can often be detrimental to its productivity due to accumulation or inclusion bodies formation,33 for this reason inducible promoters are preferred over strong constitutive promoters where the protein expression can be activated or repressed depending on environmental factors surrounding the host strain. Nevertheless, the most common inducible promoters have still areas of improvement. For instance, using the AOX1 promoter, a methanol-induced promoter,34 in Pichia pastoris creates by-products that are toxic to yeast cells35. In addition, the lac promoter is preferably induced in E. coli by lactose or its non-hydrolysable analog isopropylβ-D-1-thiogalactopyranoside (IPTG);36 because the latter has a high cost in the market, cannot be metabolized and is difficult to use in large scale production due to coat, it increases considerably the price of the final product to the point of making the bioprocess unscalable.37 Other types for inducing genes include the.
(16) Chapter 1. Introduction. 3. temperature shift which can harm thermo-sensitive products and the nutrient depletion which can decrease the final biomass concentration causing the reduction of the production yield.38 Sound could overcome at least some of these drawbacks. First, it can travel best through dense media, which means that it can reach every cell of the population. Second, because sound would not be directly mixed as with chemical induction, it won’t affect the following protein recovery/purification processes, which are the key determinants of a bioprocess economic viability.39 Considering this potential, performing an accurate and complete characterization of sound using a standardized and replicable methodology has great importance. Moreover, to our research team, it was of great interest to focus on understanding the relationship between sound elements and specific biological parameters – biomass, viability and protein production yield – in E. coli, a widely used model organism. Moreover, gene expression analysis was done with the purpose of finding a molecular pathway that is affected by sound and finally, the feasibility of using sound systems adapted into commercially available bioreactors was investigated. This approach will help not only to understand how sound influences biology, but also could be used to develop unexplored bioengineering technologies in a near future.. 1.1. Dissertation Hypothesis Even though there are not many studies about biological effects due to sound exposure in living organisms, there is evidence that sound does influence organisms. However, because of the lack of attention in the composition of sound treatments, its mechanism of action is still unknown. Thus, by focusing on specific sound designs that change in one element at a time, the link between sound and biological effects can be detected more accurately. With this approach, the experimental work presented in this document revolves around four main hypotheses: I.. It is possible to design and construct a sound induction device to study the effect of sound on a microbial system at lab scale as a proof of concept, using E. coli as experimental model..
(17) Chapter 1. Introduction II.. 4. A specific sound element (frequency, amplitude, duration, intermittence or pulse), or a combination of them, can punctually influence a response in viability, biomass concentration and/or protein expression yield of E. coli.. III.. A specific sound element, or a combination of them, can influence the expression of specific genes in E. coli.. IV.. It is feasible to adapt speakers into bioreactors to produce a uniform auditory signal inside the container.. 1.2. Dissertation Objectives This study falls within the area of basic science and technology because it attempts to describe a phenomenon, which has not been deeply studied, and use these findings in the development of new technology that can be implemented in bioprocessing industry. Therefore, the general objective is to identify the sound elements that influence biological responses of importance in research and in industry, particularly biomass concentration, viability and recombinant protein production yield, using E. coli as a model system. This characterization could give insight into how specific parts of sound affect different biological parameters and the results could be extrapolated to similar microbial expression systems, which would allow better production control in industry. Moreover, to fulfill the main objective, specific objectives for each hypothesis mentioned above have been stablished. I.. Design a sound induction device at lab scale in to study the effect of the sound elements (frequency, amplitude, duration, intermittence and pulse) on flask submerged microbial cultures, using E. coli as model system.. II.. Identify the sound elements that influence biological responses, particularly biomass concentration, viability and recombinant protein production yield through the expression of a reporter gene in E. coli.. III.. Identify genes in E. coli whose expression is susceptible to sound stimulus.. IV.. Assess the feasibility of adapting sound emitters into commercially available liquid bioreactors to produce an omnidirectional and stable sound signal.. By fulfilling these objectives, it will be possible to establish the basis where sound can be better studied, understood, implemented and adapted to technology we use nowadays..
(18) Chapter 1. Introduction. 5. 1.3. Dissertation Structure The present document is divided in 5 main chapters. Chapter 1 gives a brief description of the current state of sound research in relation to its biological effects and the relevance of the characterization of sound elements. Then, it describes the technological potential of sound, particularly regarding recombinant proteins through genetic induction and later it describes the research approach of this dissertation. Finally, the hypothesis, general objective and specific objectives are listed. Chapter 2 gives relevant background information about sound, its properties and elements, followed by most of the available reports that gives evidence to the biological effects of sound. Chapter 3 presents a detailed description of all materials (reagents, devices, biological organisms) and methods used on the present research work. Chapter 4 shows the results and present the discussion of such results. It is important to clarify that most of the results presented in this document (particularly those related to growth, viability and protein production yield) have been already accepted for publication at the Journal of Chemical Technology and Biotechnology in a paper entitled “Effects of sound elements on growth, viability and protein production yield in Escherichia coli”. Results related to the gene expression assay and characterization of sound propagation at bioreactor scale are also presented in this chapter, although have not yet been published. Finally, Chapter 5 presents general conclusions and future research lines. All references used in the document are presented at the References section following Chapter 5. Lastly, annexes (supplemented figures and the accepted scientific publication) and vitae are included..
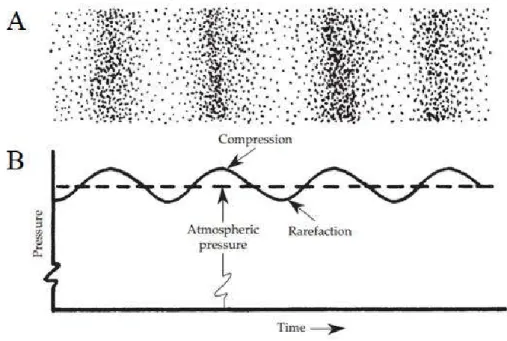
(19) Chapter 2. Background. 6. Chapter 2 2. Background 2.1. Sound properties Sound can be viewed as a wave motion in an elastic media due to the variation in pressure, 40 which means that sound is a mechanical wave. This physical phenomenon is due to the displacement of particles from their original position meanwhile elastic forces from the media tend to restore the original position; because of inertia properties of manner, this change in position creates a periodic movement. This oscillatory pressure variation creates two physical states (Figure 2.1.): (1) The spaces where the molecules are crowded together represent the areas of compression (crests) in which the air pressure is slightly greater than the atmospheric pressure; (2) the sparse areas represent rarefactions (troughs) in which the pressure is slightly less than atmospheric pressure. These fluctuations of pressure are very small; faintest sound the ear can hear (20 μPa) is 5,000 million. times smaller than atmospheric pressure.. Sound is considered a longitudinal wave because it travels the same direction as the movement of the particles. Molecules move to one direction of the compression crests and to the other side in the rarefaction troughs between the crests. Even though particles move certain distance to one direction and comes back to the original position, the sound wave exists because of the transfer of momentum from one particle to another..
(20) Chapter 2. Background. 7. Figure 2.1. Visual representation sound as a longitudinal wave (A) and as a transverse wave (B). Figure obtained and modified from ASI Pro Audio Acoustics.41. Without a medium, sound cannot be propagated; yet sound can be conducted by any medium whether they are gases, liquids, or solids. The speed of sound depends on the medium in which it is propagating. The denser the molecular structure, the easier it is for the molecules to transfer sound energy; this means that sound travels faster in solids and liquids than in gases. Additionally, the speed of sound is faster in materials that have some stiffness like steel and slower in elastic materials like rubber. Finally, sound travels faster in air as temperature and humidity increases.. It should be noted that the speed (velocity) of sound is different from the particle velocity. The velocity of sound determines how fast the sound energy moves across a medium. Particle velocity is determined by the loudness of the sound. Also, it is important to note that frequency does not change when changing between media, only its speed changes..
(21) Chapter 2. Background. 8. 2.2. Sound elements 2.2.1. Frequency Number of cycles per second, measured in hertz (Hz). High frequency indicates higher pitched sounds, just like lower frequency indicates lower notes. It is defined as:. (1) Where standard speed of sound is 340.29 m/s in normal conditions of temperature and pressure, and wavelength is the distance a wave travels in the time it takes to complete one cycle. In music, each musical note corresponds to a specific frequency depending to the tuning where the standard is A4 = 440 Hz (Table 2.1.).. 2.2.2. Amplitude Extent to which air particles are displaced which is perceived as the magnitude of the auditory sensation. Despite sound pressure is directly proportional to amplitude, sound-pressure level (SPL) is preferred since it allows more accessible measurements where absolute pressure units (Pa) are transformed to relative units (decibels) in a logarithmic scale (Figure 2.2.). Amplitude is defined as:. (2) where ρ is the measured sound pressure in Pa, 20 µPa is the reference sound pressure. One of the main properties of amplitude is its dependence on the inverse square law, which means that the sound intensity decreases as the square of the radius from the sound source..
(22) Chapter 2. Background. 9. Table 2.1. Musical notes and their corresponding frequencies in the standard tuning (440 Hz). Table adapted from MIT Physics Department.42 Note. Frequency. Note. Frequency. Note. Frequency. Note. Frequency. C0. 16.35. C2. 65.41. C4. 261.63. C6. 1046.50. C#0. 17.32. C#2. 69.30. C#4. 277.18. C#6. 1108.73. D0. 18.35. D2. 73.42. D4. 293.66. D6. 1174.66. D#0. 19.45. D#2. 77.78. D#4. 311.13. D#6. 1244.51. E0. 20.60. E2. 82.41. E4. 329.63. E6. 1318.51. F0. 21.83. F2. 87.31. F4. 349.23. F6. 1396.91. F#0. 23.12. F#2. 92.50. F#4. 369.99. F#6. 1479.98. G0. 24.50. G2. 98.00. G4. 392. G6. 1567.98. G#0. 25.96. G#2. 103.83. G#4. 415.3. G#6. 1661.22. A0. 27.50. A2. 110.00. A4. 440. A6. 1760.00. A#0. 29.14. A#2. 116.54. A#4. 466.16. A#6. 1864.66. B0. 30.87. B2. 123.47. B4. 493.88. B6. 1975.53. C1. 32.70. C3. 130.81. C5. 523.25. C7. 2093.00. C#1. 34.65. C#3. 138.59. C#5. 554.37. C#7. 2217.46. D1. 36.71. D3. 146.83. D5. 587.33. D7. 2349.32. D#1. 38.89. D#3. 155.56. D#5. 622.25. D#7. 2489.02. E1. 41.20. E3. 164.81. E5. 659.26. E7. 2637.02. F1. 43.65. F3. 174.61. F5. 698.46. F7. 2793.83. F#1. 46.25. F#3. 185.00. F#5. 739.99. F#7. 2959.96. G1. 49.00. G3. 196.00. G5. 783.99. G7. 3155.96. G#1. 51.91. G#3. 207.65. G#5. 830.61. G#7. 3322.44. A1. 55.00. A3. 220.00. A5. 880. A7. 3520.00. A#1. 58.27. A#3. 233.08. A#5. 932.33. A#7. 3729.31. B1. 61.74. B3. 246.94. B5. 987.77. B7. 3951.07.
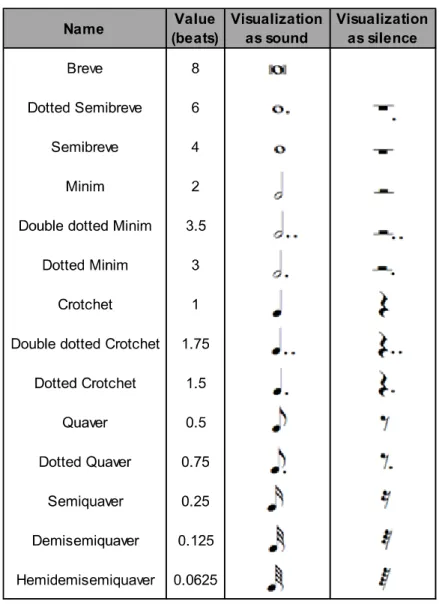
(23) Chapter 2. Background. 10. Figure 2.2. Scale that represents the relationship between sound-pressure level (dB) and sound pressure (Pa). Figure obtained from Rockfon.43. 2.2.3. Duration Length of time a sound lasts, usually from the time the sound is first noticed until the sound is identified as having changed or ceased. Duration is very variable, it can apply to single notes – which lasts less than a second – or symphonies that may last over an hour. For this reason, the beat has been used as the basic unit of time (Table 2.2.) and it is especially useful for defining every aspect of duration, which includes rhythm, meter, intermittence and pulse.44.
(24) Chapter 2. Background. 11. Table 0.2. Representation of the duration of sounds/rests measured in beats. Table obtained from “A Thorough Guide to the Musical Concepts”.44. Rhythm: Repeating sequence of stressed and unstressed beats (often called "strong" and "weak"), which are divided into bars organized by a meter and a tempo.. Meter: Grouping of beats. The types of meters are determined by the nature of the combination and division of beats: a duple meter occurs when two beats are combined, a triple meter when three beats are combined, a simple meter when the beat is split in two and a compound meter when the beat is split in three. Thus, the most common meters are simple duple (2/4, 4/4, 2/2), simple triple (3/4), compound duple (6/8), and compound triple (9/8)..
(25) Chapter 2. Background. 12. Intermittence: Interval of time characterized by alternating sound and silence cyclically, which is also called interlatency, and is regarded as a discontinuous pulse. This alternation can be applied between bars (small scale) or between full musical sections (large scale).. Pulse: Speed of bets measured in beats per minute (bpm) which consist in a repeating series of identical stimuli perceived as continuous points in time. In a musical context, the term tempo is preferred. Table 0.3. Relationship between Italian tempo terms and their respective pulses measured in beats per minute. Table obtained from Polyskeptic.45. Name Grave Largo Lento Adagio Maestoso Andante Moderato Allegro Vivace Presto Prestissimo. Definition very slow and solemn very slow and stately extremely slow slow and leisurely majestic, stately at an easy walking pace moderate fairly quick speed lively, brisk very fast extremely fast. Pulse (bpm) 40-50 40-50 50-60 60-72 72-84 80-100 100-120 120-160 144-160 160-200 168-208. Despite the importance of sound – not only for humans but also for almost all living organisms – very few studies have focused on how sound affects living beings, whereas most of the research has been limited to either physical properties of sound in inanimate objects or the harmonic relationship of sounds as an exclusive human experience..
(26) Chapter 2. Background. 13. 2.3. Biological sound effects In physics, sound waves and their mechanical properties on inanimate systems have been well characterized. However, sound research in life sciences has not received enough attention despite its ubiquitous presence around living organisms, from unicellular species to animals. Most of the research has been made in plants where the most well-known result is that a sound stimulus can increase its biomass production.46 Other studies have demonstrated that the effect depends on both the quality and the magnitude of sound as well as the organism that is under the stimulus. For instance, considering sound quality, it was determined that sound waves significantly elevate polyamine levels, but there is a greater effect in Chinese cabbage when using “green music” (natural sounds such as songs of birds, insects or water flowing in a river) and in. cucumber when using ultrasound.47 Additionally, considering sound magnitude, it was determined that the best sound conditions for rice growth were 106 dB and 400 Hz48, while in chrysanthemum mature calluses were 95 dB and 1400 Hz.15. Other sound effects have been detected in plants besides biomass growth. In chrysanthemum, it was determined that sound waves can accelerate DNA, RNA and soluble proteins synthesis,5,6 the activity of H+-ATPase,5 and the entry of oxygen.47 In Dendrobium candidum, it was found that sound (100 dB and 1000 Hz) caused the accumulation of active oxygen species (OSA) such as superoxide dismutase (SOD), catalase (CAT), peroxidase (POD) and ascorbic peroxidase (APX).26 Lastly, in Arabidopsis thaliana, sound promoted transcriptomic, proteomic and hormonal changes with five different frequencies (250, 500, 1000, 2000, and 3000 Hz).17 Moreover, some other studies have shown that certain genes can be expressed under sound stimulation.30 There is evidence to suggest that certain rice genes that normally respond to light (Rubisco and Aldolase) can be regulated positively at 250 Hz and negatively at 50 Hz, even in dark conditions,31 and specific sound conditions (80 dB and 500 Hz) can upregulate 17 different genes in Arabidopsis thaliana.32 This implies that plants may have stress-inducible genes that respond to specific frequencies that, consequently, can regulate transcription levels.6 More recently, research in plants has focused on agricultural benefits of implementing “Plant Acoustic Frequency Technology” (PAFT) with the objective of increasing plant production and decreasing the use of fertilizer in cotton49 and strawberry,50 enhancing drought tolerance in rice22 and Arabidopsis,24 and reducing tomato ripening on the shelf.23.
(27) Chapter 2. Background. 14. In addition to the effect of sound on plants, some studies in single-celled eukaryotes have shown that two-dimensional sound waves (longitudinal and transverse) are also capable of changing the pH, which causes a photochemical reaction in the cells due to a change in the elastic properties of the lipid monolayer.14 This means that sound at certain frequency and amplitude could repair the membrane and promote the activity of enzymes.48 Furthermore, metabolic profiles of yeast can change according to a specific sound stimulus.16 Finally, it has been shown that pulses by themselves are also capable of directly influencing cell behavior.51 Considering that these pulses can be transmitted to other cells, it is theorized that sound could be a type of biologically efficient communication between cells.14 Unlike research directed at the effect of sound on plants, there are even fewer studies addressing how sound affects unicellular microorganisms. The most studied organism has been Escherichia coli, for which it has been found that sound increases colony forming units (CFU),8,27 affects physiological regulation,9 modifies enzymes’ activity (SOD and CAT)10 and produces more protein and RNA.11 In other well-studied organisms, Chromobacterium violaceum and Serratia marcescens, it was noted that sound increases antibiotic susceptibility,13,21 produces more quorum sensing molecules (violacein)12,21,28 by up-regulating the expression of 432 genes.52. It is important to reiterate that, even if there are some studies that confirm the existence of biological effects of sound, especially on plants, the characterization of the sound effects in bacteria is poor. This research work presents a methodology that could be used as a platform for future studies regarding biological effects of sound in microbial systems.. In general, previous reports have used two different approaches to study the effect of sound on living organisms: 1) single-frequency stimuli and 2) musical stimuli (Table 2.4.). Single-frequency stimuli over-simplify the sound analysis by only considering a single sine wave, which is unlikely to be found in nature as most natural sounds are not pure tones but complex sounds.53 On the other hand, musical stimuli over-complicate sound analysis by using musical pieces constituted by a complex sum of rhythm, melody and harmony, making it difficult to isolate the effect of the individual sound elements on biological systems. Furthermore, until this work, there has not been any attempt to standardize the selection criteria for sound treatments as can be seen in the wide distribution of sound conditions presented on Table 2.4..
(28) Chapter 2. Background. 15. A correct standardization of sound conditions can allow the correlation of sound elements with a biological effect in more than one species. In order to establish this standardization, it is necessary to design sound treatments that only differ in one sound element at a time, identify a suitable model organism and a good selection of response variables. The organism that will receive the sound treatments must be easy to handle, capable of generating true replicates and have a fast generation time. Moreover, the response variables should not only be the same as previously reported studies for their comparison but in return should also identify new variables. These must be easy-to-monitor variables that not only identify whether there is an effect but also quantify the response, especially if more than one variable produces the effect..
(29)
(30)
(31)
(32)
(33) Chapter 3. Materials and Methods. 20. Chapter 3 3. Materials and methods In accordance with the dissertation objectives, an experimental setup was explicitly designed to identify the effect of individual sound elements on biological systems to understand their specific impact on responses such as biomass concentration, biomass viability and production yield of recombinant protein, using Escherichia coli as a model system. To do so, five sound wave elements were studied, individually and in combination, with a greater emphasis on frequency, the most studied sound element. The visual representation of the differences between these sound wave elements is shown in Figure 3.1.. Figure 0.1. Graphic representation of the basic elements that constitute a sound wave: (A) frequency, (B) amplitude, (C) duration, (D) intermittence and (E) pulse.. Then, a gene expression analysis was executed with three target genes (CpXR, BarA and CheA) that may be susceptible to sound stimulus. These genes were selected due to their similarity with genes from other bacteria that were detected to be susceptible to sound stimulus.52 Finally, a sound induction device was designed and constructed to ensure a uniform propagation of sound in commercially available liquid bioreactors with capacity of 1 and 2 L. The flowchart of all the experimental stages of the present work are shown in Figure 3.2..
(34) Chapter 3. Materials and Methods. 21. Frequency screening experiment. Sound induction device for flask. E. coli strain selection. Individual sound elements experiment. Sound elements interaction experiment. Sound induction device for bioreactor. Gene candidates selection. Primers design. Gene expression analysis. Figure 3.2. Flow chart that explains the sequence of the experimental stages of the present work.. 3.1. Materials 3.1.1. Chemicals and reagents. Luria-Bertani (LB) agar plates were used for viability measurements. For vial cryopreservation, E. coli was grown in LB broth and stored with 50% glycerol. MagicMediaTM autoinducible medium for T7 expression clones (Thermo Fisher Scientific) was used for E. coli protein expression. For protein extraction, a variant of B-PERTM Bacterial Protein Extraction Reagent (Thermo Scientific) was prepared by replacing octyl-β-glucoside (OG) with octylthioglucoside (OTG). Finally, QUANTI-LucTM (InvivoGen) was employed for luminescent protein quantification by adding 50 µL plus 10 µL of sample per well into a 96-well white plate. For gene expression quantification, primers for reverse transcription and QPCR amplification were synthesized by Integrated DNA technologies through Dr. Mary Crum. RNA extraction was performed with an RNeasy Mini Kit (Qiagen), cDNA synthesis was done using the ImProm-IITM Reverse Transcription System (Promega) and cDNA was quantified with the Rotor-Gene SYBR® Green PCR Kit (Qiagen)..
(35) Chapter 3. Materials and Methods. 22. 3.1.2. Escherichia coli strain construction To carry out the experiments on the effect of sound elements, E. coli was selected as a study model since it is a well-characterized microbial model, grows fast and is easy to handle. These sound experiments were carried out with an E. coli strain transformed with a plasmid (pUC57) that expresses an ScFv antibody fused with a bioluminescent reporter (NanoLuc®) which allows the quantitative identification of recombinant proteins. The plasmid, named “p10_NanoLuc” (Figure 3.3.), had the expression cassette synthesized by GenScript through a collaboration between by Dr. José Manuel Aguilar Yáñez and Dr. Mitoma. The vector was kindly provided by Dr. Aguilar and expressed in SHuffle® Express Competent E. coli (New England BioLabs).. Figure 0.3. Plasmid map of p10_NanoLuc: pUC57 containing an ScFv antibody (GenI = 768 bp) fused with a bioluminescent reporter (nLUC = 522 bp) and cloned in pUC57 (2710 bp) by EcoRV. Figure was created using SnapGene Viewer 4.1.9 (GSL Biotech LLC)..
(36) Chapter 3. Materials and Methods. 23. All E. coli culture experiments were initiated at the same biomass concentration. For this, preinoculums were produced by adding 10 µL of E. coli seed stock, 10 mL of LB broth and 10 µL of a carbenicillin solution (100 mg/mL; carb100) and allowed to grow for 16 h in 50 mL Falcon tubes. After that, E. coli inoculums were cultivated at 250 rpm and 37ºC in 1 L flasks containing 4 mL of pre-inoculum, 80 mL of LB broth and 800 µL carb100 solution. After 4 h, E. coli reached the logarithmic phase (OD600 ~ 0.4-0.6); all the media was centrifuged for 15 min at 3000xg and 4ºC, and the pellet was weighed. Enough sterilized LB + 15% glycerol was added accordingly to the pellet’s weight to achieve a biomass concentration of 11 mg/mL. Finally, the br oth was aliquoted. into 600 µL vials and stored at -80ºC for later use. It was determined that the OD600 value at the beginning of the fermentation would be close to 0.1 when adding 1.8 mL of stored vials into 20 mL of fresh broth. A different batch of vials was used for every independent experiment.. 3.1.3. Sound induction device A sound wave device that correctly replicates sound was designed using common materials that can be found in most biotechnological laboratories. Figure 3.4. shows an image of all the necessary material for the device construction (Figure 3.4.A) and its assembled form (Figure 3.4.B). A 250-mL sterilized flask (PYREX no. 4980) [1] was first introduced to a 600-mL beaker [2] where a plastic supporter [3] could be attached. A speaker (2W RMS, frequency response of 160Hz to 20 kHz) [4] was attached to the plastic supporter and connected to a sound generator [5], which in our case was a laptop computer (DELL Latitude 120L with Celeron M processor) with an audio interface (Steinberg USB 2.0, 24 bit/192 kHz) that designed and reproduced the sound wave stimulus through MATLAB® audio player (MathWorks). This system was assembled using an incubator clamp on a 1585 orbital shaking incubator (VWR). To be able to collect samples in situ without dismantling the device, a flexible tubing [6] that connects the flask to an external 250 mL beaker [7] was implemented. It crossed through the flask swab [8] and was plugged into one of the two outlets of the beaker bottle cap [9]; on the second outlet, a syringe [10] with a 0.45 mm filter [11] was attached to generate a pressure difference so that the sample could move from the flask to the beaker. When samples were not being collected, paper clamps [12] were used on the flexible tubing to stop the air flow. To prevent the generation of pounding noise between the flask and the beaker when the orbital shaking incubator was in use, the external surface of the flask was covered with cotton [13] as a shock absorber..
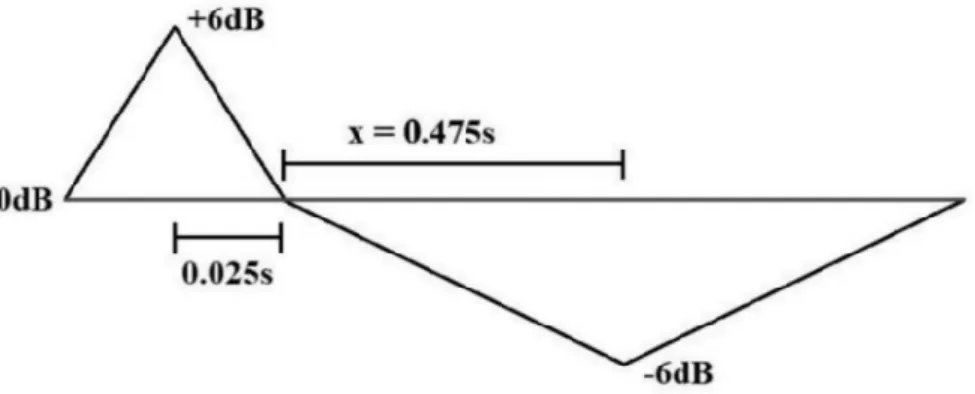
(37) Chapter 3. Materials and Methods. 24. This sound induction device was designed with the purpose of being used in any orbital shaker incubator without external sound interferences. When measuring the background noise of the system with a sonometer (Tool Dev), it was confirmed that its design creates a quiet environment inside the flask (~30 dB) which is lower than the background noise of the shaker (~65 dB). The swab allows sound to reach into the sterilized medium with low-intensity losses and its flexible tubing avoids dismantling the system every time a sample must be obtained thus preventing cross-contamination and experimental disturbance. In addition to the intensity validation, the sound that surrounds bacteria inside the device must not have distortions with respect to the source. This is important since the shape of the device can cause constructive or destructive wave interference due to the different ways in which the waves are reflected on its surface.40 Hence, to assure good sound quality, an MX150 condenser microphone (Shure) was used to confirm that sound waves inside the assembled device were the same as the designed ones.. 3.1.4. Sound wave design To investigate the effect of each sound element separately, it is necessary to have an adequate treatments design, which assures that only one sound element is modified at a time. All audio files were designed with a MATLAB® (MathWorks) audio system toolbox using a tone function design and saved as a .WAV file with an audiowrite function. Concerning the pulsed audios, their peaks were modeled as shown in Figure 3.5. These audio files comply with the continuous characteristic of pulse where the signal does not change abruptly. In addition, this design not only allows the same shape to be kept in all peaks regardless of the experiment, but also enables modification of the period by simply changing the distance between peaks..
(38) Chapter 3. Materials and Methods. 25. Figure 0.4. Parts of the sound wave inductor device (A) and its assembled form (B): [1] sterilized flask, [2] beaker, [3] plastic supporter, [4] speaker, [5] sound generator, [6] flexible tubing, [7] sample receiver, [8] flask swab, [9] lid with two outlets, [10] syringe, [11] 0.45 mm filter, [12] paper clamps, [13] cotton..
(39) Chapter 3. Materials and Methods. 26. Figure 0.5. Peak design for pulsed audios. Every peak has a fixed value of 0.05s where the peak’s midpoint has the maximum intensity 0.025s after the beginning of the peak. The interphase has a variable value (x) that adjusts specifically to the desired experiment. In the case of 1 cycle/s (60 bpm), the time between peaks is 0.95s, and the interphase’s midpoint has the minimum intensity 0.525s after the beginning of the peak.. Three sequential experimental stages were carried out with these audio files. The first stage was the individual sound elements experiment, in which the effects of isolated elements of the sound in biomass, viability and production yield of recombinant protein were studied. A parallel stage was the frequency screening experiment, in which the effect of a specific frequency throughout the audible spectrum (20-20,000 Hz) was studied in relation to the production of our bioluminescent reporter. Finally, a third stage called sound elements interaction experiment was performed in which, depending on the previous results, the effect of each sound element as well as their interactions were studied in relation to the production of our bioluminescent reporter as well.. 3.2. Sound elements experiments 3.2.1. Individual sound elements To study the biological effect (biomass, viability and production yield of recombinant protein in E. coli) of five sound elements (frequency, amplitude, duration, intermittence and pulse), specific sound wave audios were designed in which only one sound element differed at a time, as compared to a standard stimulus (Table 3.1.)..
(40) Chapter 3. Materials and Methods. 27. Table 0.1. Treatments for the individual sound elements experimental stage: control treatment (CTL), standard treatment (STD), frequency treatment (FRQ), amplitude treatment (AMP), duration treatment (DUR), intermittence treatment (IMT) and pulse treatment (PLS). Graphical representation for visualizing the difference between treatments in relation with STD. Frequency. Amplitude. Duration. Intermittence. Pulse. (Hz). (dB). (h). (min/min). (bpm). CTL. N/A. N/A. N/A. Continuous. 0. STD. 1000. 90. 24. Continuous. 0. FRQ. 5000. 90. 24. Continuous. 0. AMP. 1000. 110. 24. Continuous. 0. DUR. 1000. 90. 8. Continuous. 0. IMT. 1000. 90. 24. 20/20. 0. PLS. 1000. 90. 24. Continuous. 60. Treatment. Graphical representation. Sound parameters were chosen as follows: frequencies [1000 Hz & 5000 Hz] and amplitudes [90 dB & 110 dB] that have been reported to show the most growth in E. coli;8,10 duration as the sum of the E.coli’s lag and log phases [8 h] and the minimum time needed to produce maximum quantity of proteins using auto-inducible media while assuring the protocol can start every day at the same time [24 h]; intermittence that coincide with the typical duplication time [20 min] of E. coli under typical growth conditions61 and no intermittence [continuous stimulus]; and finally pulse that corresponds to 1 pulse per second [60 bpm] and its absence [0 bpm]. Accordingly, four different audio files were used for all treatments in this experiment: 1) a continuous-5000-Hz audio for the frequency treatment (FRQ), 2) an intermittent-1000-Hz audio for the intermittence treatment (IMT), 3) a pulsed-1000-Hz audio for the pulse treatment (PLS) and 4) a continuous-1000-Hz for the rest of the treatments. The difference between each treatment using the latter audio was achieved by certain modifications via audio player: the standard treatment (STD) was played as recorded, the amplitude treatment (AMP) was fixed at the maximum volume the speakers could reach without distortion (110 dB), duration treatment (DUR) was muted after the first 8 h and control treatment (CTL) was muted throughout the whole experiment. Additionally, all audio files were saved as 20-min-long archives except for the intermittent audio, which was 40-min-long (20 min sound + 20 min silence)..
(41) Chapter 3. Materials and Methods. 28. For each treatment, the setup was as follows: three E. coli vials that were stored at -80ºC were placed in the sterilized flask of the sound device with 20 mL of MagicMedia TM plus 20 µL of carb100 and left to grow for 24 h according to the desired sound treatment. The order of treatments was randomly assigned and done in independent quadruplicates.. 3.2.2. Frequency screening It has been reported that biological effects due to frequency display a non-linear response,8-11 in other words, a gradual increase in frequency does not necessarily correlate to a gradual increase of the studied biological effect. Thus, frequency screening of the audible spectrum (20-20,000 Hz) was performed to verify if an optimal specific frequency existed and if it could, by itself, have an effect in the production yield of recombinant protein in E. coli. Since a screening of all the frequencies of the audible spectrum is too high to be logistically feasible, a frequency selection was made using a standardized criteria suggested by many acoustic applications where sound falls in terms of 1/3-octave bands with center frequencies at: 80; 100; 125; 160; 200; 250; 315; 400; 500; 630; 800; 1,000; 1,250; 1,600; 2,000; 2,500; 3,150; 4,000; 5,000; 6,300; 8,000; 10,000; 12,500 and 16,000 Hz.40 This wide-frequency screening was followed by a narrower screening that had an 8-Hz bandwidth between tested frequencies in which the specific frequency that produced the highest amount of recombinant protein on the first screening was the midpoint. All audio files were saved as 5-min-long archives, and for each frequency, the setup was the same as the individual sound elements experiment. The order of treatments was randomly assigned and done in independent triplicates..
(42) Chapter 3. Materials and Methods. 29. 3.2.3. Sound elements interaction As stated previously, sounds found in nature are not pure tones but complex. This suggests that living organisms may have adapted to respond to more than one sound element at a time. Therefore, to study the effect of each sound element as well as their interactions in living organisms, a factorial design was employed by quantifying the production yield of recombinant protein in E. coli. The selection of sound elements was different in this experiment due to findings related to the importance of silence in the previous experimental stages. Since intermittence considers a periodic sound-silence phenomenon, it was broken down into two separate sub-elements: sound duration of intermittence (SD Inter) and silence duration of intermittence, which was redefined in relation to SD Inter as a “Sound/Silence Ratio (SS Rate)”. A way to visualize this parameter is. shown, for example, in the first experiment where there was a 20-min segment of sound followed by a 20-min segment of silence; the SS Rate was equal to 1. This was done to define the silence duration of intermittence as a nested element of intermittence; otherwise, it would be considered as an independent variable from intermittence, which, by definition, is not correct.. Three experimental phases were designed as shown in Table 3.2: 1) A fractioned factorial design which tests half of the possible combinations (16 combinations + 1 central point) of 5 sound elements by duplicate; 2) a complete factorial design which tests the combination of 2 sound elements related to oscillatory phenomena by triplicates; 3) a complete factorial design which tests the combination of 3 sound elements related to silence phenomena + 1 central point by triplicates. The order of treatments was randomly assigned..
(43) Chapter 3. Materials and Methods. 30. Table 0.2. Conditions for the sound elements interaction experiment stage: all sound elements (Group A), oscillatory elements (Group B) and silence-related elements (Group C). Sound. Frequency. SD Inter. SS Ratio. Duration. Pulse. elements. (Hz). (min). (min/min). (h). (bpm). Group A. All sound elements. A01. 500. 20. 0.5. 8. 240. A02. 10000. 20. 0.5. 8. 0. A03. 500. 120. 0.5. 8. 0. A04. 10000. 120. 0.5. 8. 240. A05. 500. 20. 2. 8. 0. A06. 10000. 20. 2. 8. 240. A07. 500. 120. 2. 8. 240. A08. 10000. 120. 2. 8. 0. A09. 500. 20. 0.5. 24. 0. A10. 10000. 20. 0.5. 24. 240. A11. 500. 120. 0.5. 24. 240. A12. 10000. 120. 0.5. 24. 0. A13. 500. 20. 2. 24. 240. A14. 10000. 20. 2. 24. 0. A15. 500. 120. 2. 24. 0. A16. 10000. 120. 2. 24. 240. ACP. 5250. 70. 1.25. 16. 120. Group B. Only oscillatory elements. B01. 500. N/A. N/A. 24. 0. B02. 500. N/A. N/A. 24. 240. B03. 10000. N/A. N/A. 24. 0. B04. 10000. N/A. N/A. 24. 240. Group C. Only elements related to silence. C01. 500. 20. 0.5. 8. 0. C02. 500. 20. 0.5. 24. 0. C03. 500. 120. 0.5. 8. 0. C04. 500. 120. 0.5. 24. 0. C05. 500. 20. 2. 8. 0. C06. 500. 20. 2. 24. 0. C07. 500. 120. 2. 8. 0. C08. 500. 120. 2. 24. 0. CCP. 500. 70. 1.25. 16. 0.
(44) Chapter 3. Materials and Methods. 31. The levels of the factorial design were selected as follows: the frequencies that generated the highest and the lowest protein production yield on the frequency screening experiment, 500 Hz and 10,000 Hz respectively; a high pulse that is not shadowed by frequency (240 bpm) and no pulse at all (0 bpm); full experiment duration (24 h) and E. coli exponential phase duration (8 h); high SD Inter (120 min) which corresponds to E. coli duration of lag phase, and low SD Inter (20 min) which corresponds to E. coli duplication time; high SS Rate (2.0) where silence duration is half of SD Inter, and low SS Rate (0.5) where silence duration is double of SD Inter. Intensity had a fixed value of 90 dB. All audio files were saved as 24-h-long archives, and for each combination, the setup was the same as the sound elements experiment.. 3.2.4. Escherichia coli biomass concentration and viability determination Many studies commonly determine bacterial growth by measuring biomass with optical density or total weight. However, either method is unspecific because it considers both living and dead cells. Therefore, viability was included to complement bacterial growth measurements because it allows the detection of only living organisms. Biomass concentration was determined by taking 100 µL of broth sample using the sample receiver from the sound induction device, then diluting it 1:10 and measuring the OD600 at t = 0, 1, 2, 4, 6, 8, 12, 18 and 24 h with a UV-Vis spectrophotometer (Genesys 10S; Thermo Fisher Scientific). Viability was determined at t = 0, 1, 2, 4, 6, 8, 12, 18 and 24 h by counting colony forming units (CFUs) grown on LB petri dishes (20 mL distilled water, 20 mg LB/mL water, 1.5% agar/mL water) using single plate-serial dilution spotting method (SP-SDS) where a serial dilution is performed with 50 µL of each sample and only the last four dilutions (103 – 106) are spotted on the petri dish to be counted directly after 16 h of growth.62 To prevent contamination, every time a sample was taken, the sample receiver was washed with 70% ethanol and flamed before reattachment.. 3.2.5. Recombinant protein production yield determination For protein extraction, the B-PER® Bacterial Protein Extraction Reagent (Thermo Scientific) protocol was followed with certain modifications. Firstly, after 24 h of growth, the medium was centrifuged 10 min at 5000xg and 4ºC (Allegra 64R, Beckman Coulter). Then, the supernatant.
(45) Chapter 3. Materials and Methods. 32. was discarded, and the pellet weighed. A variant of B-PER® Bacterial Protein Extraction Reagent (0.5% OTG and 25 mM Tris pH 7.5) was added in a proportion of 4 times the weighted mass. Afterward, the pellet was vortexed, and an aliquot of 500 µL was isolated to be centrifuged for 5 min at 15000xg and 20ºC. Finally, the supernatant was acquired and mixed with 500 µL of sterilized glycerol. Every 1 mL vial was stored at -20ºC until every single aliquot for every treatment was obtained. For the recombinant protein quantification yield, relative luminescence units (RLU) were measured (Synergy HT, BioTek) by mixing 10 µL of sample with 50 µL of QUANTI-LucTM (InvivoGen) following the providers instructions on a white 96-well plate. The luminescence of every independent treatment quadruplicate was measured between 7-9 times, and their average was divided by the corresponding wet mass. The calibration curve was generated with a 1:10 serial dilution of 0.2 µg of NanoLuc® standard (regression equation: Log(RLU) = 0.9297Log(µg NanoLuc) +9.3888).. 3.3. Gene expression analysis The study of the effect of sound over responses such as viability, biomass concentration and protein production yield give an insight of the biological mechanisms that are involved. As part of the present research work, a study of gene expression was conducted in order to identify genes that are up-regulated due to sound and use their molecular mechanism for the development of bioprocessing sound-based technology.. Although there are studies that have confirmed a change in gene expression due to sound exposure,7,30-32 all of them have been identified exclusively in plant models. Nevertheless, there is one study that used sound stimuli to up-regulate 342 genes in Chromobacterium violaceum.52 Consequently, this is the first report of a bacterial transcriptome influenced by sound. Based on the results of this publication about the genes that had the most positive regulation, three genes from C. violaceum that had analogous functions in E. coli were selected. The selected genes are involved in stress response (CpxR), carbon storage regulator kinase (BarA) and chemotaxis (CheA). Since the objective of this methodology is the identification of differentially regulated genes, the 2-∆∆Ct method was performed.63 This method consists in determine the relative comparison of gene.
(46) Chapter 3. Materials and Methods. 33. expression by calculating the cycle threshold (Ct) values from the target gene with respect to a set of housekeeping genes. Ct is the cycle where the logarithmic phase of the amplification begins and is characterized by the fluorescence exceeding the background level where smaller values represent a higher template quantity.. Because Ct is represented in a logarithmic scale, it must be subtracted from the Ct value of the housekeeping genes to normalize the gene expression per treatment (∆Ct) where negative values represent upregulating genes and positive values represent downregulating genes. To obtain the relative expression change (∆∆Ct) which describes the expression fold for each gene, the normalized ∆Ct value from the treated samples must be subtracted from the normalized ∆Ct value from the untreated samples. Finally, to visualize the expression fold in a linear way, the formula two raised to the minus ∆∆Ct was used.. 3.3.1. Primer design Since the experimental design seeks to compare the expression between genes that were stimulated by sound and genes that were not, a comparative Ct (2-∆∆Ct) method through a QPCR was performed. QPCR was opted because of its advantages: time-effective, high specificity, reliable and informative because it monitors the accumulation of a specific product during each cycle. However, to provide this specificity, the design of specific primers is required. Accordingly, several considerations have been made for the primer design. First, since it is recommended not to work with just one housekeeping gene;64 four were selected to increase the normalization robustness: 16S ribosomal RNA (ssrA), 3-phenylpropionate MFS transporter (hcaT), L-idonate/5-ketogluconate/gluconate transporter (ldnT) and uroporphyrin III Cmethyltransferase (cysG). These have already been found suitable for the study of stress gene response in E. coli.65,66 Moreover, the primers that detect these genes have already been designed and tested,66 plus they generate amplicons of ~100 bp which is recommended for a good QPCR efficiency.67 Second, to increase the selectivity of the experiment, primers were designed to amplify a region of ~300 bp, which becomes the template for the primers that amplify the region of ~100 bp (Table 3.3.1.). Finally, the melting temperature (Tm) was kept between 57-60ºC, with a GC% between 50-60% and no primer dimers were detected (OligoAnalyzer Tool, Integrated DNA Technologies)..
Figure


+7


![Figure 0.4. Parts of the sound wave inductor device (A) and its assembled form (B): [1] sterilized flask, [2]](https://thumb-us.123doks.com/thumbv2/123dok_es/2003080.500299/38.892.136.727.159.919/figure-parts-sound-inductor-device-assembled-sterilized-flask.webp)
Documento similar
The expansionary monetary policy measures have had a negative impact on net interest margins both via the reduction in interest rates and –less powerfully- the flattening of the
Jointly estimate this entry game with several outcome equations (fees/rates, credit limits) for bank accounts, credit cards and lines of credit. Use simulation methods to
In zucchini, we tested the behavior of four Salmonella serotypes (Typhimurium, Typhi, Gaminara and Montevideo) and a cocktail of three Escherichia coli strains on whole
showed that CNPs exhibited size-dependent and concentration-dependent growth inhibition of both Escherichia coli (E. coli) and Bacillus subtilis, but no adverse effects
To test whether the localization of ZipA and FtsZ is similar when the transmembrane region of ZipA is overproduced to the localization observed under the overproduction of the
In this work, we have addressed the expression of the FKTN (fukutin) and FKRP genes in the retina of mammals, and characterized the distribution pattern of their protein products
middle‐income countries (LMIC) (1,2). Together with Shigella spp., enteroaggregative Escherichia
In the present study we assessed the possible effects of changing duration of pre-heading phases (the leaf and spikelet initiation phase, LS, SE and total time
