Review Copy
Prediction of fracture loads in PMMA specimens using the Equivalent Material Concept and the Theory of Critical
Distances combined criterion
Journal: Fatigue & Fracture of Engineering Materials & Structures Manuscript ID FFEMS-7067
Manuscript Type: Original Contribution Date Submitted by the Author: 11-Jul-2017
Complete List of Authors: Cicero, Sergio; University of Cantabria, Department of Materials Science and Engineering;
Torabi, Ali Reza; University of Tehran, Fracture Research Laboratory Madrazo, Virginia; Centro Tecnológico de Componentes
Azizi, Payman
Keywords: Notch, Fracture, Polymethyl-methacrylate
Review Copy
Prediction of fracture loads in PMMA specimens using the Equivalent Material Concept and the Theory of Critical Distances combined criterion
S. Ciceroa, A.R. Torabib, V. Madrazoc, P. Azizid
a
LADICIM (Laboratory of Materials Science and Engineering), University of Cantabria. E.T.S. de Ingenieros de Caminos, Canales y Puertos, Av/Los Castros 44, 39005,
Santander, Spain
b
Fracture Research Laboratory, Faculty of New Sciences & Technologies, University of Tehran, P.O. Box 14395-1561, Tehran, Iran
c
Centro Tecnológico de Componentes-CTC, C/Isabel Torres nº1, 39011, Santander, Cantabria, Spain
d
Department of Mechanical Engineering, Iran University of Science and Technology, P.O. Box 16846-13114, Tehran, Iran
Abstract
This paper provides a methodology for the prediction of fracture loads in notched materials that combines the Equivalent Material Concept with the Theory of Critical Distances. The latter has a linear-elastic nature, and requires material (critical distance) calibration in those cases where the non-linear material behaviour is significant. The calibration may be performed by fracture testing on notched specimens, finite elements modelling or a combination of fracture and simulation. In any case, it may constitute a major issue when applying the Theory of Critical Distances on an industrial level. The proposed methodology sets out to define an equivalent linear-elastic material on which the Theory of Critical Distances may be applied through its basic formulation and without any previous calibration of the corresponding critical distance. It has been applied to PMMA Single Edge Notch Bending specimens, providing accurate predictions of fracture loads.
Keywords: notch, fracture load, Polymethyl-methacrylate 1. Introduction
The analysis of fracture processes on materials and structural components containing notches is the subject of an extensive pool of research work1-41. Understanding notches as any kind of macroscopic stress risers in the material, these may be responsible for structural failures caused by static fracture-plastic collapse processes, or the initiators of fatigue processes which may cause a crack to initiate, propagate, and eventually lead to failure. In other words, there are many practical situations where the defects responsible for structural failures are not necessarily crack-like defects. In such cases, if the defects are blunt, it is generally over-conservative to proceed on the assumption that the defects 2 3 4 5 6 7 8 9 10 11 12 13 14 15 16 17 18 19 20 21 22 23 24 25 26 27 28 29 30 31 32 33 34 35 36 37 38 39 40 41 42 43 44 45 46 47 48 49 50 51 52 53 54 55 56 57 58 59
Review Copy
behave like sharp cracks, given that notched components develop a load-bearing capacity that is greater than that developed by cracked components.
Consequently, the particular nature of notches makes it necessary to develop specific approaches for the fracture analysis of this type of defects. In this sense, the analysis of the fracture behaviour of notches can be performed using different criteria, some of these being related to each other. Some examples are the different methodologies included within the Theory of Critical Distances (TCD)1-8, the Global Criterion9,10, Cohesive Zone models11-15, statistical models16-17, mechanistic models18, the Strain Energy Density (SED) criterion19-36, etc. The TCD methodologies have been successfully applied to different failure mechanisms (e.g., fracture, fatigue) and materials, and are particularly simple to implement in structural integrity assessments7,
37-41
. The TCD is based on linear-elastic assumptions, although it has been successfully applied to plastic situations, either through the direct consideration of elastic-plastic stress fields2, or through the assumption of linear-elastic behaviour (stress field) and the corresponding calibration of the inherent strength (see section 2)4,5. In any case, when the material behaviour is not completely linear-elastic, the application of the TCD requires the fracture testing of notched specimens, finite elements modelling, or both, in order to calibrate the material parameters involved (the critical distance -L-, and the inherent strength, σ0). This complicates the application of the TCD on an industrial
level.
At the same time, when analysing an elastic-plastic material, Torabi42,43 has proposed the use of the Equivalent Material Concept (EMC) to define an equivalent linear-elastic material that develops the same fracture behaviour. This proposal has been combined with the TCD44-50 or the Strain Energy Density (SED)51-55, providing accurate analyses of the fracture behaviour of different materials, such as Al 6061-T6 and Al 7075-T6. This paper analyses the fracture behaviour of Polymethyl-methacrylate (PMMA) Single Edge Notched Bending (SENB) fracture specimens containing U-notches. The fracture behaviour of PMMA in notched conditions is well known, and has been previously analysed through different methodologies4,5,14,23, all of them having significant complexity for common engineering practice. This work provides additional analyses of the fracture behaviour of this material, and verifies whether or not the straightforward combination of EMC and TCD (from now on, the EMC-TCD criterion), provides fracture assessment results with comparable accuracy to that provided by other methodologies (e.g., TCD, SED criterion, Cohesive Zone models, etc).
With all this, section 2 provides a theoretical overview of the Equivalent Material Concept (EMC), the Theory of Critical Distances (TCD) and the EMC-TCD criterion, section 3 describes the experimental programme, section 4 provides the fracture load predictions obtained by using the EMC-TCD criterion and the corresponding discussion, and section 5 gathers the main conclusions.
2 3 4 5 6 7 8 9 10 11 12 13 14 15 16 17 18 19 20 21 22 23 24 25 26 27 28 29 30 31 32 33 34 35 36 37 38 39 40 41 42 43 44 45 46 47 48 49 50 51 52 53 54 55 56 57 58 59
Review Copy
2. Theoretical background 2.1. The Theory of Critical Distances
The Theory of Critical Distances (TCD) is in essence a set of methodologies, all of which use a material length parameter (the critical distance, L) when performing fracture or fatigue assessments1. The origin of the TCD is located in the works of Neuber56 and Peterson57, but it has been in the last two decades that this theory has been thoroughly developed for the analysis of different types of materials, failure processes and conditions (e.g., linear-elastic vs. elastoplastic)1.
The aforementioned critical distance is generally referred to as L and its expression, in fracture analyses, is:
2 0 1 = σ π c K L (1)
Kc being the material fracture toughness and σ0 being a material strength parameter
usually referred to as the inherent strength. This parameter is usually larger than the ultimate tensile strength (σu), in case it requires calibration. Only in certain materials
where there is a linear-elastic behaviour at both the micro and the macro scale (e.g., fracture of ceramics) does σ0 coincide with σu. In such cases, the application of the TCD
does not require calibration, given that L is directly obtained from equation (1), the material fracture toughness and the material ultimate tensile strength.
Two of the methodologies included within the TCD are especially simple to apply: the Point Method (PM) and the Line Method (LM). Both of them are based on the stress field at the defect tip and, as stated by Taylor1, the corresponding predictions are very similar.
The PM is the simplest methodology, and it proposes that fracture takes place when the stress at a distance of L/2 from the defect tip reaches the inherent strength (σ0):
0 2 σ σ = L (2)
On the other hand, the LM proposes that fracture takes place when the average stress along a distance equal to 2L (starting from the defect tip) reaches the inherent strength σ0:
( )
∫
= L dr r L 2 0 0 2 1 σ σ (3)The TCD (and therefore, both the PM and the LM) allows the fracture assessment of components containing notches to be performed. However, for those materials on which σ0 does not coincide with σu (e.g., most polymers, metals, etc), the former parameter
requires calibration. This may be performed by undertaking an experimental programme 2 3 4 5 6 7 8 9 10 11 12 13 14 15 16 17 18 19 20 21 22 23 24 25 26 27 28 29 30 31 32 33 34 35 36 37 38 39 40 41 42 43 44 45 46 47 48 49 50 51 52 53 54 55 56 57 58 59
Review Copy
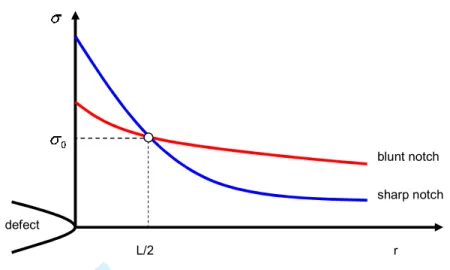
on notched specimens with different notch radii, and defining L as that value providing the best fit to the experimental results1,5, by finite elements simulation of specimens with different notch radii (the superposition of the corresponding stress fields at failure directly provides L and σ0, see Figure 1)1,5,6, or by a combination of experimental
programme and finite elements modelling. In any case, the calibration process constitutes a major issue when applying the TCD methodologies and it is a clear obstacle to their extensive application in industrial practice.
2.2. The Equivalent Material Concept
In this subsection, the Equivalent Material Concept (EMC) proposed originally by Torabi42 is presented with the aim of equating a real ductile material with elastic-plastic behaviour to a virtual brittle material with perfectly elastic behaviour. A summary of the concept is presented in the following.
The famous power-law equation indicating the tensile stress-strain relationship in the plastic region can be found in equation (4) in which the parameters σ, εP, K, and n are
the true stress, the true plastic strain, the hardening coefficient, and the strain-hardening exponent, respectively.
n P
K
ε
σ
= (4)As seen in figure 2, which is the typical engineering stress-strain curve for a ductile material, the Strain Energy Density (SED) is the area under the curve until the beginning of the necking (peak point). Considering the total SED as the summation of the SEDs in elastic and plastic regions, one can write
P Y Y p e tot P Y P d SED SED SED
σ
ε
σ
ε
ε ε∫
+ = + = 2 1 ) ( ) ( ) ( . (5)where σY, εY, and εYP are the yield strength, the elastic strain at yield point, and the true
plastic strain at yield point, respectively.
By substituting equation (4) into equation (5) and considering Hooke’s Law (σY=EεY),
we get ] ) ( ) [( 1 2 2 ) ( 1 1 2 2 . + + − + + = + =
∫
Y n P n P Y P n P Y tot n K E d K E SED P Y Pε
ε
σ
ε
ε
σ
ε ε (6)Assuming that the offset yield point is equal to 0.2% (i.e. εYP=0.002), then
] ) 002 . 0 ( ) [( 1 2 ) ( 1 1 2 . + + − + + = n n P Y tot n K E SED
σ
ε
(7)The crack initiation in the ductile material will take place just when the ultimate load is reached. Therefore, the total SED (the area under the curve) should be calculated until 2 3 4 5 6 7 8 9 10 11 12 13 14 15 16 17 18 19 20 21 22 23 24 25 26 27 28 29 30 31 32 33 34 35 36 37 38 39 40 41 42 43 44 45 46 47 48 49 50 51 52 53 54 55 56 57 58 59
Review Copy
this point, which is called the necking instance. Consequently, the εP is substituted by εu,True (true plastic strain at maximum load) in the following equation:
] ) 002 . 0 ( ) [( 1 2 ) ( , 1 1 2 + + − + + = n n True u Y necking n K E SED
σ
ε
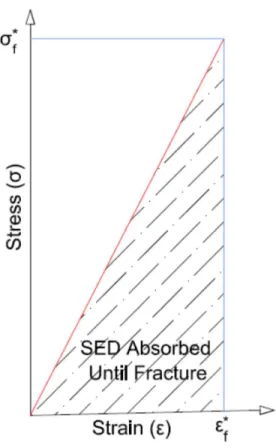
(8)A common stress-strain curve for the virtual brittle material is illustrated in Figure 3. As shown in this figure, the total strain energy absorbed until fracture is computed as
σf*εf*/2, where σf* and εf* are the tensile stress and the strain at crack initiation for the
virtual brittle material, respectively. Since the main assumption of EMC is to have the same Young modulus and K-based fracture toughness (KIc or Kc) for both ductile and
virtual brittle materials, one can write
E SED EM f 2 ) ( 2 *
σ
= (9)where E is the Young modulus for both the original ductile and the virtual brittle materials.
As mentioned above, the Equivalent Material Concept (EMC) equates a ductile material having valid K-based fracture toughness and elastic modulus to a virtual brittle material having the same values but with a different tensile strength. Therefore, setting equations 8 and 9 to be equal leads to:
] ) 002 . 0 ( ) [( 1 2 2 1 1 , 2 2 * + + − + + = n n True u Y f n K E E
ε
σ
σ
(10)Finally, the following equation is proposed by EMC for calculating the σf*:
] ) 002 . 0 ( ) [( 1 2 1 1 , 2 * + − + + + = n n True u Y f n EK
ε
σ
σ
(11)where εu,True (the true plastic strain at peak point) can be calculated from the εu
(engineering plastic strain) by the following expression: εu,True=ln(1+εu).
The σf* calculated by equation (11) and a valid fracture toughness can be used
conveniently in different brittle fracture criteria, e.g. TCD, to predict the crack initiation in ductile components containing a notch.
In the following sections, the experimental programme is presented and the corresponding results are utilized to verify the validity of the EMC-TCD criterion.
3. Experimental programme 2 3 4 5 6 7 8 9 10 11 12 13 14 15 16 17 18 19 20 21 22 23 24 25 26 27 28 29 30 31 32 33 34 35 36 37 38 39 40 41 42 43 44 45 46 47 48 49 50 51 52 53 54 55 56 57 58 59
Review Copy
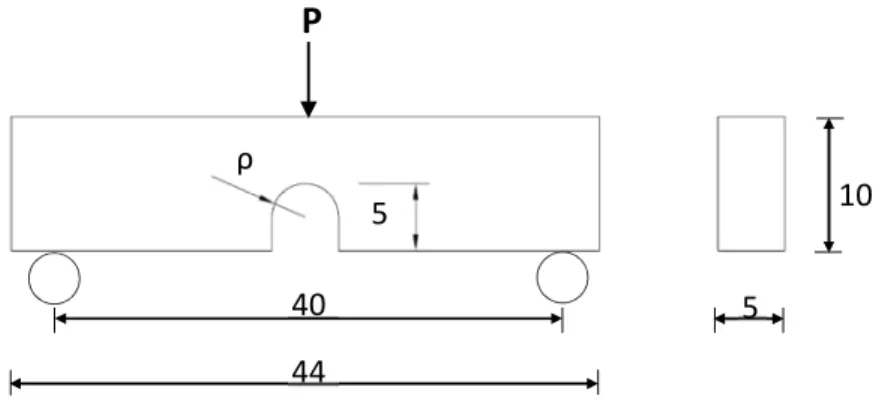
The experimental programme covers the definition of the stress-strain tensile curve of the material (following ASTM D63858), which is necessary for the application of the EMC method, and the fracture tests performed on SENB specimens containing U-shaped notches (see Figure 4). These fracture tests (32 in total) were performed following ASTM D504559, with the notch radii varying between 0 mm (crack-like defect) and 2.5 mm. Details on the experimental procedures are gathered in Cicero et al.5.
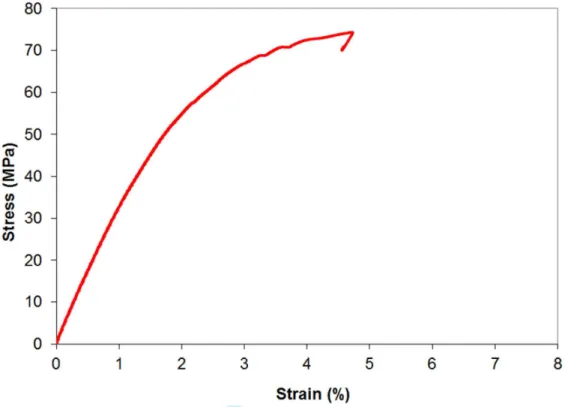
Figure 5 shows the obtained stress-strain curve (engineering variables) used in this work, revealing a clear non-linear behaviour. The main material parameters are gathered in Table 1, E being the Young´s modulus, σ0.2 being the 0.2% proof strength, σu the
ultimate tensile strength and emax the maximum strain. This curve is used in Section 4 to
derive σf* and, thus, the tensile behaviour of the equivalent linear-elastic material.
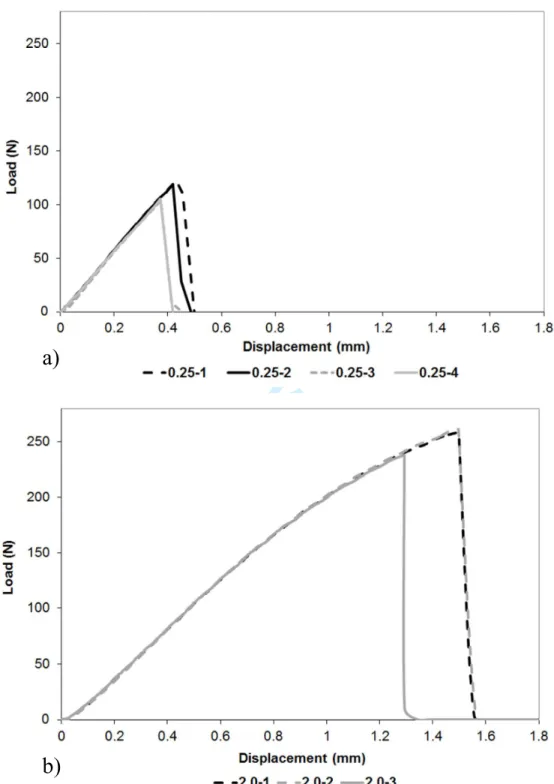
Concerning the fracture tests, a total of eight sets of tests were performed, corresponding to eight different notch radii (from 0 mm up to 2.5 mm), each set being tentatively composed of five tests. The notches were performed by machining, except for those whose notch radius was close to zero, which were generated by sawing a razor blade across an initial notch root. Table 2 gathers the different tests with the corresponding geometries and the resulting fracture loads. Some of the sets do not include the initial five intended tests, given that some of the specimens were incorrectly machined. Details of the experimental procedure and the obtained load-displacement curves may be consulted in Cicero et al.5, with some examples of the above being shown in Figure 6.
The results of the fracture tests reveal that there are sets in which there is significant scatter in the fracture loads (e.g., specimens with 0.50 mm radius). It can also be observed that there is an evident loss of linearity in the load-displacement curves obtained in specimens with higher radii, although such losses are noticeably less pronounced than that observed in the tensile test.
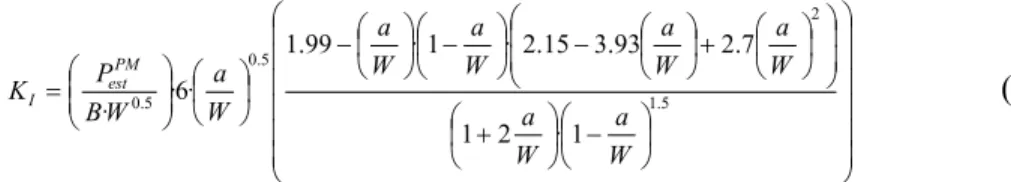
Finally, the results obtained in the three cracked specimens have been used to derive the material fracture toughness (Kc)59. The fracture toughness is easily derived from the
critical load and both the specimen and crack geometries (SENB specimen):
− + + − − − = 1.5 2 5 . 0 5 . 0 max 1 · 2 1 7 . 2 93 . 3 15 . 2 · 1 · 99 . 1 · 6 · · W a W a W a W a W a W a W a W B P Kc (12)
The average value of Kc derived from the three tests is 2.04 MPa·m1/2 (see Table 1).
4. EMC-TCD fracture load predictions 4.1. Calibration of the Equivalent Material 2 3 4 5 6 7 8 9 10 11 12 13 14 15 16 17 18 19 20 21 22 23 24 25 26 27 28 29 30 31 32 33 34 35 36 37 38 39 40 41 42 43 44 45 46 47 48 49 50 51 52 53 54 55 56 57 58 59
Review Copy
The tensile curve shown in Figure 5 has been used to define the equivalent linear-elastic material following the Equivalent Material Concept formulation gathered in Subsection 2.2. The equivalent material maintains the same elastic modulus as that observed in the real material (3.40 GPa, see Table 1), but the tensile strength of the equivalent material (σf*) is 129.4 MPa, which is significantly higher (1.73 times higher) than that observed
experimentally. These two parameters (E and σf*) are sufficient to define the tensile
behaviour of the equivalent material, and allow the fracture behaviour of the real (non-linear) material to be determined based on linear-elastic assumptions.
4.2. Derivation of fracture load predictions
Once the material properties of the equivalent linear-elastic material are known, the linear elastic formulation of the TCD can be directly applied. Assuming a perfectly linear-elastic behaviour implies that the value of the critical distance (L) can be directly obtained from equation (1) and considering that the inherent strength (σ0) is equal to the
tensile strength of the equivalent material (σf*). Thus, the calibration process required to
define L (and σ0) in the real material is avoided. In this case, L is 0.079 mm, which is
slightly lower that that obtained by Cicero et al.5 (L = 0.105 mm) through finite elements calibration.
As mentioned above, one of the main purposes of this work is to provide a simple methodology for the assessment of notched components. For this reason, instead of using finite elements modelling to determine the fracture load predictions, the use of well known accurate analytical solutions is proposed. In the case of U-shaped notches, the Creager-Paris solution60 for the stress field at the notch tip is widely accepted1. Creager and Paris state that the stress field ahead of the notch tip is equal to that ahead of the crack tip but displaced a distance equal to ρ/2 along the x-axis:
( )
(
)
(
2)
32 2 ρ ρ π σ + + = r r K r I (13)where KI is the mode I stress intensity factor in cracked conditions, ρ is the notch radius
and r is the distance existing from the notch tip to the point being assessed. Equation (13) may be used to derive the estimations of the critical loads through the TCD.
If the PM is considered, the corresponding fracture condition for a particular notch radius (ρ) would be:
(
)
(
)
(
)
∗ = + + = I f L L K L σ ρ ρ π σ 2 3 2 / 2 2 / (14)Thus, equation (14) allows the value of KI at fracture to be obtained. Finally, the
estimation of the critical load (ܲ௦௧ ெ
) is easily derived from: 2 3 4 5 6 7 8 9 10 11 12 13 14 15 16 17 18 19 20 21 22 23 24 25 26 27 28 29 30 31 32 33 34 35 36 37 38 39 40 41 42 43 44 45 46 47 48 49 50 51 52 53 54 55 56 57 58 59
Review Copy
− + + − − − = 1.5 2 5 . 0 5 . 0 1 · 2 1 7 . 2 93 . 3 15 . 2 · 1 · 99 . 1 · 6 · · W a W a W a W a W a W a W a W B P K PM est I (15)If the LM is considered, it is necessary to determine the average stress (σav) over the
distance r = 0 to 2L, giving1: + − + = L L L KI av 2 2 2 2 2 2 2 ρ ρ ρ π σ (16)
Establishing the fracture condition proposed by the LM, KI is easily derived from
equation (17) for any given notch radius:
∗ = + − + f I L L L K σ ρ ρ ρ π 2 2 2 2 2 2 2 (17)
Once KI is obtained, the estimations of the fracture loads (ܲ௦௧ ெ ) are straightforward: − + + − − − = 5 . 1 2 5 . 0 5 . 0 1 · 2 1 7 . 2 93 . 3 15 . 2 · 1 · 99 . 1 · 6 · · W a W a W a W a W a W a W a W B P K LM est I (18)
Here, it is important to notice that the whole process only requires the calibration of the equivalent material, which is easily completed from a tensile test, with no need for finite elements modelling and/or calibration fracture tests.
4.3. Results and discussion
Table 2 shows the fracture load predictions obtained through the application of the EMC and the TCD (both the PM and the LM methodologies). Figure 7 shows the same results graphically. It can be observed that the predictions provided when using the Point Method are very accurate, with a maximum deviation (when compared to the average fracture load for each notch radius) of -11.7%, which is obtained for a notch radius of 1.0 mm. It can be observed that, when using the PM, there is not a clear tendency of overestimation or underestimation of the fracture loads, with the points in Figure 7 being located indistinctly over and below the 1/1 line. Overall, the average error is +3.3%. The predictions are good even for the higher radii, for which the Creager-Paris equation validity range is questionable (the Creager-Paris equation is defined for narrow defects, on which ρ << a).
2 3 4 5 6 7 8 9 10 11 12 13 14 15 16 17 18 19 20 21 22 23 24 25 26 27 28 29 30 31 32 33 34 35 36 37 38 39 40 41 42 43 44 45 46 47 48 49 50 51 52 53 54 55 56 57 58 59
Review Copy
When using the LM, the error of the predictions is still reasonable, considering the high scatter of the experimental results, but there is a clear tendency towards the overestimation of the fracture loads. The maximum deviation regarding the average experimental fracture load for a particular notch radius is +23.1%, the average value being +11.7%. Again, the results for higher radii do not seem less accurate than those obtained for notch radii for which the Creager-Paris assumptions are completely fulfilled.
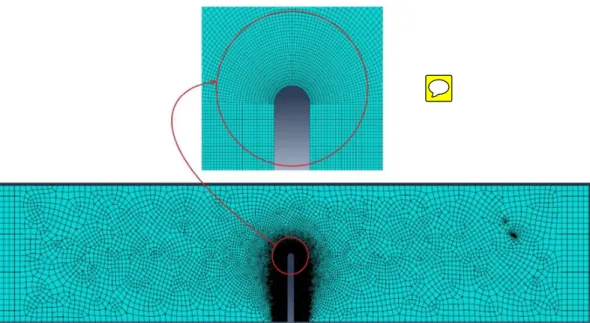
In order to determine the type of failure regime for the tested notched PMMA specimens, i.e. the small-scale yielding (SSY), moderate-scale yielding (MSY), or large-scale yielding (LSY), a set of elastic-plastic finite element (FE) analyses were performed on the SENB specimen, shown in figure 4, in ABAQUS software under plane-strain conditions. As with the material properties, the true tensile stress-strain curve of the tested PMMA was given to the FE software point-by-point. Meanwhile, to reach the size of the plastic region around the notch at the onset of crack initiation from the notch tip, the mean experimentally obtained maximum load (i.e. average of the four values presented in 4th column of Table 2) was applied to each FE model. The FE models were meshed by quad shaped elements (see figure 8) and the distribution of Von-Mises stress around the U-notch tip at the onset of crack initiation is illustrated in Figure 9. The results for two cases with different notch radii (one for near-crack condition (0.25 mm) and the other for higher radius (2.5 mm)) indicate that the size of the plastic zone increases as the radius of the U-notch increases (see Figure 9). This can be attributed to the stress gradient near the notch tip. For the lower notch radius, the stress gradient at the notch neighbourhood is significantly higher and hence, the plastic zone is more localized and its size is relatively small. In contrast, for the higher notch radius, the stress gradient at the notch tip vicinity is lower, meaning a larger plastic zone size. For the notch radii equal to 0.25 mm and 2.5 mm, about 8% and 25% of the ligaments experience plastic deformations at failure, respectively, meaning that the small notch radius fails by the SSY regime, while the large notch radius by the MSY regime. The results of the elastic-plastic FE analyses presented in Figure 9 strongly confirm the experimentally obtained load-displacement curves presented in Figure 6, in which the curves for the small radius are almost linear while those for the large radius exhibit a moderate nonlinear portion as a result of the moderate plastic deformations around the notch tip.
5. Conclusions
This paper provides a methodology for the predictions of fracture loads in PMMA containing U-shaped notches. This material has no fully linear-elastic material, neither on its tensile curve nor on the fracture specimens with higher radii. This means that a calibration process is required when analysing fracture processes using the Theory of Critical Distances (TCD). This calibration requires finite elements modelling, fracture tests on specimens with different notch radii, or a combination of finite elements with fracture testing. In order to avoid such a calibration, it is proposed to combine the TCD with the Equivalent Material Concept (EMC), on which the non-linear material is 2 3 4 5 6 7 8 9 10 11 12 13 14 15 16 17 18 19 20 21 22 23 24 25 26 27 28 29 30 31 32 33 34 35 36 37 38 39 40 41 42 43 44 45 46 47 48 49 50 51 52 53 54 55 56 57 58 59
Review Copy
substituted by a perfectly linear-elastic material. This leads to the EMC-TCD criterion, with fully linear-elastic formulation and without any need for calibration processes beyond the equivalent material itself which, in any case, is a straightforward calibration performed from the material stress-strain tensile curve. Moreover, in order to avoid any finite elements modelling for the estimation of fracture loads, analytical stress fields are used (Creager-Paris, in this case).
Under all these assumptions, and considering the scatter associated to the fracture processes being analysed, the obtained predictions of fracture loads have been noticeably accurate, especially when using the Point Method (PM) as the TCD methodology. In such a case, the average deviation between the predicted fracture load and the corresponding average experimental fracture load has been +3.3 %, with a maximum deviation of -11.7%. When using the Line Method (LM), the average deviation has been +11.7%, with a maximum of +23.1%.
Both the load-displacement curves of the SENB PMMA specimens recorded experimentally and the plastic zone size determined numerically confirmed the ductile failure of the U-notched specimens by considerable plastic deformations around the notch tip (particularly for higher notch radii). For such notched components for which the plastic zone effects on the fracture behaviour cannot be ignored, the failure criteria in the context of strictly linear elastic notch fracture mechanics (LENFM) could not accurately be utilised without employing EMC.
Acknowledgement
The authors of this work would like to express their gratitude to the Spanish Ministry of Science and Innovation for the financial support of the project MAT2014-58443-P: “Análisis del comportamiento en fractura de componentes estructurales con defectos en condiciones debajo confinamiento tensional”, on the results of which this paper is based.
References
[1] Taylor D (2007). The Theory of Critical Distances: A New Perspective in Fracture
Mechanics. Elsevier, UK.
[2] Susmel L, Taylor D (2008). On the use of the Theory of Critical Distances to predict static failures in ductile metallic materials containing different geometrical features.
Eng. Fract. Mech., 75, 4410-4421.
[3] Susmel L, Taylor D (2008). The theory of critical distances to predict static strength of notched brittle components subjected to mixed-mode loading. Eng. Fract. Mech., 75, 534-550. 2 3 4 5 6 7 8 9 10 11 12 13 14 15 16 17 18 19 20 21 22 23 24 25 26 27 28 29 30 31 32 33 34 35 36 37 38 39 40 41 42 43 44 45 46 47 48 49 50 51 52 53 54 55 56 57 58 59
Review Copy
[4] Taylor D, Merlo M, Pegley R, Cavatorta MP (2004). The effect of stress concentrations on the fracture strength of polymethylmethacrylate. Mat. Sci. Eng. A, 382, 288-294.
[5] Cicero S, Madrazo V, Carrascal IA (2012). Analysis of notch effect in PMMA using the theory of critical distances. Eng. Fract. Mech., 86, 56–72.
[6] Madrazo V, Cicero S, Carrascal IA (2012). On the point method and the line method notch effect predictions in Al7075-T651. Eng. Fract. Mech., 79, 363–379.
[7] Cicero S, Madrazo V, Carrascal IA, Cicero R (2011). Assessment of notched structural components using failure assessment diagrams and the theory of critical distances. Eng. Fract. Mech., 78, 2809–2825.
[8] Ibáñez-Gutiérrez FT, Cicero S, Carrascal IA, Procopio I (2016). Effect of fibre content and notch radius in the fracture behaviour of short glass fibre reinforced polyamide 6: an approach from the Theory of Critical Distances. Comp. Part B: Eng., 94, 299–311.
[9] Niu LS, Chehimi C, Pluvinage G (1994). Stress field near a large blunted V notch and application of the concept of notch stress intensity factor to the fracture of very brittle materials. Eng. Fract. Mech., 49, 325–335.
[10] Pluvinage G (1998). Fatigue and fracture emanating from notch; the use of the notch stress intensity factor. Nucl. Eng. Des., 185, 173–184.
[11] Dugdale DS (1960). Yielding of steel sheets containing slits. J. Mech. Phys. Solids, 8, 100–108.
[12] Barenblatt GI (1959). The formation of equilibrium cracks during brittle fracture. General ideas and hypothesis. Axially symmetric cracks. J. Appl. Math. Mech., 23, 622– 636.
[13] Hilleborg A, Modeer M,. Petersson PE (1976). Analysis of crack formation and crack growth in concrete by means of fracture mechanics and finite elements. Cem.
Concr. Res., 6, 777–782.
[14] Gómez FJ, Elices M, Valiente A (2000). Cracking in PMMA containing U-shaped notches. Fat. Frac. Eng. Mat. Struct., 23, 795–803.
[15] Lawn B (1993). Fracture of Brittle Solids. Cambridge University Press, Cambridge, UK.
[16] Weibull W (1939). The phenomenon of rupture in solids. Proc. R. Swed. Inst. Eng.
Res., 153, 1–55.
[17] Beremin FM (1983). A local criterion for cleavage fracture of a nuclear pressure vessel steel. Metall. Trans. A, 14A, 2277–2287.
2 3 4 5 6 7 8 9 10 11 12 13 14 15 16 17 18 19 20 21 22 23 24 25 26 27 28 29 30 31 32 33 34 35 36 37 38 39 40 41 42 43 44 45 46 47 48 49 50 51 52 53 54 55 56 57 58 59
Review Copy
[18] Ritchie RO, Knott JF, Rice JR (1973). On the relationship between critical tensile stress and fracture toughness in mild steel. J. Mech. Phys. Solids, 21, 395–410.
[19] Sih GC (1974). Strain-energy-density factor applied to mixed mode crack problems. Int. J. Fract., 10, 305–321.
[20] Kipp ME, Sih GC (1975). The strain energy density failure criterion applied to notched elastic solids. Int. J. Solids Struct., 11, 153–173.
[21] Gillemot LF (1975). Criterion of crack initiation and spreading. Eng. Fract. Mech., 8, 239–253.
[22] Molski K, Glinka G (1981). A method of elastic-plastic stress and strain calculation at a notch root. Mater. Sci. Eng., 50, 93–100.
[23] Berto F, Lazzarin P (2014). Recent developments in brittle and quasi-brittle failure assessment of engineering materials by means of local approaches. Mater. Sci. Eng. R, 75, 1–48.
[24] Lazzarin P, Berto F (2005). Some expressions for the strain energy in a finite volume surrounding the root of blunt V-notches. Int. J. Fract., 135, 161–185.
[25] Berto F (2015). A criterion based on the local strain energy density for the fracture assessment of cracked V-notched components made of incompressible hyperelastic materials. Theor. Appl. Fract. Mech., 76, 17–26.
[26] Berto F, Lazzarin P (2010). Fictitious Notch Rounding approach of pointed V-notch under in-plane shear. Theor. Appl. Fract. Mech., 53, 127–135.
[27] Gallo P, Berto F, Lazzarin P (2015). High temperature fatigue test of notched specimens made of titanium Grade 2. Theor. Appl. Fract. Mech., 76, 27–34.
[28] Berto F, Lazzarin P (2009). A review of the volume-based strain energy density approach applied to V-notches and welded structures. Theor. Appl. Fract. Mech., 52, 183–194.
[29] Campagnolo A, Berto F, Leguillon D (2016). Fracture assessment of sharp V-notched components under Mode II loading: a comparison among some recent criteria.
Theor. Appl. Fract. Mech., 85B, 217–226.
[30] Berto F, Cendón DA, Elices M (2016). Fracture behavior under torsion of notched round bars made of gray cast iron. Theor. Appl. Fract. Mech., 84, 157–165.
[31] Derpeński L, Seweryn A, Berto F (2017). Brittle fracture of axisymmetric specimens with notches made of graphite EG0022A. Theor. Appl. Fract. Mech., 89, 45– 51. 2 3 4 5 6 7 8 9 10 11 12 13 14 15 16 17 18 19 20 21 22 23 24 25 26 27 28 29 30 31 32 33 34 35 36 37 38 39 40 41 42 43 44 45 46 47 48 49 50 51 52 53 54 55 56 57 58 59
Review Copy
[32] Lazzarin P, Campagnolo A, Berto F (2014). A comparison among some recent energy-and stress-based criteria for the fracture assessment of sharp V-notched components under Mode I loading. Theor. Appl. Fract. Mech., 71, 21–30.
[33] Gallo P, Berto F, Glinka G (2016). Analysis of creep stresses and strains around sharp and blunt V-notches. Theor. Appl. Fract. Mech., 85B, 435–446.
[34] Kocak M, Webster S, Janosch JJ, Ainsworth RA, Koers R (2008). FITNET
fitness-for-service (FFS), Procedure Vol. 1. GKSS, Hamburg, Germany.
[35] Berto F, Lazzarin P, Kotousov A, Pook LP (2012). Induced out-of-plane mode at the tip of blunt lateral notches and holes under in-plane shear loading. Fat. Fract. Eng.
Mater. Struct., 35, 538–555.
[36] He Z, Kotousov A, Berto F (2015). Effect of vertex singularities on stress intensities near plate free surfaces. Fat. Fract. Eng. Mater. Struct., 38, 860–869.
[37] Cicero S, Madrazo V, García T (2014). The Notch Master Curve: A proposal of Master Curve for ferritic-pearlitic steels in notched conditions. Eng. Fail. Anal., 42, 178–196.
[38] Cicero S, García T, Madrazo V (2015). Application and validation of the notch master curve in medium and high strength structural steels. J. Mech. Sci. Technol., 29, 4129–4142.
[39] Madrazo V, Cicero S, García T (2014). Assessment of notched structural steel components using failure assessment diagrams and the Theory of Critical Distances.
Eng. Fail. Anal., 36, 104–120.
[40] Ibáñez-Gutiérrez FT, Cicero S (2017). Fracture assessment of notched short glass fibre reinforced polyamide 6: an approach from failure assessment diagrams and the theory of critical distances. Compos. B Eng., 111, 124–133.
[41] Cicero S, Madrazo V, García T (2015). On the assessment of U-shaped notches using Failure Assessment Diagrams and the Line Method: experimental overview and validation. Theor. Appl. Fract. Mech., 80, 235–241.
[42] Torabi AR (2012). Estimation of tensile load-bearing capacity of ductile metallic materials weakened by a V-notch: The equivalent material concept. Mat. Sci. Eng. A, 536, 249-255.
[43] Torabi AR (2012). On the use of the equivalent material concept to predict tensile load-bearing capacity of ductile steel bolts containing V-shaped threads. Eng. Fract.
Mech., 97, 136-147.
[44] Torabi AR, Alaei M (2015). Mixed-mode ductile failure analysis of V-notched Al 7075-T6 thin sheets. Eng. Fract.Mech., 150, 70-95.
2 3 4 5 6 7 8 9 10 11 12 13 14 15 16 17 18 19 20 21 22 23 24 25 26 27 28 29 30 31 32 33 34 35 36 37 38 39 40 41 42 43 44 45 46 47 48 49 50 51 52 53 54 55 56 57 58 59
Review Copy
[45] Torabi AR, Habibi R, Mohammad Hosseini B (2015). On the ability of the Equivalent Material Concept in predicting ductile failure of U-notches under moderate- and large-scale yielding conditions. Phys. Mesomech., 18, 337-347.
[46] Torabi AR, Habibi R (2016). Investigation of ductile rupture in U-notched Al 6061-T6 plates under mixed mode loading. Fat. Fract. Eng. Mater. Struct., 39, 551-565. [47] Torabi AR, Keshavarzian M (2016). Evaluation of the load-carrying capacity of notched ductile plates under mixed mode loading. Theor. Appl. Fract. Mech., 85, 375– 386.
[48] Torabi AR, Keshavarzian M (2016). Tensile crack initiation from a blunt V-notch border in ductile plates in the presence of large plasticity at the notch vicinity. Int. J.
Terrasp. Sci. Eng., 8, 93-101.
[49] Torabi AR, Alaei M (2016). Application of the equivalent material concept to ductile failure prediction of blunt V-notches encountering moderate-scale yielding. Int.
J. Damage Mech.. 25, 853–877.
[50] Torabi AR Mohammad Hosseini B (2017). Large plasticity induced crack initiation from U-notches in thin aluminum sheets under mixed mode loading. Eng. Sol. Mech., 5, 39-60
[51] Torabi AR, Berto F, Razavi SMJ (2017). Ductile failure prediction of thin notched aluminum plates subjected to combined tension-shear loading. Theor. Appl. Fract.
Mech., Article in press.
[52] Torabi AR, Berto F, Campagnolo A, Akbardoost J (2017). Averaged strain energy density criterion to predict ductile failure of U-notched Al 6061-T6 plates under mixed mode loading. Theor. Appl. Fract. Mech., Article in Press.
[53] Torabi AR, Campagnolo A, Berto F (2016). Mixed mode I/II crack initiation from U-notches in Al 7075-T6 thin plates by large-scale yielding regime. Theor. Appl. Fract.
Mech., 86, 284–291.
[54] Torabi AR, Campagnolo A, Berto F (2016). A successful combination of the Equivalent Material Concept and the Averaged Strain Energy Density Criterion for predicting crack initiation from blunt V-Notches in ductile aluminium plates under mixed mode loading. Phys. Mesomech., 19, 382-391 .
[55] Torabi AR, Berto F, Campagnolo A (2016). Elastic-Plastic fracture analysis of Notched Al7075-T6 plates by means of the local energy combined with the Equivalent Material Concept. Phys. Mesomech., 19, 204-213
[56] Neuber H (1958). Theory of notch stresses: principles for exact calculation of
strength with reference to structural form and material. Springer Verlag, Berlin,
Germany. 2 3 4 5 6 7 8 9 10 11 12 13 14 15 16 17 18 19 20 21 22 23 24 25 26 27 28 29 30 31 32 33 34 35 36 37 38 39 40 41 42 43 44 45 46 47 48 49 50 51 52 53 54 55 56 57 58 59
Review Copy
[57] Peterson RE (1959). Notch sensitivity. In: Sines G, Waisman JL (Eds.), Metal
fatigue, McGraw Hill, New York, USA, pp. 293–306.
[58] ASTM International (2010). ASTM D638-10, Standard Test Method for Tensile
Properties of Plastics. Philadelphia, USA.
[59] ASTM International (1999). ASTM D5045-99, Standard Test Methods for
Plane-Strain Fracture Toughness and Plane-Strain Energy Release Rate of Plastic Materials.
Philadelphia, USA.
[60] Creager M, Paris PC (1967). Elastic field equations for blunt cracks with reference to stress corrosion cracking. Int. J. Fract., 3, 247–252.
2 3 4 5 6 7 8 9 10 11 12 13 14 15 16 17 18 19 20 21 22 23 24 25 26 27 28 29 30 31 32 33 34 35 36 37 38 39 40 41 42 43 44 45 46 47 48 49 50 51 52 53 54 55 56 57 58 59
Review Copy
Tables
Table 1. Main mechanical (tensile and fracture) properties of the PMMA E (GPa) σ0.2(MPa) σu(MPa) emax(%) Kc (MPa·m1/2)
3.40 47.0 74.5 4.7 2.04 2 3 4 5 6 7 8 9 10 11 12 13 14 15 16 17 18 19 20 21 22 23 24 25 26 27 28 29 30 31 32 33 34 35 36 37 38 39 40 41 42 43 44 45 46 47 48 49 50 51 52 53 54 55 56 57 58 59
Review Copy
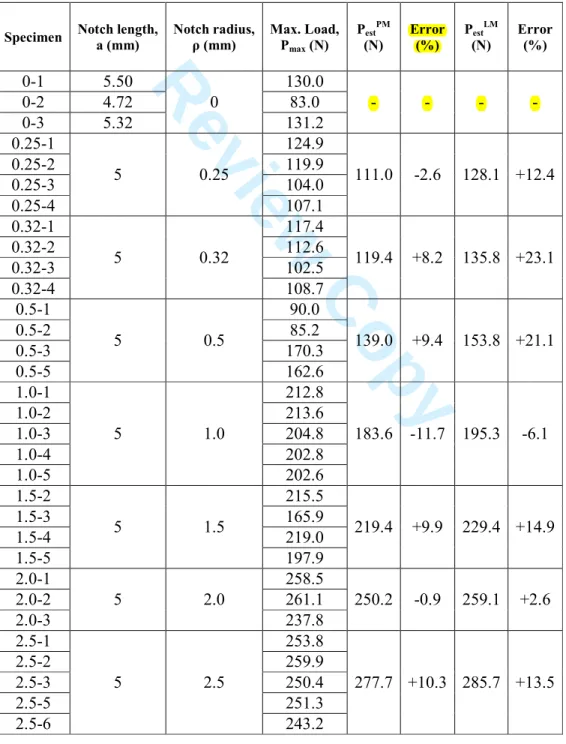
Table 2. Experimental programme, experimental fracture loads, and fracture load estimations: PestPM (EMC-TCD (PM)), PestLM (EMC-TCD (LM)).
Specimen Notch length, a (mm) Notch radius, ρ (mm) Max. Load, Pmax (N) Pest PM (N) Error (%) Pest LM (N) Error (%) 0-1 5.50 0 130.0 - - - - 0-2 4.72 83.0 0-3 5.32 131.2 0.25-1 5 0.25 124.9 111.0 -2.6 128.1 +12.4 0.25-2 119.9 0.25-3 104.0 0.25-4 107.1 0.32-1 5 0.32 117.4 119.4 +8.2 135.8 +23.1 0.32-2 112.6 0.32-3 102.5 0.32-4 108.7 0.5-1 5 0.5 90.0 139.0 +9.4 153.8 +21.1 0.5-2 85.2 0.5-3 170.3 0.5-5 162.6 1.0-1 5 1.0 212.8 183.6 -11.7 195.3 -6.1 1.0-2 213.6 1.0-3 204.8 1.0-4 202.8 1.0-5 202.6 1.5-2 5 1.5 215.5 219.4 +9.9 229.4 +14.9 1.5-3 165.9 1.5-4 219.0 1.5-5 197.9 2.0-1 5 2.0 258.5 250.2 -0.9 259.1 +2.6 2.0-2 261.1 2.0-3 237.8 2.5-1 5 2.5 253.8 277.7 +10.3 285.7 +13.5 2.5-2 259.9 2.5-3 250.4 2.5-5 251.3 2.5-6 243.2 2 3 4 5 6 7 8 9 10 11 12 13 14 15 16 17 18 19 20 21 22 23 24 25 26 27 28 29 30 31 32 33 34 35 36 37 38 39 40 41 42 43 44 45 46 47 48 49 50 51 52 53 54 55 56 57 58 59
Review Copy
2 3 4 5 6 7 8 9 10 11 12 13 14 15 16 17 18 19 20 21 22 23 24 25 26 27 28 29 30 31 32 33 34 35 36 37 38 39 40 41 42 43 44 45 46 47 48 49 50 51 52 53 54 55 56 57 58 59Review Copy
Figure 1. Obtaining L and
σ
0 parameters based on the PM definition.L/2 r blunt notch sharp notch defect 2 3 4 5 6 7 8 9 10 11 12 13 14 15 16 17 18 19 20 21 22 23 24 25 26 27 28 29 30 31 32 33 34 35 36 37 38 39 40 41 42 43 44 45 46 47 48 49 50 51 52 53 54 55 56 57 58 59
Review Copy
Figure 2. A typical stress-strain curve for a ductile material.
2 3 4 5 6 7 8 9 10 11 12 13 14 15 16 17 18 19 20 21 22 23 24 25 26 27 28 29 30 31 32 33 34 35 36 37 38 39 40 41 42 43 44 45 46 47 48 49 50 51 52 53 54 55 56 57 58 59
Review Copy
Figure 3. Stress-strain curve for the equivalent brittle material.
2 3 4 5 6 7 8 9 10 11 12 13 14 15 16 17 18 19 20 21 22 23 24 25 26 27 28 29 30 31 32 33 34 35 36 37 38 39 40 41 42 43 44 45 46 47 48 49 50 51 52 53 54 55 56 57 58 59
Review Copy
Figure 4. Schematic showing the geometry of the SENB test specimens. Dimensions in mm, ρ varying from 0 mm to 2.5 mm. Thickness (B) = 5 mm; Width (W) = 10 mm.
ρ 40 44 10 5 5
P
2 3 4 5 6 7 8 9 10 11 12 13 14 15 16 17 18 19 20 21 22 23 24 25 26 27 28 29 30 31 32 33 34 35 36 37 38 39 40 41 42 43 44 45 46 47 48 49 50 51 52 53 54 55 56 57 58 59Review Copy
Figure 5. Stress-strain tensile curve of the PMMA being analysed (engineering variables). 2 3 4 5 6 7 8 9 10 11 12 13 14 15 16 17 18 19 20 21 22 23 24 25 26 27 28 29 30 31 32 33 34 35 36 37 38 39 40 41 42 43 44 45 46 47 48 49 50 51 52 53 54 55 56 57 58 59
Review Copy
Figure 6. Examples of load-displacement curves obtained in the fracture tests: a) specimens with notch radius 0.25 mm; b) specimens with notch radius 2.0 mm.
a)
b)
2 3 4 5 6 7 8 9 10 11 12 13 14 15 16 17 18 19 20 21 22 23 24 25 26 27 28 29 30 31 32 33 34 35 36 37 38 39 40 41 42 43 44 45 46 47 48 49 50 51 52 53 54 55 56 57 58 59Review Copy
Figure 7. Comparison between fracture load predictions and experimental fracture loads: a) individual tests; b) average values for each set of tests (notch radius).
b)
a)
+ 20% - 20% + 20% - 20% 2 3 4 5 6 7 8 9 10 11 12 13 14 15 16 17 18 19 20 21 22 23 24 25 26 27 28 29 30 31 32 33 34 35 36 37 38 39 40 41 42 43 44 45 46 47 48 49 50 51 52 53 54 55 56 57 58 59Review Copy
Figure 8. FEM model for SENB specimen containing a U-notch of 0.2 mm radius.
2 3 4 5 6 7 8 9 10 11 12 13 14 15 16 17 18 19 20 21 22 23 24 25 26 27 28 29 30 31 32 33 34 35 36 37 38 39 40 41 42 43 44 45 46 47 48 49 50 51 52 53 54 55 56 57 58 59
Review Copy
a)
b)
Figure 9. Von-Mises stress distribution around the U-notch: a) notch radius equal to 0.25 mm subjected to the mean fracture load of 114 N and b) notch radius equal
to 2.5 mm subjected to the mean fracture load of 252 N. The plastic zone is shown by a red curved line in both cases.
2 3 4 5 6 7 8 9 10 11 12 13 14 15 16 17 18 19 20 21 22 23 24 25 26 27 28 29 30 31 32 33 34 35 36 37 38 39 40 41 42 43 44 45 46 47 48 49 50 51 52 53 54 55 56 57 58 59