Revista Chilena de Historia Natural 86: 443-451, 2013 © Sociedad de Biología de Chile
RESEARCH ARTICLE
Evaluation of a semi-automatic system for long-term seawater carbonate
chemistr y manipulation
Evaluación de un sistema semiautomático para la manipulación del sistema carbonato
en agua de mar durante periodos extensos
RODRIGO TORRES1,*,PATRICIO H. MANRIQUEZ2,8, CRISTIAN DUARTE3, JORGE M. NAVARRO2,
NELSON A. LAGOS4, CRISTIAN A. VARGAS5 & MARCO A. LARDIES6,7
1Centro de Investigación en Ecosistemas de la Patagonia (CIEP), Ignacio Serrano 509, código postal 5951601, Coyhaique, Chile 2Instituto de Ciencias Marinas y Limnológicas, Laboratorio Costero de Recursos Acuáticos de Calfuco,
Facultad de Ciencias, Universidad Austral de Chile, Independencia 641, código postal 5110566, Valdivia, Chile
3Departamento de Ecología y Biodiversidad, Facultad de Ecología y Recursos Naturales, Universidad Andrés Bello,
República 470, Santiago, Chile
4Facultad de Ciencias, Universidad Santo Tomás, Ejército 146, Santiago, Chile
5Laboratorio de Funcionamiento de Ecosistemas Acuáticos (LAFE), Unidad de Sistemas Acuáticos,
Centro de Ciencias Ambientales EULA Chile, Universidad de Concepción, Casilla 160-C, Concepción, Chile
6Departamento de Ciencias, Facultad de Artes Liberales, Facultad de Ingeniería y Ciencias, Universidad Adolfo Ibáñez,
Diagonal Las Torres 2640, Peñalolén, Santiago, Chile
7Center for Aquaculture Research (INCAR)
8Present address: Laboratorio de Ecología y Conducta de la Ontogenia Temprana (LECOT), Centro de Estudios Avanzados
en Zonas Áridas (CEAZA). Avenida Ossandón 877, Coquimbo, Chile *Corresponding author: [email protected]
ABSTRACT
The assessment of the effects of Ocean Acidifi cation (OA) on marine life has received increasing attention in recent marine research. On a mesocosmic scale, the CO2 levels in seawater can be manipulated to evaluate experimentally
the consequences of OA on marine organisms (vertebrates and invertebrates). An ideal manipulation of carbonate chemistr y should mimic exactly the changes to carbonate chemistr y, which will occur in years to come. Although some methods have been described in the literature, here we describe in detail a simple, robust and inexpensive system to produce CO2-enriched seawater by bubbling the seawater with air-CO2 mixtures. The system uses mass
fl ow controllers (MFC) to blend atmospheric air with pure C O2 to produce two pCO2 levels. The air-CO2 mixtures are
delivered continuously to seawater equilibration reser voirs, a nd simultaneously to an infrared CO2 analyser to verify
CO2 levels in the air-CO2 mixture delivered to the equilibration tanks. We monitored both pH and total alkalinity in the
equilibration reser voirs over a period of one year in order to document the long-term performance of this system for simulating the future carbonate chemistr y of seawater in a coastal laborator y. System performance was suffi cient to maintain three contrasting (e.g., 397, 709 and 1032 matm) and relatively constant (the coeffi cient of variability was 11 %, 9 % and 9 % respectively) seawater pCO2 during a year-long monitoring.
Key words: carbonate chemistr y manipulation, ocean acidifi cation.
RESUMEN
La evaluación de los efectos de la acidifi cación oceánica en la vida marina ha recibido creciente atención en la actual investigación marina. A escala de “mesocosmos” los niveles de CO2 del agua de mar pueden ser manipulados para
permitir la experimentación con organismos marinos (vertebrados e invertebrados). Una manipulación óptima de la química del carbono debiese emular exactamente los cambios esperado en la química del carbono. A pesar que algunos métodos han sido descritos en la literatura, el presente estudio describe en detalle un sistema simple, robusto y de bajo costo para acondicionar agua de mar enriquecida en CO2 a través del burbujeo del agua de mar con mezclas de aire y
CO2. El sistema mezcla aire con CO2 puro para producir dos niveles de pCO2 utilizando para ello controladores de fl ujo
másico. Las mezclas aire-CO2 son enviadas a tambores con agua de mar y simultáneamente a un analizador de CO2 para
verifi car los niveles de CO2 en las mezclas aire-CO2 burbujeadas en los recipientes. Monitoreamos el pH y la alcalinidad
por más de un año con el objeto de documentar el desempeño de largo plazo de este sistema emulando la futura química del carbono en agua de mar en un laboratorio costero. Concluimos que el desempeño del sistema es sufi ciente para mantener niveles pCO2 contrastantes (e.g., 397, 709, 1032 µatm) y relativamente constantes (el coefi ciente de
variación fue de 11 %, 9 % y 9 %, respectivamente) durante aproximadamente un año de monitoreo.
INTRODUCTION
C a r b o n d i o x i d e ( C O
2) r e l e a s e d d u e t o
human activities has caused a rise
in the
concentration of atmospheric CO
2, and an
increase in dissolved inorganic carbon content
of oceanic sur face waters. CO
2reacts with
seawater reducing its pH (a phenomenon
named Ocean Acidifi cation (OA)) and carbonate
ion concentration (Caldeira & Wickett 2003;
Or r et al. 2005; Raven et al. 2005). The
carbonate ion reduction results in a decrease in
the Aragonite (Ar) and Calcite (Ca) saturation
state of seawater (Orr et al. 2005). Therefore,
it is predicted that the primar y effect of OA
will be the undersaturation of seawater in Ar in
a vast part of the world’s oceans, in particular
high-latitude regions which have naturally low
carbonate ion concentrations (Fabr y et al. 2009;
Orr et al. 2005).
The evidence that OA is occurring is now
irrefutable (Orr et al. 2005). OA allows to
fundamentally alter marine ecosystems in time
frames that are essentially irreversible from
the perspective of human societies (Raven et
al. 2005). Understanding the impacts of OA in
ocean ecosystems will likely be a major subject
in marine science in the coming decades. In
this context, developing CO
2systems that
allows emulating the future conditions of an
ocean with high CO
2levels is essential. An
ideal manipulation of carbonate chemistr y
(i.e. CO
2system) should mimic exactly the
changes to carbonate chemistr y that will occur
in years to come. During the last decade,
experimental simulations of future marine
carbonate chemistr y have been conducted
mainly in North America and Europe, to study
the effect of OA on marine organisms (Fangue
et al. 2010; Gattuso et al. 2010). A growing
body of experimental evidence on OA effects is
mainly derived from short-term experiments of
typically less than 100 days duration (Kroeker
et al. 2013), which normally cor responds
to a small proportion of the life span of the
respective model organisms. There is therefore
a need to develop and test experimental
facilities that can allow longer periods of
experimentation (i.e. from several months to
years) covering one or several life cycles of
marine invertebrates, in order to know more
about the physiological acclimation and the
adaptation capacity of species to OA.
Seawater chemistr y can be manipulated in
various ways in order to alter the carbonate
system (Gattuso et al. 2010). Probably the
most common carbonate system manipulation
techniques are “aeration techniques” bubbling
CO
2-air mixtures or pure CO
2to reach a target
pH or pCO
2level. Two major subgroups within
these aeration techniques are (1) the
“pH-stat” and (2) the continuous bubbling with
pre-mixed gases (Gattuso et al. 2010). The
fi rst is based on a feedback system through
continuous monitoring of seawater pH, and the
intermittent injection of pure CO
2or CO
2-free
air to keep pH into a target range. The second
is based on the continuous bubbling with an
air-CO
2mixture of a defi ned pCO
2.
These two aeration techniques share a
common weakness: they do not compensate for
changes in A
Tresulting from precipitation and
dissolution of CaCO
3or those changes resulting
from evaporation. Furthermore the “pH-stat”
is limited by inherent variability associated to
the feedback system, while bubbling with
pre-mixed gases produces a less variable control
on seawater pCO
2. An accurate comparison
between systems are beyond the scope of this
paper, however there is clearly a wide variability
in the setting and the performance of these
systems, necessitating a detailed description
of both methods and carbonate chemistr y
(Gattuso et al. 2010).
The carbonate chemistr y experimental
setup described here corresponds with the
“aeration with pre-mixed gases” group. This
system was implemented at Calfuco Marine
Laborator y (http://www.ciencias.uach.cl/
unidades/calfuco/index.php), located in
southern Chile (40° S) near the city of Valdivia
and under the infl uence of the Valdivia River.
The coastal water supplied to the aquaria may
therefore experience variations in salinity and
other parameters associated with freshwater
inputs, in addition to marine variations such as
coastal upwelling and tidal cycles.
In this paper we will describe the first
laborator y facility to study the consequences
of the OA on marine invertebrates in Chile and
South America. Moreover we discuss the
long-term per formance of this system (operative
since late 2010) and others considerations in
maintaining incubations at different CO
2levels
METHODS
The pCO2 generation system
This system manipul ates carbon chemistry by changing Total Carbon (CT) at constant Total Alkalinity (AT), using
the “Aeration to target pCO2” technique (Gattuso et al.
2010). The pCO2 regulation system described here (Fig.
1) has been adapted to generate air-CO2 mixtures of
750 ppm and 1200 ppm in dry air. Those nominal levels correspond approximately with projected atmospheric levels for years 2079 and 2127 under RPC 8.5 scenario (Meinshausen et al. 2011; Riahi et al. 2007; Vuuren et al. 2011). Current (control) levels of CO2 (approx. 387-391
Fig. 1: Main characteristics of the Calfuco Marine Laborator y seawater-CO2 equilibration system. Compressed
air (1) is blended with pure CO2 (2) using MFCs (3). The CO2-air mixture is split into two branches, one going to the CO2 analyser (4) to allow fi ne regulation of the MFCs, and the other to the seawater in the equilibration tanks (5). The pCO2 of the seawater in the mixing reser voirs can be monitored using a seawater-air equilibrator
(6). The equilibrated air is pumped to a CO2 analyser, with analogue output. The voltage signal is displayed
gra-phically to show the evolution of seawater equilibration with CO2. The CO2 analyser is calibrated with a standard CO2-air mixture (7) and with CO2-free air (CO2 removed with soda lime, 8). The gas entering the CO2 analyser is dried using a desiccant (9) and fi ltered (removing particles larger than 1 µm). The air-CO2 mixture is injected
into the 250 l equilibration tanks or directly into the experimental treatments. Samples for discrete analysis of pH and AT are collected periodically from the equilibration tanks to verify the functioning of the system.
Características principales del sistema de equilibración de agua marina con CO2 del laboratorio Marino de Calfuco. El Aire
comprimido (1) se mezcla con CO2 puro (2) usando Controladores de Flujo Másico CFM (3). La mezcla CO2-aire se divide en
dos ramas, una dirigida al analizador de CO2 (4) para permitir la regulación fi na de los CFM, y la otra rama es dirigida al agua
de mar contenida en los tambores de mezcla (5). La pCO2 del agua de mar en los tambores de mezcla puede ser monitoreada
usando un equilibrador agua de mar-aire (6). El aire equilibrado es bombeado al analizador de CO2, el que cuenta con una
sali-da analógica. La señal de voltaje se muestra gráfi camente para mostrar la evolución de la equilibración con CO2. El analizador
de CO2 es calibrado con una mezcla aire-CO2 estándar (7) y con aire libre de CO2 (donde el CO2 del aire fue removido con soda
carbonatada, 8). El gas que ingresa al analizador de CO2 es secado usando un desecante (9) y fi ltrado (removiendo la partículas
mayores de una micra). La mezcla aire- CO2 es inyectada en tambores de equilibración o directamente a los tratamientos de
ppm for the 2011 and early 2012 period at the Southern Hemisphere; http://www.csiro.au) were obtained by the equilibration of seawater with atmospheric air. For the 750 ppm and 1200 ppm treatments, we blended dry air with pure CO2 to each target concentration using an air
MFC (Aalborg, model GFC; http://www.aalborg.com) and a CO2 MFC (Aalborg, model GFC). In total we used
4 MFC valves mounted on a board for horizontal gas fl ow. Dry and fi ltered air is generated by compressing atmospheric air (117 psi) using an oil-free, 4-piston air compressor (Schulz, model MSV12); the dry air passes through a particle fi lter rack (MTA; http://www.mta-it. com) to retain particles larger than 1µm before entering the air MFCs. Pressure in the air line is maintained at approximately 10 psi using a standard regulator before entering the MFC valves. Similarly, pure CO2 (Research grade, INDURA; http://www.indura.cl) was regulated at 10 psi using a single stage CO2 regulator. The air
fl ow in the air MFCs was set at 5 litre min-1 for both
treatments, and the CO2 fl ows were set initially at 4.06
ml min-1 and 1.56 ml min-1, to theoretically (assuming
that the pCO2 of the air used in the blend was already
388ppm of CO2) produce a pCO2 of 1200 ppm and 750 ppm, respectively. Finally we manually adjusted the CO2
MFC fl ow until the required target pCO2 of the air-CO2
mixture was reached. The pCO2 of the air-CO2 mixture
was continuously monitored using the system described below.
The gas blend pCO2 monitoring system
The pCO2 monitoring system was based on a CO2
analyser (Qubit system, model S151), primarily for measuring the CO2 content in the air-CO2 mixture.
The CO2 analyser voltage output was displayed in a
PC using a multimeter interface (RadioShack, model 22-812). Based on this monitoring methodology, we manually adjusted the CO2 MFCs to achieve the target
pCO2, and we verifi ed that the pCO2 remained constant.
All air samples passing through the CO2 analyser were
previously dried using a Drierite desiccant column (W. H. Hammond Drierite Co.; http://www.secure.drierite. com) and fi ltered (Millipore 1 µm fi lter) (Fig. 1). The CO2 analyser was calibrated with air-CO2 mixture
standards of 1,114 ppm manufactured by INDURA (http://www.indura.cl), while zero was obtained by passing the air through a soda lime CO2-removal column
(Fig. 1). The fl ow rate of the CO2-air mixture (samples
and standard) entering the CO2 analyser was kept at approximately 150 ml min-1 using an Air-MFC (Aalborg).
The seawater m ixing reservoirs
Once the experimental treatment gases are produced, each gas is mixed with 1 µm fi ltered seawater (FSW hereafter) in a gas-mixing reservoir bucket. Each reservoir consists of a 250 litre food grade bucket (polyethylene HADAD plastics) into which the air-CO2
mixture is injected though a large aquarium grade air diffuser. The air-CO2 mixtures are injected at the bottom
of the buckets at ca. 6-7 psi, using plastic tubing and an air-stone bubbler.
Since the air -CO2 mix is water undersaturated due to condensation in the air compression tank, evaporation of seawater causes an increment in salinity and total alkalinity. The magnitude of this increment is variable, and depends on the intensity of the bubbling relative to the volume of the seawater to be equilibrated, as well as other factors (e.g., temperature). We expect that maximum AT increments occur when a large dry
air-CO2 mixture equilibrates with a small volume of
water. In order to assess the magnitude of this effect, we
measured the AT in one liter of fi ltered seawater before
and after 24 hours of constant air-CO2 bubbling. In these
experimental trials the total alkalinity concentration rose 8-12 mmol l-1 d-1 (an increment of ca. 0.4 % of the
initial AT). Although this increment in alkalinity does not
affect the fi nal pCO2 of the equilibrated water, it does
affect other aspects of carbon chemistry (e.g., changes in Omega, usually < 1 %). It is calculated that Omega will increase by 6% for each unit of salinity increment, and therefore we used two strategies to prevent or reduce the effect of increment in salinity and alkalinity: 1) frequent changing of the equilibrated water (e.g., total or partial daily replacement of the equilibrated water at 250 L container); 2) bubbling the mixture into the water to allow the air-CO2 mixture reach water saturation
level, before injecting the air-CO2 mixture into the experimental reservoirs.
Monitoring of pCO2, pH and AT in equilibration reservoirs.
The reservoir tanks were cleaned at regular intervals (approximately every 7 days) and the seawater was replaced with fresh FSW. Twelve hours after initiating the bubbling of the new seawater, we collected samples from the equilibration tanks and from the intertidal zone where the inlet of the seawater supply system is located, for analysis of the pH and AT. The equilibrated
seawater pCO2 may also be monitored by pumping the
seawater to a gas exchange column or equilibrator (Mini-Module Membrane Contactor; http://www.liqui-cel. com) and measuring the pCO2 of the equilibrated air.
This last feature is particularly useful for determining the equilibration period after renewal of the seawater, i.e. when the pCO2-time relationship reaches a plateau
(normally in the first 12 h). However this latter procedure does not play any role in the functioning or calibration of the air-CO2 mixture generation system.
pH samples were collected in 50 mL syringes and immediately transferred to a close 25 mL cell, thermostatically controlled at 25.0 °C. The pH was measured at 25.0 °C with a Metrohm 713 pH meter (input resistance > 1013 Ohm, 0.1 mV sensitivity and
nominal resolution 0.001 pH units) and a glass combined double junction Ag/AgCl electrode (Metrohm model 6.0219.100) calibrated with 8.089 Tris buffer (DOE 1994) at 25.0 °C; pH values are reported on the total hydrogen ion scale (DOE 1994).
Seawater samples for AT were poisoned with
50µL of saturated HgCl2 solution and stored in 250 ml polypropylene bottles in darkness at room temperature until analysis. AT was determined by potentiometric
titration in an open cell with 0.05M HCl (Merck Titrisol®) (Haraldsson et al. 1997). The accuracy was controlled against a certifi ed reference material (CRM, supplied by Andrew Dickson, Scripps Institution of Oceanography, San Diego, USA).The correction factor was approximately 1.002, corresponding to a difference of about 5µmol kg-1. Every sample was analysed with 2
or 3 replicates.
Omega Ar (ΩAr) and Omega Ca (ΩCa) were
estimated from the pH-AT pairs, in addition to temperature, salinity and pressure were obtained with a small CTD (Hydronaut). Carbonate system parameters calculations were performed using CO2SYS software (Lewis &Wallace 1998) available on http://cdiac.ornl. gov/ftp/co2sys/. Seawater pCO2, Omega Aragonite
and Omega Calcite were calculated using Mehrbach solubility constants (Mehrbach et al. 1973) refi tted by Dickson and Millero (Dickson & Millero 1987). The calculations were performed on a total hydrogen ion scale (pHT). For KSO4 we used the constant determined
Uses of CO2 equilibrated seawater
Depending upon the experimental setting, the equilibrated seawater in the equilibration reservoirs was used in two distinct ways. In one type of experiments a special tubing system was used to allow seawater recirculation between the equilibration reservoirs and the rearing containers, the total volume of equilibrated water circulated through the rearing containers was approximately 10000 times the volume of the organisms. In other type of experiments the equilibrated seawater was used to fi ll the rearing containers and during the experimental rearing each container was connected with tubing to directly inject the required air-CO2 mixture.
In this last case the volume of rearing containers was typically 500-1000 times the volume of the organism.
RESULTS
Evaluation of the system to manipulate carbonate
chemistry in the equilibration reservoirs.
Performance
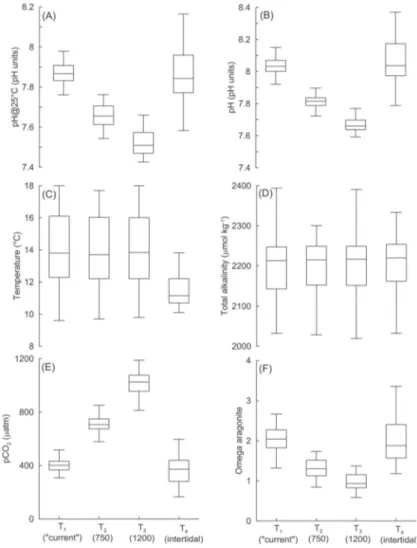
Aeration to achieve a target CO
2will change the
amount and speciation of dissolved inorganic
carbon in equilibration tanks, in turn modifying
pH (Fig. 2A, B), pCO
2(Fig. 2E) and
Ω
Ar(Fig.
2F). The pCO
2of the CO
2-enriched water
Fig. 2: Statistical parameters: pH measured at 25 °C, pH calculated at in situ temperature, temperature, total alkali-nity, partial pressure of CO2 and Omega Aragonite, in the equilibration reservoirs and intertidal (T1 for atmosphe-ric treatment, T2 for 750 ppm treatment, T3 for 1200 ppm treatment, T4 for the intertidal site where the aquarium
inlet is located) during 2011 and early 2012. The box plot indicates the smallest observation (sample minimum), lower quartile (Q1), median (Q2), upper quartile (Q3), and the largest observation (sample maximum).
Parámetros estadísticos: pH medido a 25°C, pH calculado a la temperatura in situ, temperatura, alcalinidad total, presión parcial de CO2 y Omega aragonita, en los tanques de equilibración y en el intermareal (T1 es el tratamiento atmosférico, T2 es el
tra-tamiento 750 ppm, T3 es el tratra-tamiento de 1200 ppm, T4 es el intermareal donde se ubica la toma de agua del acuario) durante 2011 y comienzos del 2012. Los gráfi cos de caja indican la obser vación menor (el mínimo valor), primer cuartil (Q1), segundo
(inferred from pH and At measurements) was
relatively low compared to the pCO
2of the air-
CO
2mixtures, particularly for the highest CO
2/
air blend (1200 µatm) which results in a mean
seawater pCO
2of ca. 1032 µatm, i.e. 14 % lower
(see Fig. 2E).
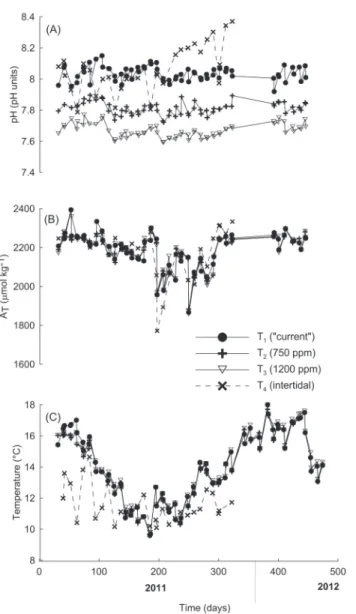
The temperature and A
Tremained constant
between treatments (Fig. 2C, D) but there was
a conspicuous variation over the course of the
year (Fig. 3B,C), caused by environmental
factors such as variable influence of rivers,
upwelling, annual temperature cycle, etc. The
seawater A
Tat both the intertidal (inlet) and
the equilibration reser voirs was positively
cor related with salinity (Fig. 4). However
events of low salinity water at the intertidal of
Calfuco (e.g., < 30) were rare (Fig. 4).
Fig. 3: Time series pH calculated at in situ temperature (i.e. the temperature in the equilibration tanks at the moment of sampling); AT and temperature in the equilibration reser voirs and intertidal (T1 for Atmospheric
treatment, T2 for 750 ppm treatment, T3 for 1200 ppm treatment, T4 for the intertidal site where the aquarium inlet is located) during 2011 and early 2012.
Serie de tiempo de pH calculado a la temperatura in situ (i.e. la temperatura en los tanques de equilibración al momento del muestreo); AT y temperatura en los tanques de mezcla y en el intermareal (T1 es el tratamiento atmosférico, T2 es el
Environmental variations in temperature,
A
Tand salinity explain most of the variability
in pH and Aragonite (
Ω
Ar) in the CO
2enriched
treatments. For example, based on the ranges
of variation in temperature, salinity and A
Tmeasur ed in the atmospheric tr eatment
seawater (i.e. 8.4 °C, 9 and 526 µmol kg
-1respectively), we calculated that the maximum
fl uctuation in pH and
Ω
Arat constant pCO
2(i.e.
at ~380 µatm), should be ~0.13 pH units and
~1.7 respectively.
T h e l o w e r v a r i a b i l i t y o f p H i n t h e
equilibration reser voirs when compared to
the intertidal site (Fig. 2A) demonstrates the
capacity of the system to manipulate carbonate
parameters, even when critical variables (such
as temperature) were not kept constant.
Robustness
The system requires little daily attention with
the exception of: (1) draining the compressor
reser voir (see Fig. 1) to remove condensed
water, and (2) measuring pH and A
Tin the
equilibration reser voirs. The CO
2mole fraction
remained virtually constant for several weeks
or even months, and so little adjustment of the
MFCs was required. After more than a year of
continuous functioning of this system we have
not detected any malfunctions. Even during
power failures the bubbling in the equilibration
tanks restarted automatically when power was
restored.
Operational cost
The operational costs of the experimental
system are low (less than US$ 2000 per
year), consisting mainly in: (1) ultra pure
CO
2(one CO
2cylinder per year), (2) air-CO
2standards (one ever y 1 or 2 years, depending
on the frequency of IR calibration), and (3)
maintenance or replacement of compressor
pistons (pr obably after 1-2 years). The
most signifi cant cost is related to accurate
monitoring of pH and A
T, including reagents,
buf fers, electrodes and reference seawater
material (ca. US$ 5000 per year).
DISSCUSION
The “aeration to target pCO
2” system described
here was suffi cient to maintain different pH,
pCO
2and CaCO
3saturation states in the
treatments year round. However the air-CO
2mixtures (pCO
2of 750 µatm and 1200 µatm)
injected into the equilibration tanks produce
CO
2-enriched seawater with a lower pCO
2(6
% and 14 % lower, respectively; see Fig. 2E).
We estimate that the dilution effect of water
moisture on seawater pCO
2can explain 1-2%
of the pCO
2reduction from the originally dr y
air-CO2 mixture. Seawater fully equilibrated
with a dr y air-CO
2mixture with a pCO
2= 1200
µatm should produce a maximum seawater
pCO
2of 1176 µatm at 18 °C. The rest of
this discrepancy can be attributed to the
incapacity of this system to fully equilibrate
seawater at high pCO
2levels in a period of
12 h. Seawater pCO
2increment slows down
as seawater pCO
2approaches to the target
pCO
2levels, in asymptotic fashion, requiring
longer equilibrations periods that the one
used here (12 hours). However, in spite of the
discrepancies discussed above, this system
had the capacity to produce significantly
different CO
2levels in seawater (Fig. 2E) with
Fig. 4: AT-Salinity relationship in the equilibration
reser voirs and the intertidal (T1 for Atmospheric treatment, T2 for 750ppm treatment, T3 for 1200ppm
treatment, T4 for the intertidal site where the
aqua-rium inlet is located) during 2011 and early 2012.
Relación entre AT y salinidad en los tambores de
equilibra-ción y en el intermareal (T1 es el tratamiento atmosférico, T2 es el tratamiento 750 ppm, T3 es el tratamiento de 1200 ppm, T4 es el intermareal donde se ubica la toma de agua
a relatively low variability (CV= 9 %). This
overall variability includes the ef fect of the
natural variability in salinity, alkalinity and
temperature, as well as the bias in the pH and
A
Tmeasurements, and uncer tainties in the
pCO
2calculation. The error of A
Tanalysis
was constrained using reference material.
The pH er ror was calculated to be lower
than 0.006-0.009 pH units (Torres et al. 1999)
however in the few occasions when salinity
dropped below 30, additional bias, associated
with larger differences in the liquid junction
potential between the buffer and the sample,
are expected to become signifi cant (Wedborg
et al. 2007). Tests on the same sample using
TRIS buffer, at salinity 35 and 25, show minor
discrepancies (< 0.005 pH units); we expect
that even in this particular example (salinity
range between 28-30) the pH error does not
exceed 0.01 pH units. If we consider that
maximum uncer tainties of pH and alkalinity
are in the order 0.01 pH units and ca. 9 in
alkalinity, we expect a total er ror of ca.10
µatm for our pCO
2estimations (Torres et al.
1999), which in turn corresponds with a small
percentage of the pCO
2of the CO
2-enriched
treatments (ca. 1 %). Thus most of the overall
variability repor ted here arises because of
changes in temperature, salinity and alkalinity
over time. Despite less than full control over
these parameters, the system was suffi cient for
long term experimentation at contrasting pCO
2(Fig. 2E), pH (Fig. 2A) and Omega Ar (Fig. 2F)
levels.
The natural variability of pH and pCO
2along
the coast of Chile (Torres et al. 2011; Torres et
al. 1999) is extreme when compared to other
geographic areas (e.g., Tropical waters (Astor
et al. 2005)), hence the fl uctuation in carbonate
system parameters in the different treatments
shown here is not unusual for marine life
in this region. Moreover a fully constant
chemostat (for pH or
Ω
Ar) might be considered
unrealistic for simulating high-CO
2scenarios to
which coastal organisms in Eastern Boundar y
Current systems may be exposed. Therefore we
conclude that the performance of the system
described here is adequate to simulate
high-CO
2scenarios for Chilean coastal waters under
laborator y conditions.
The robustness of this system makes it
suitable for short and long-term experiments
(months to years), necessar y to adequately
investigate the consequences of OA on marine
inver tebrates. Using the system described
here we have been able to rear egg-capsules
of
Concholepas concholepas
(Bruguière, 1789)
during almost their entire developing period
until hatching (i.e., 30-60 days of rearing), and
small juveniles of the same species originating
from competent lar vae collected in the fi eld (i.e.
1 to 2 years of rearing, (Manríquez et al. 2013)).
Other species such as the mitilid
Mytilus
chilensis
(Hupé, 1854) and the intertidal snail
Acanthina monodon
(Pallas, 1774) have also
been reared in this system (Navarro et al.
2013). These experiments carried out so far,
have shown signifi cant effects of OA on the
studied species, both positive and negative
(e.g., Navarro et al. 2013). This highlights
that the system is well suited for long-term
experiments investigating the consequences
of OA on the performance of early ontogenetic
stages of marine invertebrate species. Finally, it
is important to highlight that the relatively
low-cost maintenance (ca. US$ 20 per day) makes
this system economically feasible for a wide
range of marine laborator y facilities.
ACKNOWLEDGEMENTS:We thank Constanza Maureira, Nolasca Valdes, Maria Elisa Jara, Emilio Alarcon and Tania Optiz for their assistance in monitoring the carbonate system parameters and in the maintenance of the system. This work was supported by Programa de Investigación Asociativa, PIA-CONICYT-CHILE (Grant Anillos ACT-132 to RT, PHM, NAL, CV, MAL & JMN), Project Fondecyt Grant 1090624 (to NL CV, MAL, RT and PHM) and Project Fondecyt Grant 11110407 (CD). We thank two anonymous reviewers for helping us with their valuable comments and suggestions.
LITERATURE CITED
ASTOR YM, MI SCRANTON, F MULLER-KARGER, R BOHRER & J GARCÍA (2005) fCO2 variability at the CARIACO tropical coastal upwelling time series station. Marine Chemistr y 97: 245-261. CALDEIR A K & ME WICKETT (2003) Anthropogenic
carbon and ocean pH. Nature 425: 365.
DICKSON AG & FJ MILLERO (1987) A comparison of the equilibrium constants for the dissociation of carbonic acid in seawater media. Deep Sea Research 34: 1733-1743.
DOE (19 94) Handbook of methods for the analysis of the various parameters of the carbon dioxide system in sea water; version 2.1. U. S. Department of Energy, (on line) http://cdiac.ornl.gov/oceans/ DOE_94.pdf (accessed 29 August, 2013).
FANGUE NA, MJ O’DONNELL, MA SEWELL, PG MATSON, AC MACPHERSON, et al. (2010) A laborator y-based, experimental system for the study of ocean acidification ef fects on marine inver tebrate lar vae. Limnology Oceanography Methods 8: 441-452.
GATTUSO J-P, K GAO, K LEE, B ROST & KG SCHULZ (2010) Approaches and tools to manipulate the carbonate chemistr y. In: U Riebesell, VJ Fabr y, L Hansson & J-P Gattuso (eds) Guide to best practices for ocean acidification research and data reporting: 41-52. Publications Offi ce of the European Union, Luxembourg.
HARALDS SON C, LG ANDERSON, M HASSELLÖV, S HULTH & K OLSSON (1997) Rapid, high-precision potentiometric titration of alkalinity in ocean and sediment pore waters. Deep Sea Research Part I 44: 2031-2044.
KROEKER KJ, RL KORDAS, R CRIM, IE HENDRIKS, L RAMAJO, et al. (2013) Impacts of ocean acidifi cation on marine organisms: quantifying sensitivities and interaction with warming. Global Change Biology 19: 1884-1896.
LEWIS E & D WALLACE (1998) Program developed for CO2 system calculations. Carbon Dioxide Information Analysis Center, (on line) URL: h t t p : / / c d i a c . o r n l . g o v / o c e a n s / c o 2 r p r t . h t m l (accessed 29 August, 2013).
MANRÍQUE Z PH, ME JARA, ML MARDONES, JM NAVARRO, R TORRES, et al. (2013) Ocean acidifi cation disrupts prey responses to predator cues but not net prey shell growth in Concholepas concholepas (loco). PLoS ONE 8: e68643.
MEHRBACH C, CH CULBERSON, JE HAWLEY & RN PYTKOWICZ (1973) Measurement of the apparent dissociation constants of carbonic acid in seawater at atmospheric pressure. Limnology and Oceanography 18: 897-907.
M E I N SH AUS E N M, SJ SM I T H, K CALVI N , JS DANIEL, MLT KAINUMA, et al. (2011) The RCP greenhouse gas concentrations and their
extensions from 1765 to 2300. Climatic Change 109: 213-241.
NAVARRO J M, R TORRES, K ACUÑA, C DUARTE, PH MANRIQUEZ, et al. (2013) Impact of medium-term exposure to elevated pCO2 levels on the physiological energetics of the mussel Mytilus chilensis. Chemosphere 90: 1242-1248.
ORR JC, VJ FABRY, O AUMONT, L BOPP, SC DONEY, et al. (2005) Anthropogenic ocean acidifi cation over the twenty-fi rst centur y and its impact on calcifying organisms. Nature 437: 681-686. RAVEN J, K CALDEIRA, H ELDERFIELD, O
HOEGH-GULDBERG, P LISS, et al. (2005) Ocean acidification due to increasing atmospheric carbon dioxide. Policy document 12/05, The Royal Society, London.
RIAHI K, A GRUBLER & N NEBOJSA (2007) Scenarios of long-term socio-econiomic and environmental d e v e l o p m e n t u n d e r c l i m a t e s t a b i l i z a t i o n . Technological Forecasting & Social Change 74: 887-935.
TORRES R, S PANTOJA, N HARADA, HE GONZÁLEZ, G DANERI, et al. (2011) Air-sea CO2 fluxes along the coast of Chile: From CO2 outgassing in central nor thern upwelling waters to CO2 uptake in southern Patagonian fjords. Journal of Geophysical Research 116: C09006.
TORRES R, D TURNER, N SILVA & J RUTTLANT (1999) High short-term variability of CO2 fl uxes during an upwelling event off the Chilean coast at 30S. Deep Sea Research Part I 46: 1161-1179.
VUUREN DP, J EDMONDS, M KAINUMA, K RIAHI, A THOMSON, et al. (2011) The representative concentration pathways: an over view. Climatic Change 109: 5-31.
WEDBORG M, DR TURNER, LG ANDERSON & D DYRSSEN (2007) Determination of pH. In: K Grasshof f, K Kremling & M Ehrhardt (eds) Methods of seawater analysis: 109-125. Third Edition, Wiley-VCH Verlag GmbH, Weinheim.
Editorial responsibility: Álvaro T. Palma