TítuloInfluence of Size on the Economic Feasibility of Floating Offshore Wind Farms
13
0
0
Texto completo
(2) Sustainability 2018, 10, 4484. 2 of 13. However, one of the most important issues in terms of an offshore wind farm is to be competitive in economic terms. In this sense, the LEANWIND project studied how to reduce the costs of farms analyzing their installation, operation and maintenance, and logistics and supply-chain [5]. Europe is the most important area in terms of offshore wind energy around the world [6,7]. It represents 3589 offshore wind generators connected to the grid by the end of 2016. In addition, European offshore wind energy industry has grown in 338 offshore wind generators installed in 2016 [6]. Offshore wind farms are installed in a mean water depth of 29 m and in a mean distance from the offshore farm to shore of 44 km [6]. Regarding the type of offshore wind platforms installed in the offshore farms, there are several types of platforms [8–13], such as monopiles, jackets, and semisubmersible. However, the majority are monopiles (81%). Nevertheless, there also are gravity based foundations (7.5%), jackets (6.6%), tripods (3.2%), and tripiles (1.9%) [6]. Therefore, all the offshore wind farms located in Europe are composed of fixed structures (monopiles, jackets, tripiles, etc.) [14], which are mainly installed in the North Sea [6,15]. These platforms are joined to an offshore wind generator with an average rated power of 4.8 MW [6]. Recently, Navantia Fene shipyard, located in Fene (A Coruña, Spain), is building five spar platforms which will be installed in the first floating offshore wind farm, located in Scotland. Regarding floating offshore wind, there are three main types of platforms [16]: spar, such as the Hywind concept [17,18]; Tensioned Leg Platform (TLP) [19,20], such as the concept developed by Blue H Technologies; and semisubmersible platforms [21–23], such as the WindFloat structure. Spar and semisubmersible concepts are the most developed technologies. In fact, a floating offshore wind farm of 5 Hywind structures has been installed in UK and a floating offshore wind farm of semisubmersible platforms is planned to be installed in Portugal in the future. These floating platforms have an advantage regarding the fixed structures: the installation in deep waters. Therefore, they can be installed in more locations than the platforms that fix to the seabed, which can only be installed in shallow waters. Floating offshore wind technology is being developed to create new solutions for deep waters. In this sense, there are many studies about the design of the floating platforms [10,24], but there is less information about the economic aspects of the farms [19,25]. Therefore, this paper aims to introduce some economic aspects of floating offshore wind that are useful for planning this type of farms. Some authors have considered the influence that noise has on the layout of an offshore farm [26], the environmental impacts [27,28], policies [29], evaluate the best offshore locations [30]; and to analyze the financing and risks of offshore wind [31] and other marine uses [32], or the influence of the compressed air energy storage in an offshore farm [33]. Others explain the influence of optimizing the site of wind turbines [34], but without considering offshore locations, or its electric lines [35]. The influence on costs and the total power of the farms has been also analyzed [36], but for the case of monopile foundations, which are located in shallow waters. On the other hand, it is important to notice the relevance of the size an offshore wind farm during recent years, which has increased from 46.3 MW in 2006 to 379.5 MW in 2016 [6]. This last value has increased in 12% the total power of the farm regarding the previous year [6]. It represents that the mean number of offshore wind turbines per offshore wind farm was 79 in 2016 in Europe. Ulla et al. analyzed the impact that offshore and onshore wind has on the property prices homes in Denmark [37]. Sokosloski et al. consider the influence that the public opinion has in terms of offshore wind farms [38]. They analyzed the results of two surveys: one general survey about the aspects related to the offshore wind (without disaggregating fixed of floating offshore farms) considering the New England resident, and other one considering a particular offshore wind farm. They also consider the influence of the political outlook (Republicans or Democrats) in the opinion of the people. Their results indicate the importance of where and how politicians should carry out policies related to offshore wind farms in order to satisfy the public opinion of the citizens of the area where the farm will be installed. On the other hand, Ho et al. analyze a method to locate an offshore wind farm considering its profitability, social aspects, security, and environmental issues of the farm [39] taking into account the Delphi method. They consider their influence in the marine policy.
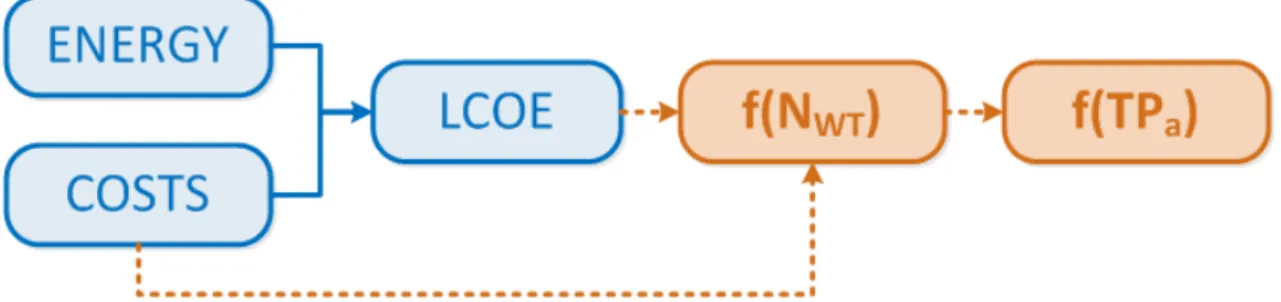
(3) Sustainability 2018, 10, 4484. 3 of 13. that Governments should develop. In terms of the profitability, they identify the following criteria: “distance from grid connections, the optimum wind turbine spacing for minimal energy loss, the ocean waves challenging offshore wind farm construction/maintenance, the suitable ocean depth for a wind turbine foundation, the distance from ocean structures, the wind speeds and directions, the wind turbine sizes, the proximity to energy demand, the proximity to ports and services, the investment incentives, the production incentives, the feed-in-tariff for offshore wind energy, the distance from oil and gas fields, the distance from commercial fishing areas, the distance from shipping and flight risks”. Regarding the social aspects, they considered: “the visual impact, the presence of tourist aspects, the local acceptance and the employment opportunities”. Considering the security issues, they take into account: “the distance from maritime borders, the conflict of the farm with Navy use and the Air Force navigational risks from wind turbines”. Finally, taking into account the environmental issues, they analyze: “the distance from marine parks or marine protected areas, the distance from habitats for endangered species or coral reefs, the distance from wildlife habitat, the distance from bird’s paths, the impact of noise pollution”. Castro-Santos et al. [40] describes a methodology to calculate the costs of a floating offshore wind farm following the main stages of its life-cycle: “definition, design, manufacturing, installation, exploitation, and dismantling”. This method presented for a floating offshore wind farm has been generalized for a floating offshore renewable energy farm in Castro-Santos et al. [41]. The present paper analyzes the influence of size in the offshore wind farms. This work resulted from these two previous papers, where the methodology has been developed (for the case studies of the Galician region in Castro-Santos et al. [40] and for Portugal in Castro-Santos et al. [41]), and the conclusions of a sensitivity study carried out in a previous paper [42]. It explains that the size of the farm is an important parameter of an offshore wind farm. This is the reason why this paper was made, in order to analyze how is this influence. In this context, the objective of this paper is to analyze the importance of the size of the farm in the economic aspects (LCOE (Levelized Cost Of Energy) and costs) of a floating offshore wind farm installed in deep waters (more than 50–60 m) [24,43]. These economic parameters depend on the number of wind turbines, which determines the size of the farm [42]. This influence has been calculated considering a particular area, which is represented using the correspondent map of the location. Eighteen alternatives have been studied in terms of the global power of the offshore wind farm (100, 200, 300, 400, 500, and 600 MW) and the types of substructures considered (spar, semisubmersible and Tensioned Leg Platform). The location selected to analyze the case of study is Galicia, a Spanish Northwest region. Results obtained show the influence that the size of the farm has in the LCOE and costs of a floating wind farm. It is useful for Governments to develop marine special policies in order to plan the marine spaces where offshore wind farms can be installed in the future of this technology. 2. Methodology The method proposed analyzes the influence that the size of a floating offshore wind farm has in two economic aspects of the farm: the LCOE and the costs. The calculation of the LCOE of a floating offshore farm depends on several variables [42] (see Figure 1): the wind scale factor related to wind speed, the cost of the wind turbine, the capital cost and the number of offshore wind turbines. In addition, the costs of a floating offshore farm depend on the number of wind turbines, the cost of the offshore generator, the distance from shore to the offshore location and the diameter of the wind turbine [42]. Consequently, the number of offshore wind generators is a piece of great importance to establish the economic aspects of a floating offshore wind installation. The method to calculate LCOE and costs of the farm has been developed in previous studies [40,41,44]..
(4) Sustainability 2018, 10, 4484 Sustainability 2018, 10, 4484. 4 of 13 4 of 13. Figure 1. Influence of the size of the farm in the LCOE (Levelized Cost Of Energy) and costs of a Figure 1. Influence of the size of the farm in the LCOE (Levelized Cost Of Energy) and costs of a floating offshore farm. floating offshore farm.. The Levelized Cost Of Energy (LCOE) depends on the life-cycle costs of the floating offshore The Levelized Cost Of Energy (LCOE) depends on the life-cycle costs of the floating offshore wind farm (LCSt ), the energy produced by the farm (Et ), the capital cost (r) and the number of years of wind farm (LCS ), the energy produced by the farm (𝐸 ), the capital cost (𝑟) and the number of years the project (Nfarm ), such as Equation (1) is shown [45]. of the project (𝑁 ), such as equation (1) is shown [45]. Nfarm LCSt LCS ∑∑t=0 (1+r)t (1) LCOE = N 1 + 𝑟 LCOE = ∑ farm Et (1) t t=0 (1𝐸 + r ) ∑ 1+𝑟 Moreover, group of points (a (a map) map) Moreover, the the influence influence of of the the size size of of the the farm farm has has been been calculated calculated for for aa group of points of a specific location, not only for a single value, such as other studies have previously developed. of a specific location, not only for a single value, such as other studies have previously developed. The has been been calculated calculated considering considering the the farm farm size, size, The total total number number of of offshore offshore wind wind turbines turbines (N (𝑁WT)) has which is an an input, input,and andturbine turbinesize, size,which which fixed at 5.075 MW. However, it has considered which is is is fixed at 5.075 MW. However, it has beenbeen considered that that a limitation in the number of wind turbines per row (N ) and the number of lines of the the farm a limitation in the number of wind turbines per row (𝑁 WT) Rand the number of lines of farm (kWT b ). In this sense, three turbines have been considered per each row of the network of the offshore ). In this sense, three turbines have been considered per each row of the network of the offshore (𝑘 farm taking into consideration the power supported by a particular type of offshore electric cable. farm taking into consideration the power supported by a particular type of offshore electric cable. It It is because the manufacturer limits the size of the electric cable. Therefore, the number of offshore is because the manufacturer limits the size of the electric cable. Therefore, the number of offshore wind turbines is calculated using Equation (2): wind turbines is calculated using Equation (2):. 𝑁 = N∙WT 𝑘 R ·kWT b 𝑁 N=WT (2) (2) On the other hand, the total number of lines considering 𝑇𝑃 as an input is given by 𝑘 , as On the hand, the total number of lines considering TPa as an input is given by kWT , as equation (3) other is shown. Equation (3) is shown. 𝑇𝑃 𝑘 = (3) TPa 𝑃 kWT = ∙ 𝑁 (3) PWT · NWT R Being: Being: • 𝑇𝑃 : nominal power of the farm (MW). • TP of the farm (MW). 𝑃 a :: nominal turbine’spower rated power (MW). • 𝑁 : Number of wind turbines per row in the farm. • PWT : turbine’s rated power (MW). • N of wind turbines persize row(𝑇𝑃 in )the farm. R : Number WTthe is calculated considering equation (4). It has been On other hand, the actual farm assumed as other an input to analyze thefarm influence of rthe in the economic aspects of the(4). farm. On the hand, the actual size (TP ) issize calculated considering Equation It has been assumed as an input to analyze the𝑇𝑃 influence = 𝑘 of ∙ 𝑁the size ∙ 𝑃 in the economic aspects of the farm. (4) 3. Case of Study. TPr = kWT · NWTR · PWT. (4). 3. Case of Study Several alternatives have been studied in this paper. Considering different total power of the farm and different floating offshore wind structures. A previous study [42] has established the Several alternatives have been studied in this paper. Considering different total power of the farm importance of the number of offshore wind turbines in order to determine the economic aspects of a and different floating offshore wind structures. A previous study [42] has established the importance floating wind farm. Therefore, in this article six different values for the total power of the farm have of the number of offshore wind turbines in order to determine the economic aspects of a floating wind been considered (see Table 1): 100 MW, 200 MW, 300 MW, 400 MW, 500 MW, and 600 MW. However, farm. Therefore, in this article six different values for the total power of the farm have been considered all of them have the same type of offshore turbine of 5.075 MW of power per unit. It makes that the (see Table 1): 100 MW, 200 MW, 300 MW, 400 MW, 500 MW, and 600 MW. However, all of them have number of wind generators, calculated using equation (2), were 18, 39, 57, 78, 96, and 117 offshore wind generators, depending on the total power of the farm. Furthermore, the real total power of the.
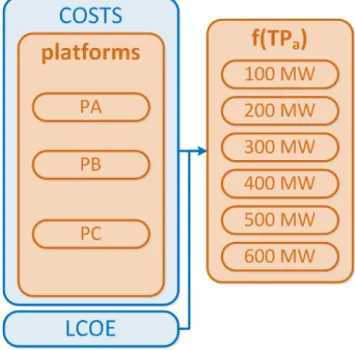
(5) Sustainability 2018, 10, 4484. 5 of 13. Sustainability 2018, 10, 4484. 5 of 13. the same type of offshore turbine of 5.075 MW of power per unit. It makes that the number of wind farm will becalculated 91.35, 197.93, 289.28, 395,85,(2), 487.20, 593.78 respectively for the farms of 100, 200, generators, using Equation wereand 18, 39, 57, MW 78, 96, and 117 offshore wind generators, 300, 400, 500 and 600 MW. depending on the total power of the farm. Furthermore, the real total power of the farm will be 91.35, 197.93, 289.28, 395,85, 487.20, and 593.78 MW respectively for the farms of 100, 200, 300, 400, 500 and Table 1. Total power of the farm and total number of wind turbines. 600 MW.. 𝑻𝑷. 𝒌. 100 200 300 400 500 600. 6.00 kWT 13.00 6.00 19.00 13.00 26.00 19.00 32.00 26.00 32.00 39.00. 𝑵. 𝑻𝑷. 𝑾𝑻𝑹 𝒓 turbines. Table 1. Total𝒂power of the𝑾𝑻 farm and total number of wind. TPa 100 200 300 400 500 600. 39.00. 18 39NWTR 57 18 78 39 57 96 78 11796 117. 91.35 197.93 289.28 395.85 487.20 593.78. TPr 91.35 197.93 289.28 395.85 487.20 593.78. In addition, three types of floating platforms have been taken into consideration: semisubmersible or PAtypes [46],of Tensioned Leg Platform or PBinto [10]consideration: and a spar platform or PC) [10] In addition, three floating platforms have(TLP), been taken semisubmersible (see 2). or PAFigure [46], Tensioned Leg Platform (TLP), or PB [10] and a spar platform or PC) [10] (see Figure 2).. Figure 2. Alternatives of study. Figure 2. Alternatives of study.. All these options have been studied for the area of Galicia (Figure 3), located in the Northwest of All these options have been studied for the area of Galicia (Figure 3), located in the Northwest Spain, where the wind resource is optimum for these types of technologies. This region has the best of Spain, where the wind resource is optimum for these types of technologies. This region has the values of offshore wind speed of the Iberian Peninsula. best values of offshore wind speed of the Iberian Peninsula..
(6) Sustainability 2018, 10, 4484 Sustainability 2018, 10, 4484 Sustainability 2018, 10, 4484. 6 of 13 6 of 13 6 of 13. Figure 3. Location of of thethe Galician region. Figure Location Galician region. Figure 3. 3. Location of the Galician region.. Finally, two economic aspects aspectsare are calculated, LCOE and the for costs, for the alternatives previous Finally, calculated, the the LCOE and the costs, the previous Finally,two two economic aspects are calculated, the LCOE and the costs, for the previous alternatives regarding the total power thethe farm andofthe types of Their platforms. Their objective is to regarding theregarding total power the farmofand types objective is to visualize alternatives theoftotal power of the farm andplatforms. the types of platforms. Their objective is into to visualize into the corresponding map, the influence ofthe thefarm size for of the farm for reducing theoffshore cost of the the corresponding map, the influence of the size of reducing the cost of the visualize into the corresponding map, the influence of the size of the farm for reducing the cost of farm. the offshore farm. Therefore, LCOE and costs have been foralternatives. a total of 18 alternatives. Therefore, LCOE and costs have been calculated forcalculated acalculated total of 18 offshore farm. Therefore, LCOE and costs have been for a total of 18 alternatives. Results 4. 4. Results 4. Results 4.1. Costs 4.1. Costs 4.1. Costs Considering the results of the costs, the highest variations are regardingregarding the cost of manufacturing Considering the results Considering the resultsof ofthethecosts, costs,thethehighest highestvariations variations are are regarding the the cost cost of of and installingand eachinstalling of the components of the farm: platforms, wind generators, anchoring, electrical manufacturing each of the components of the farm: platforms, wind generators, manufacturing and installing each of the components of the farm: platforms, wind generators, system and mooring. anchoring, electrical system and mooring. anchoring, electrical system and mooring. Figure 4 shows the variation ofthe themanufacturing manufacturing cost (C3) ofsmall the small and the farm, large farm, Figure 4 shows the variation of the manufacturing cost (C3) ofofthe and large Figure 4 shows the variation of cost (C3) the small andthe the large farm,100 100 100 MW and 600 MW respectively. It from goes fromto192.98 toM€ 439.62 forfarm a small farm of(Figure 100 MW MW and 600 MW respectively. It goes from 192.98 439.62 for ofof100 MW MW and 600 MW respectively. It goes 192.98 to 439.62 M€ fora M€ asmall small farm 100 MW (Figure 4a) and from to M€ for the big farm of 600 MW (Figure 4b). Obviously, this highest 4a)(Figure andand from 1188.9 to 1188.9 2371.4 M€2371.4 forfor the big farm ofof 600 MW (Figure 4b). this cost 4a) from 1188.9 to 2371.4 M€ the big farm 600 MW (Figure 4b).Obviously, Obviously, thishighest highest cost big is compensated by the highest value ofenergy the energy generated this case. forcost the bigthe farm isfarm compensated byby thethe highest value of the energy generated ininthis case. for for the big farm is compensated highest value of the generated thisin case.. (a) (a). (b) (b). Figure 4. Cost of manufacturing for the PA and an offshore farm of 100 MW (a) and 600 MW (b). Figure 4. Cost of manufacturing and offshore farm MW and 600 MW (b). Figure 4. Cost of manufacturing forfor thethe PAPA and anan offshore farm of of 100100 MW (a)(a) and 600 MW (b)..
(7) Sustainability 2018, 10, 4484 Sustainability 2018, 10, 4484 Sustainability 2018, 10, 4484. 7 of 13 7 of 13 7 of 13. other side, cost installing farm (C4) differs from 9.46 208.34 M€ aa small small On the other side, the cost of installing the farm (C4) differs from 9.46 to 208.34 M€ for OnOn thethe other side, thethe cost of of installing thethe farm (C4) differs from 9.46 to to 208.34 M€ forfor a small farm 100 MW (Figure 5a) to 39.23 to 518.35 M€ for big farm of 600 MW (Figure 5b). farm of 100 MW (Figure 39.23 518.35 M€ aa big farm 600 MW (Figure 5b). farm of of 100 MW (Figure 5a)5a) toto 39.23 toto 518.35 M€ forfor a big farm ofof 600 MW (Figure 5b).. (a)(a). (b)(b). Figure 5. Cost of installing for the PA and an offshore farm of 100 MW (a) and 600 MW (b). Figure 5. Cost of installing and offshore farm 100 MW and 600 MW (b). Figure 5. Cost of installing forfor thethe PAPA and anan offshore farm of of 100 MW (a)(a) and 600 MW (b).. Considering only best point geography the scenarios, Figure 66 shows shows the Considering the only the best point of the geography for all scenarios, Figure Considering thethe only thethe best point of of thethe geography forfor allall thethe scenarios, Figure 6 shows thethe variation the cost of manufacturing regarding the power of the farm. More power farm variation of cost manufacturing regarding power the farm. More power of the farm variation of of thethe cost ofof manufacturing regarding thethe power ofof the farm. More power of of thethe farm indicates more cost of manufacturing. indicates more cost manufacturing. indicates more cost ofof manufacturing.. Figure 6. Variation of of the the farm farm in in M€ M€ regarding types of of floating Figure 6. Variation the cost cost of of manufacturing manufacturing the regarding several several types floating Figure 6.structures Variationand of the cost oftotal manufacturing the farm in M€ regarding several types of floating wind different power of the farm. wind structures and different total power of the farm. wind structures and different total power of the farm.. Figure 7 shows, such as the cost of manufacturing, how the cost of installing is increasing according Figure shows, 7 shows, such cost of manufacturing, how cost installing is increasing asas thethe cost how thethe cost of of installing increasing theFigure size of7the farm. such Furthermore, the of costmanufacturing, of installing a semisubmersible platform isislower than the according the size of the farm. Furthermore, the cost of installing a semisubmersible platform is lower according the size of the farm. Furthermore, the cost of installing a semisubmersible platform is lower installation of the tensioned or the spar structures due to the way of transport of the floating platform than the installation of the tensioned or the spar structures due to the way of transport of the floating than thethe installation the tensioned structures due to theitway of transport of the floating from shipyard,of where it is built,or to the the spar offshore location, where is installed. The semisubmersible platform from the shipyard, where is built, to offshore location, where installed. The platform from shipyard, where it it isthe built, thethe offshore location, it it is is installed. The structure can the be directly towed, while spartoand tensioned structureswhere require specific vessels for semisubmersible structure can be directly towed, while the spar and tensioned structures require semisubmersible structure can be directly towed, while the spar and tensioned structures require the process. specific vessels process. specific vessels forfor thethe process..
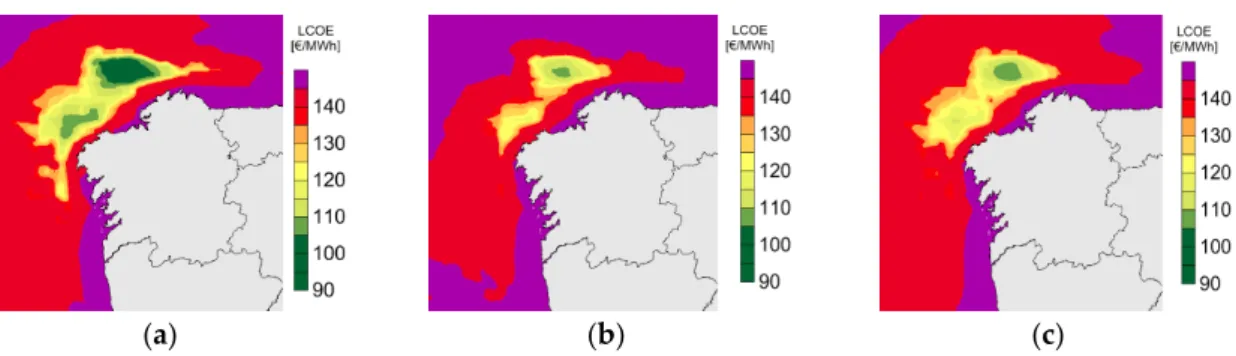
(8) Sustainability Sustainability 2018, 2018, 10, 10, 4484 4484 Sustainability 2018, 10, 4484 Sustainability 2018, 10, 4484. 88 of of 13 13 8 of 13 8 of 13. Figure 7. of cost of the farm in regarding several types of wind Figure 7. Variation Variation of the the cost of installing installing thethe farm in M€ M€ regarding several types of floating floating wind Figure 7. Variation of the cost of installing farm in M€ regarding several types of floating wind Figure 7. Variation of the cost of installing the farm in M€ regarding several types of floating wind structures and different total power of the farm. structures and different total power of the farm. structures and different total power of the farm. structures and different total power of the farm.. Levelized Cost of Energy 4.2. Levelized Cost of 4.2.4.2. Levelized Cost of Energy Energy 4.2. Levelized Cost of Energy The LCOE been calculated taking into consideration costs previously analyzed and The LCOE has been calculated taking into consideration the costs previously analyzed and The LCOE hashas been calculated taking into consideration thethe costs previously analyzed and following the equations proposed in previous papers [40,47]. Thethe LCOE has been calculated takingpapers into consideration the costs previously analyzed and following equations proposed in [40,47]. following the equations proposed in previous previous papers [40,47]. The smallest floating offshorewind wind farm considered considered has ofof total power. It gives an LCOE following the equations proposed in previous papers [40,47]. The smallest floating offshore farm has 100 MW total power. It an The smallest floating offshore wind farm considered has100 100MW MW of total power. It gives gives an from 117.05 to 1128.7 €/MWh for a farm with PA platforms (Figure 8a), from 130.03 to 1280.9 €/MWh The smallest floating offshore wind farm considered has 100 MW of total power. It gives LCOE LCOE from from 117.05 117.05 to to 1128.7 1128.7 €/MWh €/MWh for for aa farm farm with with PA PA platforms platforms (Figure (Figure 8a), 8a), from from 130.03 130.03 to to 1280.9 1280.9an for a farm PB platforms (Figure 8b), from 127.9 1282.4 for8a), a farm PCwith platforms LCOE from 117.05 toPB 1128.7 €/MWh for and a farm with PAto127.9 platforms (Figure from 130.03 to 1280.9 €/MWh for aawith farm with platforms (Figure 8b), and from to 1282.4 €/MWh for PC €/MWh for farm with PB platforms (Figure 8b), and from 127.9 to€/MWh 1282.4 €/MWh for awith a farm farm with PC (Figure (Figure 8c). €/MWh for a farm platforms 8c). platforms (Figure 8c).with PB platforms (Figure 8b), and from 127.9 to 1282.4 €/MWh for a farm with PC platforms (Figure 8c).. (a) (b) (c) (a) (b) (c) (a) (b) (c) 8. LCOE forPA the(a), PA PB (a), PB and platformsand and an ofof 100 MW. Figure 8. for and PC (c) platforms offshore farm 100 MW. FigureFigure 8. LCOE LCOE for the the PA (a), PB (b), (b),(b), and PCPC (c)(c) platforms and anoffshore offshorefarm farm of 100 MW. Figure 8. LCOE for the PA (a), PB (b), and PC (c) platforms and an offshore farm of 100 MW. The farm of MW of total power gives LCOE from 100.31 882.93 €/MWh a farm with The farm of MW of power gives an LCOE from 100.31 to 882.93 €/MWh for aa farm with The farm of 200 200200 MW of total total power gives anan LCOE from 100.31 to to 882.93 €/MWh forfor farm with PA platforms (Figure 9a), from 112.14 to 1011.4 €/MWh for a farm with PB platforms (Figure The farm of 200 MW of total power gives an LCOE from 100.31 to 882.93 €/MWh for a farm with PA PA platforms platforms (Figure (Figure 9a), 9a), from from 112.14 112.14 to to 1011.4 1011.4 €/MWh €/MWh for for aa farm farm with with PB PB platforms platforms (Figure (Figure 9b), 9b), and and9b), and from 109.99 to 1012.7 €/MWh for a farm with PC platforms (Figure 9c). PA109.99 platforms (Figure 9a), from to 1011.4 €/MWh for a farm9c). with PB platforms (Figure 9b), and from to €/MWh for farm PC (Figure from 109.99 to 1012.7 1012.7 €/MWh for aa112.14 farm with with PC platforms platforms (Figure 9c). from 109.99 to 1012.7 €/MWh for a farm with PC platforms (Figure 9c).. (a) (a) (a). (b) (b) (b). (c) (c) (c). Figure 9. LCOE for PB (c) platforms an offshore farm of 200 MW. Figure 9. for PA (a), PB and PC (c) and an farm of MW. Figure 9. LCOE LCOE for the thethe PAPA (a),(a), PB (b), (b),(b), andand PCPC (c) platforms platforms andand an offshore offshore farm of 200 200 MW. Figure 9. LCOE for the PA (a), PB (b), and PC (c) platforms and an offshore farm of 200 MW.. Thirdly, farm 300 MW total power gives LCOE from 96.29 820.78 €/MWh Thirdly, the farm of 300 MW of total power gives an LCOE from 96.29 to 820.78 €/MWh for aa a Thirdly, thethe farm of of 300 MW of of total power gives anan LCOE from 96.29 toto 820.78 €/MWh forfor farm with platforms (Figure 10a), from 107.83 to 943.19 €/MWh a farm with PB platforms Thirdly, the farm of 300 MW offrom total power gives an LCOE from towith 820.78 for a farm with PA platforms (Figure 10a), 107.83 to 943.19 €/MWh for a96.29 PB platforms farm with PAPA platforms (Figure 10a), from 107.83 to 943.19 €/MWh forfor a farm farm with PB€/MWh platforms (Figure 10b), and from 105.68 to 944.33 €/MWh for a farm with PC platforms (Figure 10c). farm with PA platforms (Figure 10a), from 107.83 to 943.19 €/MWh for a farm with PB platforms (Figure (Figure 10b), 10b), and and from from 105.68 105.68 to to 944.33 944.33 €/MWh €/MWh for for aa farm farm with with PC PC platforms platforms (Figure (Figure 10c)). 10c)). (Figure 10b), and from 105.68 to 944.33 €/MWh for a farm with PC platforms (Figure 10c))..
(9) Sustainability 2018, 10, 4484. 9 of 13. Sustainability Sustainability 2018, 2018, 10, 10, 4484 4484. (a) (a). 99 of of 13 13. (b) (b). (c) (c). Figure 10. LCOE for PB (c) platforms an offshore farm of 300 MW. Figure 10. for PA (a), PB and PC (c) and an farm of MW. Figure 10. LCOE LCOE for the thethe PAPA (a),(a), PB (b), (b),(b), andand PCPC (c) platforms platforms andand an offshore offshore farm of 300 300 MW.. The farm of MW of total power gives LCOE from 93.70 782.61 €/MWh a farm with The farm of MW of power gives an LCOE from 93.70 to 782.61 €/MWh for aa farm with The farm of 400 400400 MW of total total power gives anan LCOE from 93.70 to to 782.61 €/MWh forfor farm with PA platforms (Figure 11a), from 105.07 to 901.35 €/MWh for a farm with PB platforms (Figure 11b), PA PA platforms platforms (Figure (Figure 11a), 11a), from from 105.07 105.07 to to 901.35 901.35 €/MWh €/MWh for for aa farm farm with with PB PB platforms platforms (Figure (Figure 11b), 11b), and from 102.91 to 902.28 €/MWh a farm with platforms (Figure 11c). and from 102.91 to €/MWh for aa farm with PC platforms (Figure 11c). and from 102.91 to 902.28 902.28 €/MWh for for farm with PCPC platforms (Figure 11c).. (a) (a). (b) (b). (c) (c). Figure 11. for PA (a), PB and PC (c) and an farm of MW. Figure 11. LCOE for PB (c) platforms an offshore farm of 400 MW. Figure 11. LCOE LCOE for the thethe PAPA (a),(a), PB (b), (b),(b), andand PCPC (c) platforms platforms andand an offshore offshore farm of 400 400 MW.. The farm of MW of total power gives LCOE from 92.69 765.82 €/MWh a farm with The farm of MW of power gives an LCOE from 92.69 to 765.82 €/MWh for aa farm with The farm of 500 500500 MW of total total power gives anan LCOE from 92.69 to to 765.82 €/MWh forfor farm with PA platforms (Figure 12a), from 103.99 to 882.93 €/MWh for a farm with PB platforms (Figure 12b), PA PA platforms platforms (Figure (Figure 12a), 12a), from from 103.99 103.99 to to 882.93 882.93 €/MWh €/MWh for for aa farm farm with with PB PB platforms platforms (Figure (Figure 12b), 12b), and from 101.82 to 883.68 €/MWh a farm with platforms (Figure 12c). and from 101.82 to €/MWh for aa farm with PC platforms (Figure 12c). and from 101.82 to 883.68 883.68 €/MWh for for farm with PCPC platforms (Figure 12c).. (a) (a). (b) (b). (c) (c). Figure 12. for PA (a), PB and PC (c) and an farm of MW. Figure 12. LCOE for PB (c) platforms an offshore farm of 500 MW. Figure 12. LCOE LCOE for the thethe PAPA (a),(a), PB (b), (b),(b), andand PCPC (c) platforms platforms andand an offshore offshore farm of 500 500 MW.. Finally, biggest farm, whose total power is 600 MW, gives LCOE from 91.74 751.45 €/MWh Finally, biggest farm, whose total power is MW, gives an LCOE from 91.74 to 751.45 €/MWh Finally, biggest farm, whose total power is 600 600 MW, gives anan LCOE from 91.74 toto 751.45 €/MWh for a farm with PA platforms (Figure 13a), from 102.97 to 867.18 €/MWh for a farm with PB platforms for for aa farm farm with with PA PA platforms platforms (Figure (Figure 13a), 13a), from from 102.97 102.97 to to 867.18 867.18 €/MWh €/MWh for for aa farm farm with with PB PB platforms platforms (Figure 13b), and from 100.8 to 867.73 €/MWh a farm with platforms (Figure 13c). (Figure 13b), and from 100.8 to €/MWh for aa farm with PC platforms (Figure 13c). (Figure 13b), and from 100.8 to 867.73 867.73 €/MWh forfor farm with PCPC platforms (Figure 13c)..
(10) Sustainability 2018, 10, 4484. 10 of 13. Sustainability 2018, 10, 4484. 10 of 13. Sustainability 2018, 10, 4484. (a). 10 of 13. (b). (c). Figure 13. LCOE for the PA (a), PB (b), and PC (c) platforms and an offshore farm of 600 MW.. (a). (b). (c). Figure 13. LCOE PB (c) platforms and offshore farm of 600 MW. Figure LCOE for the PA (a), PB (b),(b), andand PC PC (c) of platforms and an an offshore farm of MW, 600 MW. We can13. observe thatfor inthe allPA the(a), previous types offshore farms studied (100 200 MW, 300 MW, 400 MW, 500 MW, and 600 MW), the best value for LCOE is for the PA platform can observe thatininallallthe the previoustypes types of offshore offshore farms MW, MW, WeWe can observe that previous of farms studied studied (100 MW,200 200 MW, 300 (semisubmersible structure). Additionally, Figure 14 represents the (100 evolution ofMW, the300 LCOE 400 MW, 500 MW, and 600 MW), the best value for LCOE is for the PA platform (semisubmersible MW, 400 MW, 500 MW, and 600 MW), the best value is forofthe considering several types of floating wind platforms and thefor sixLCOE alternatives the PA totalplatform power for structure). Additionally, Figure 14 represents the evolution of the LCOE considering several types of (semisubmersible structure). Additionally, Figure 14 represents the evolution of the LCOE the farm. This figure only takes into account the values of the best point of the geography. It shows floating wind platforms and the alternatives of the total power forfor theallfarm. Thistotal figure only wind takes considering several typeswhen of floating wind platforms and the six alternatives of types the power for how the LCOE is lower thesix total power of the farm is increased the of floating into account the values of the best point of the geography. It shows how the LCOE is lower when the thestructures farm. This(spar, figure only takes into account values of the point offor the geography. semisubmersible, and the tensioned). Forbest instance, the case ofIt shows the PA total farm is increased for all types of floating structures (spar, semisubmersible, how thepower LCOEof is the lower when the total power of the farm is increased for all€/MWh the types floating wind (semisubmersible platform), the LCOE is the reduced from 117.05wind to 91.74 forofthe 100 MW and and tensioned). For instance, for the case of the PA (semisubmersible platform), the LCOE is reduced structures (spar, semisubmersible, and tensioned). For instance, for value the case of the the 600 MW respectively, which represents a reduction of 21.63% of the regarding the PA small from 117.05 91.74 forLCOE the 100 MW and the MW is respectively, which represents a reduction (semisubmersible platform), isplatform), reduced from 117.05 toreduced 91.74 €/MWh for theto100 MW and farm; for thetocase of€/MWh the PBthe (tensioned the600 LCOE from 130.03 102.97 €/MWh of600 21.63% of the value regarding the small farm; for the case of the PB (tensioned platform), the LCOE is thefor MW respectively, which represents a reduction of 21.63% of the value regarding the small the 100 MW and the 600 MW respectively, which represents a reduction of 20.81%; and for the reduced from 130.03 to 102.97 €/MWh for the 100 MW and the 600 MW respectively, which represents farm; of theplatform), PB (tensioned platform), the LCOE reduced to 102.97 casefor of the the case PC (spar the LCOE is reduced fromis 127.90 to from 100.80130.03 €/MWh for the€/MWh 100 MW athe reduction of 20.81%; and for the case of the PC (spar platform), the LCOE is reduced from 127.90 forand 100 MW and the 600 MW respectively, which represents a reduction of 20.81%; and for the to the 600 MW respectively, which represents a reduction of 21.19%. Therefore, we can conclude 100.80 €/MWh for the 100 MW and thebe 600 MW respectively, which represents a reduction of MW 21.19%. case ofthese the PC (spar platform), the LCOE iscarried reduced 127.90 toa 100.80 €/MWh forthan the 100 MW of that types of installations should outfrom considering big farm of more Therefore, we can conclude that these types of installations should be carried out considering a big and thepower 600 MW which represents a reduction 21.19%. Therefore, we can conclude total andrespectively, independently of the type of floating windof structure. farm of types more of than 100 MW ofshould total power and out independently wind that these installations be carried consideringofa the big type farm of of floating more than 100structure. MW of. total power and independently of the type of floating wind structure.. Figure 14. Evolution of the LCOE in €/MWh regarding several types of floating wind structures and different power of of the the LCOE farm. in €/MWh regarding several types of floating wind structures and Figure 14.total Evolution. different total power of the farm. In conclusion, results focused in the LCOE and the types costs,of two parameters that have influence Figure 14. Evolution of theare LCOE in €/MWh regarding several floating wind structures and ondifferent the of the farm. the and best the floating for the same location is the total power of Considering theare farm. In size conclusion, results focusedthe in LCOE the LCOE costs,structure two parameters that have influence. semisubmersible platform. This value reduced value around a 21% when totallocation power of the on the size of the farm. Considering theisLCOE the abest floating structure for thethe same is the farm is increased for all the types of platforms and farms. Therefore, a floating offshore wind farm In conclusion, results are This focused in the LCOE and the costs, twoa parameters thattotal havepower influence semisubmersible platform. value is reduced a value around 21% when the of the should be higher than a 100 MW farm. In addition, installation and manufacturing costs have great onfarm the size of the farm. Considering the LCOE the best floating structure for the same location is is increased for all the types of platforms and farms. Therefore, a floating offshore windthe farm variations considering the size of the farm. semisubmersible platform. ThisMW value is reduced a value around aand 21%manufacturing when the totalcosts power of the should be higher than a 100 farm. In addition, installation have great farm is increased for all the platforms variations considering the types size ofofthe farm. and farms. Therefore, a floating offshore wind farm should be higher than a 100 MW farm. In addition, installation and manufacturing costs have great variations considering the size of the farm. 5. Conclusion and Policy Implications. 5. Conclusion and Policy Implications.
(11) Sustainability 2018, 10, 4484. 11 of 13. 5. Conclusion and Policy Implications This paper has developed a method to analyze the economic influence, in terms of its LCOE and its costs, of the size of floating offshore wind farms. The economic aspects analyzed, LCOE and the costs, depend on the number of floating offshore wind turbines, which establishes the importance of the size of the farm. In addition, this influence has been carried out for a map in a specific location. Regarding the case of study, some alternatives have been considered taking into account the total power of the farm (100 MW, 200 MW, 300 MW, 400 MW, 500 MW, and 600 MW), which involve a different number of floating offshore wind generators, and the kinds of floating structures (semisubmersible, tensioned and spar). All these aspects have been studied for the location of Galicia (Spain). Results are centred in two main economic influences of the size of the farm: the LCOE and the costs. In terms of LCOE, the semisubmersible structure has the best economic value. In addition, the LCOE reduces its value when the total power of the floating offshore wind farm is increased for all kinds of offshore structures. This reduction is from 20.81% to 21.63% depending on the type of platform and considering a farm of 100 MW and a farm of 600 MW. Consequently, the installation of a floating wind farm should consider a big farm of more than 100 MW. On the other hand, costs of manufacturing and installing have the biggest variations regarding the size of the farm. This study will help Governments to know the influence that size has in the economic development of a floating offshore wind farm located in a particular location. This fact can be considered by Governments in order to analyze the offshore renewable energy policies of their countries. For instance, they need to know the size of the locations where a floating offshore wind farm will be installed at sea in order to analyze their maritime traffic or other factors. It is directly related to the size of the farm in terms of the total power, which has been analyzed in the present paper. In addition, this tool can help to plan the characteristics of a farm in future investments. It helps to analyze the best locations in economic terms where a floating offshore wind farm can be installed to focus the main efforts of Governments in these areas. Author Contributions: Formal analysis, L.C.-S.; Investigation, L.C.-S.; Methodology, L.C.-S.; Resources, L. C.-S., A.F.-V., C.Á.-F. and L.C.; Software, L.C.-S.; Writing—original draft, L.C.-S.; Writing—review and editing, A.F.-V., C.Á.-F., L.C. and L.C.-S. Funding: This research was funded by the European Regional Development Fund through the Interreg Atlantic Area Programme. Acknowledgments: This work was performed in the scope of the ARCWIND project (EAPA_344/2016), co-financed by the European Regional Development Fund through the Interreg Atlantic Area Programme. Conflicts of Interest: The authors declare no conflict of interest.. References 1. 2. 3. 4. 5. 6. 7. 8.. Hoogwijk, M.; de Vries, B.; Turkenburg, W. Assessment of the global and regional geographical, technical and economic potential of onshore wind energy. Energy Econ. 2004, 26, 889–919. [CrossRef] WindEurope. Wind in Power. 2016 European Statistics; WindEurope: Brussels, Belgium, 2017. Lamy, J.V.; Azevedo, I.L. Do tidal stream energy projects offer more value than offshore wind farms? A case study in the United Kingdom. Energy Policy 2018, 113, 28–40. [CrossRef] WindEurope. Wind Energy in Europe: Scenarios for 2030; WindEurope: Brussels, Belgium, 2017. WindEurope. Driving Cost Reductions In offshore Wind; WindEurope: Brussels, Belgium, 2017. WindEurope. The European Offshore Wind Industry. Key Trends and Statistics 2016; WindEurope: Brussels, Belgium, 2017. European Wind Energy Association (EWEA). Wind in Our Sails, The Coming of Europe’s Offshore Wind Energy Industry; EWEA: Brussels, Belgium, 2011. Musial, W.; Butterfield, S.; Boone, A. Feasibility of Floating Platform Systems for Wind Turbines. In Proceedings of the 42nd AIAA Aerospace Sciences Meeting and Exhibit, Reno, Nevada, 5–8 January 2004; NREL (National Renewable Energy Laboratory): Reno, Nevada, 2004; p. 1007..
(12) Sustainability 2018, 10, 4484. 9.. 10. 11.. 12. 13. 14. 15.. 16. 17. 18. 19. 20. 21.. 22.. 23.. 24. 25. 26. 27.. 28. 29.. 12 of 13. Henderson, A.R.; Leutz, R.; Fujii, T. Potential for Floating Offshore Wind Energy in Japanese Waters. In Proceedings of the 12th International Offshore and Polar Engineering Conference, Kitakyushu, Japan, 26–31 May 2002; International Society of Offshore and Polar Engineers: Kitakyushu, Japan, 2002; Volume 3, pp. 505–512. Jonkman, J.; Matha, D. A Quantitative Comparison of the Responses of Three Floating Platforms; National Renewable Energy Laboratory (NREL): Stockholm, Sweden, 2010. Drake, K.R.; Smith, T.W.P. An investigation into the use of an articulated column supported wind turbine in water depths of 60–120 metres. In RINA Royal Institution of Naval Architects Marine Renewable and Offshore Wind Energy Papers; Royal Institution of Naval Architects: London, UK, 2010; pp. 55–62. Pérez-Collazo, C.; Greaves, D.; Iglesias, G. A review of combined wave and offshore wind energy. Renew. Sustain. Energy Rev. 2015, 42, 141–153. [CrossRef] Astariz, S.; Vazquez, A.; Iglesias, G. Evaluation and comparison of the levelized cost of tidal, wave, and offshore wind energy. J. Renew. Sustain. Energy 2015, 7, 053112. [CrossRef] Lozano-Minguez, E.; Kolios, A.J.; Brennan, F.P. Multi-criteria assessment of offshore wind turbine support structures. Renew. Energy 2011, 36, 2831–2837. [CrossRef] Henderson, A.R.; Zaaijer, M.B.; Bulder, B.; Pierik, J.; Huijsmans, R.; Van Hees, M.; Snijders, E.; Wijnants, G.H.; Wolf, M.J. Floating windfarms for shallow offshore sites. In Proceedings of the 14th International Offshore and Polar Engineering Conference, Toulon, France, 23–28 May 2004; The International Society of Offshore and Polar Engineers: Mountain View, CA, USA, 2004; pp. 120–127. Wang, C.M.; Utsunomiya, T.; Wee, S.C.; Choo, Y.S. Research on floating wind turbines: A literature survey. IES J. Part A Civ. Struct. Eng. 2010, 3, 267–277. [CrossRef] Li, Q.; Kamada, Y.; Maeda, T.; Murata, J.; Iida, K.; Okumura, Y. Fundamental study on aerodynamic force of floating offshore wind turbine with cyclic pitch mechanism. Energy 2016, 99, 20–31. [CrossRef] Myhr, A.; Bjerkseter, C.; Ågotnes, A.; Nygaard, T.A. Levelised cost of energy for offshore floating wind turbines in a life cycle perspective. Renew. Energy 2014, 66, 714–728. [CrossRef] Kausche, M.; Adam, F.; Dahlhaus, F.; Großmann, J. Floating offshore wind—Economic and ecological challenges of a TLP solution. Renew. Energy 2018, 126, 270–280. [CrossRef] Oguz, E.; Clelland, D.; Day, A.H.; Incecik, A.; López, J.A.; Sánchez, G.; Almeria, G.G. Experimental and numerical analysis of a TLP floating offshore wind turbine. Ocean Eng. 2018, 147, 591–605. [CrossRef] Aubault, A.; Cermelli, C.; Roddier, D. Windfloat: A floating foundation for offshore wind turbines. Part III: Structural analysis. In Proceedings of the ASME 28th International Conference on Ocean, offshore and Arctic Engineering OMAE2009, Honolulu, HI, USA, 31 May–5 June 2009; ASME Press: New York, NY, USA, 2009; pp. 1–8. Roddier, D.; Cermelli, C. Windfloat: A floating foundation for offshore wind turbines. Part I: design basis and qualification process. In Proceedings of the ASME 28th International Conference on Ocean, Offshore and Arctic Engineering OMAE2009, Honolulu, HI, USA, 31 May–5 June 2009; ASME Press: New York, NY, USA, 2009; pp. 1–9. Cermelli, C. Windfloat: A Floating foundation for offshore wind turbines. Part II: Hydrodynamics analysis. In Proceedings of the ASME 28th International Conference on Ocean, Offshore and Arctic Engineering OMAE2009, Honolulu, HI, USA, 31 May–5 June 2009; ASME Press: New York, NY, USA, 2009; pp. 1–9. Liu, Y.; Li, S.; Yi, Q.; Chen, D. Developments in semi-submersible floating foundations supporting wind turbines: A comprehensive review. Renew. Sustain. Energy Rev. 2016, 60, 433–449. [CrossRef] Castro-Santos, L.; Martins, E.; Guedes Soares, C. Cost assessment methodology for combined wind and wave floating offshore renewable energy systems. Renew. Energy 2016, 97, 866–880. [CrossRef] Thomsen, F.; Luedemann, K.; Piper, W.; Judd, A.; Kafemann, R. Potential effects of offshore wind farm noise on fish. Bioacoustics 2008, 17, 221–223. [CrossRef] Karloseva, A.; Nommann, S.; Nommann, T.; Urbel-Piirsalu, E.; Budzinski, W.; Czajkowski, M.; Hanley, N. Marine trade-offs: Comparing the benefits of off-shore wind farms and marine protected areas. Energy Econ. 2016, 55, 127–134. [CrossRef] Chipindula, J.; Botlaguduru, V.S.V.; Du, H.; Kommalapati, R.R.; Huque, Z. Life cycle environmental impact of onshore and offshore wind farms in Texas. Sustainability 2018, 10, 2022. [CrossRef] Jacobsson, S.; Karltorp, K. Mechanisms blocking the dynamics of the European offshore wind energy innovation system—Challenges for policy intervention. Energy Policy 2013, 63, 1182–1195. [CrossRef].
(13) Sustainability 2018, 10, 4484. 30. 31. 32.. 33. 34. 35.. 36. 37. 38. 39. 40. 41. 42. 43.. 44.. 45. 46.. 47.. 13 of 13. Vagiona, D.G.; Kamilakis, M. Sustainable site selection for offshore wind farms in the South Aegean-Greece. Sustainability 2018, 10, 749. [CrossRef] Tseng, Y.C.; Lee, Y.M.; Liao, S.J. An integrated assessment framework of offshore wind power projects applying equator principles and social life cycle assessment. Sustainability 2017, 9, 1822. [CrossRef] Jongbloed, R.H.; Van der Wal, J.T.; Lindeboom, H.J. Identifying space for offshore wind energy in the North Sea. Consequences of scenario calculations for interactions with other marine uses. Energy Policy 2014, 68, 320–333. [CrossRef] Li, B.; DeCarolis, J.F. A techno-economic assessment of offshore wind coupled to offshore compressed air energy storage. Appl. Energy 2015, 155, 315–322. [CrossRef] Elkinton, C.N.; Manwell, J.F. Algorithms for offshore wind farm layout optimization. Wind Eng. 2008, 32, 67–84. [CrossRef] Hopewell, P.D.; Castro-Sayas, F.; Bailey, D.I. Optimising the design of offshore wind farm collection networks. In Proceedings of the 41st International Power Engineering Universities Conference, Newcastle-upon-Tyne, UK, 6–8 September 2006; Northumbria University School of Computing, Engineering and Information Sciences: Newcastle-upon-Tyne, UK, 2006. Van der Zwaan, B.; Rivera-Tinoco, R.; Lensink, S.; Van den Oosterkamp, P. Cost reductions for offshore wind power: Exploring the balance between scaling, learning and R&D. Renew. Energy 2012, 41, 389–393. Jensen, C.U.; Panduro, T.E.; Lundhede, T.H.; Nielsen, A.S.E.; Dalsgaard, M.; Thorsen, B.J. The impact of on-shore and off-shore wind turbine farms on property prices. Energy Policy 2018, 116, 50–59. [CrossRef] Sokoloski, R.; Markowitz, E.M.; Bidwell, D. Public estimates of support for offshore wind energy: False consensus, pluralistic ignorance, and partisan effects. Energy Policy 2018, 112, 45–55. [CrossRef] Ho, L.-W.; Lie, T.-T.; Leong, P.T.; Clear, T. Developing offshore wind farm siting criteria by using an international Delphi method. Energy Policy 2018, 113, 53–67. [CrossRef] Castro-Santos, L.; Diaz-Casas, V. Life-cycle cost analysis of floating offshore wind farms. Renew. Energy 2014, 66, 41–48. Castro-Santos, L.; Martins, E.; Guedes Soares, C. Methodology to calculate the Levelized Cost Of Energy (LCOE) of a floating offshore renewable energy farm. Energies 2016, 9, 324. [CrossRef] Castro-Santos, L.; Diaz-Casas, V. Sensitivity analysis of floating offshore wind farms. Energy Convers. Manag. 2015, 101, 271–277. [CrossRef] Sclavounos, P.D.; Lee, S.; DiPietro, J. Floating offshore wind turbines: tension leg platform and taught leg buoy concepts supporting 3–5 mw wind turbines. In Proceedings of the European Wind Energy Conference EWEC 2010, Warsaw, Poland, 20–23 April 2010; pp. 1–7. Castro-Santos, L.; Garcia, G.P.; Estanqueiro, A.; Justino, P.A.P.S. The Levelized Cost of Energy (LCOE) of wave energy using GIS based analysis: The case study of Portugal. Int. J. Electr. Power Energy Syst. 2015, 65, 21–25. [CrossRef] Short, W.; Packey, D.; Holt, T. A Manual for the Economic Evaluation of Energy Efficiency and Renewable Energy Technologies; University Press of the Pacific: Honolulu, HI, USA, 1995. Bulder, B.H.; Van Hees, M.T.; Henderson, A.; Huijsmans, R.H.M.; Pierik, J.T.G.; Snijders, E.J.B.; Wijnants, G.H.; Wolf, M.J. Study to Feasibility of Boundary Conditions for Floating Offshore Wind Turbines; ECN, MARIN, Lagerway the Windmaster, TNO, TUD, Technical Report 2002-CMC; ECN, MARIN, Lagerway the Windmaster: Delft, The Netherlands, 2002. Castro-Santos, L.; Filgueira-Vizoso, A.; Carral-Couce, L.; Formoso, J.Á.F. Economic feasibility of floating offshore wind farms. Energy 2016, 112, 868–882. [CrossRef] © 2018 by the authors. Licensee MDPI, Basel, Switzerland. This article is an open access article distributed under the terms and conditions of the Creative Commons Attribution (CC BY) license (http://creativecommons.org/licenses/by/4.0/)..
(14)
Figure

Documento similar
EOI, Escuela de Negocios 18 Design of an Offshore Wind Farm in the North Sea Impacts will be expressed as adverse, beneficial or negligible and the global environmental
Starting from a typical offshore wind turbine load profile, the hot-spot temperature, the aging rate and total loss of life of a dry-type WTSU transformer have been
6 and 7 show the behavior of the on-shore and off-shore converters when the converter thyristors are triggered and the wind farm is delivering its rated power.. On-shore
Electrical layout and turbine placement are key design decisions in offshore wind farm projects.. Increased turbine spacing minimizes the energy losses caused by wake
