Two-dimensional and Three-dimensional
Assessment of the Upper Airway
Evaluación Bidimensional y Tridimensional de la Vía Aérea Superior
Isabella Vilaza1; Pamela Araya-Díaz1 & Hernán M. Palomino1
VILAZA, I.; ARAYA-DÍAZ, P. & PALOMINO, H. M. Two-dimensional and three-dimensional assessment of the upper airway. Int.
J. Morphol., 35(1):357-362, 2017.
SUMMARY: The aim of this study was to validate and correlate the two-dimensional (2D) with the three-dimensional (3D)
measures of the upper airway assessment. Lateral cephalograms and cone beam CT of 100 adult subjects were used to perform a 2D and 3D assessment of the upper airway. Spearman correlation coefficient was used to determine whether there was correlation between variables. Additionally, specificity, sensitivity, negative predictive value and positive predictive value was calculated for the 2D assessment of the upper airway. Correlation between all two and three dimensional variables was found. In the nasopharynx and oropharynx, a weak correlation (r <0.51) was found; in the oropharynx a moderate one (0.50 <r <0.76). The validity tests of the 2D assessment resulted in a 73 % sensitivity, 45 % specificity, 93 % negative predictive value and 14 % positive predictive value for the nasopharynx; 100 % sensitivity, 51 % specificity, 100 % negative predictive value and 6 % positive predictive value in the oropharynx and 100 % sensitivity, 71 % specificity, 100 % negative predictive value and 13 % positive predictive value in the hypopharynx. There is a weak correlation between the 2D and 3D assessment of the upper airway. However, the lateral cephalogram has a high sensitivity and high negative predictive value, therefore, an additional complementary examination would not be necessary if the 2D assessment of the upper airway throws a normal result.
KEY WORDS: Oropharyngeal width; Airway analysis; Cephalogram.
INTRODUCTION
In orthodontics, the upper airway morphology and function play a key role in the growth of the craniofacial complex. In general, lateral cephalograms are used to assess the upper airway dimension, but although this method is widely used, a two-dimensional evaluation of a three-dimen-sional anatomical structure might be questionable (Souza et al., 2013).
Some studies suggest that if the upper airway has a decreased anteroposterior length, which would be reflected in a lateral cephalogram, it could adapt by increasing its size transversely or longitudinally, thus preserving its total volume and functional capacity. Given this, a 3D study of the upper airway would be necessary to understand its adaptations to altered conditions (Linder-Aronson & Leighton, 1983; Aboudara et al., 2009).
Therefore, the purpose of this study is to correlate the 2D with the 3D assessment of the upper airway and thus
determine whether it is appropriate to use the lateral cephalogram for the evaluation of this anatomical structure, and to discriminate which patients will require an additional cone beam.
MATERIAL AND METHOD
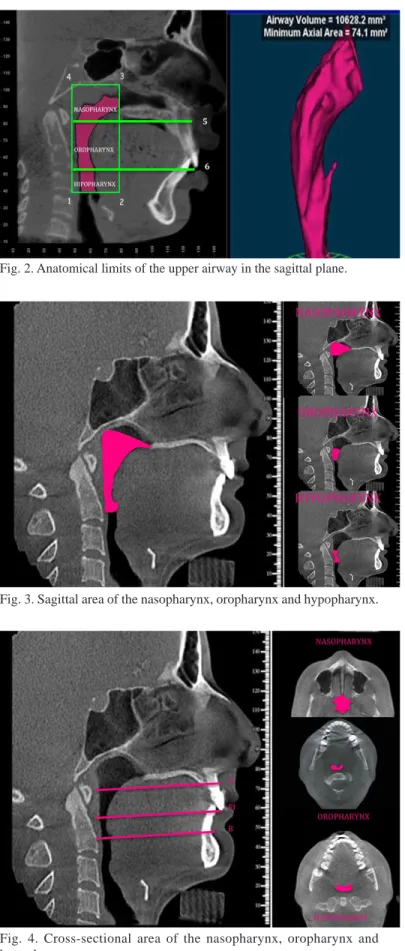
It was an analytical and cross-sectional study. Lateral cephalograms and cone beam (CBCT) of 100 Chilean adult subjects were used to perform a 2D and 3D assessment of the upper airway. Patients of both genders, over 18 years old, with an initial lateral cephalogram and CBCT, which had accepted that their clinical data could be used for research purposes if their identity was protected, were sought in the medical records. Anteroposterior linear measurements were obtained on the la-teral cephalogram (Fig. 1). Volume (Fig. 2), sagittal area (Fig. 3) and cross-sectional area (Fig. 4) on the CBCT.
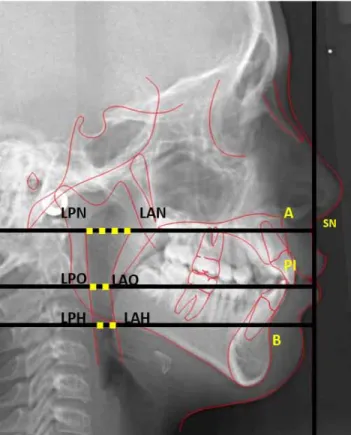
Anteroposterior Distance of the Upper Airway. For li-near anteroposterior measurements of the upper airway, pharynx was divided into three zones:
a) Nasopharynx: Distance between the LAN Point and the LPN Point (Fig. 1).
b) Oropharynx: Distance between the LAO Point and the LPO Point (Fig. 1).
c) Hypopharynx: Distance between the LAH Point and the LPH Point (Fig. 1).
The standard measurement for the nasopharynx is 17.5 ± 2.5 mm; 13 ± 2 mm for the oropharynx and 16.5 ± 3.5 for the hypopharynx. Accordingly, the upper airway can be classified into: normal, slightly reduced, moderately reduced or severely reduced, depending on how many stan-dard deviations below the stanstan-dard value is. One stanstan-dard deviation below is slightly reduced; two is moderately reduced and three or more is severely reduced (Cifuentes et al., 2004).
Volume of the Upper Airway: Its measurement was performed according to the methods described by Souza, Swennen, Ludlow and Brown (Swennen et al., 2006; Ludlow et al., 2009; Brown et al., 2009; Souza et al.).
The limits from the imagenological reconstruction in the mid-sagittal plane of the CBCT were the following:
a) Nasopharynx: Its upper limit is a horizontal line passing through the lowest point on the edge of the sphenoid sinus and its lower limit is a perpendicular to the true vertical line drawn from Point A (between line 4-3 and 5 from Fig. 2).
b) Oropharynx: its upper limit is the nasopharynx lower limit and its lower limit is a perpendicular to the true ver-tical line Drawn from Point PI (between line 5 and 6 from Fig. 2).
c) Hipopharynx: its upper limit is the oropharynx lower limit and its lower limit is a line starting at the most infe-rior and medial point of the third cervical vertebra until the downward projection of the Posterior Nasal Spine (between line 6 and 1-2 from Fig. 2).
The anterior limit of all the regions is a straight line drawn from the Posterior Nasal Spine. The posterior limit of them, is a vertical line from the upper limit of the nasopharynx to the most inferior and medial point of the third cervical vertebra (Line 3-2 and 4-1 from Fig. 2).
Area of the Upper Airway: Its measurement was performed according to the methods described by Souza, Swennen, Ludlow and Brown (Swennen et al.; Ludlow et al.; Brown et al.; Souza et al.).
Fig. 1. Cephalometric tracing for anteroposterior distance of the upper airway. The Nasopharynx is constructed by a perpendicular to a true vertical line passing through Subnasale (point where the nasal septum and the upper lip meet in the midsagittal plane) that is born from Point A (deepest concavity on the anterior profile of maxilla) and goes back passing through the pharynx, determining the LAN Point (anterior nasopharynx limit) and the LPN Point (posterior nasopharynx limit). The Oropharynx is constructed by a perpendi-cular to a true vertical line passing through Subnasale that is born from Point PI (upper incisor tip) and goes back passing through the pharynx, determining the LAO Point (anterior oropharynx limit) and the LPO Point (posterior oropharynx limit). The Hypopharynx is constructed by a perpendicular to a true vertical line passing through Subnasale that is born from Point B (deepest concavity on the mandibular symphysis) and goes back passing through the pharynx, determining the LAH Point (anterior hypopharynx limit) and the LPH Point (posterior hypopharynx limit).
The sagittal area of the nasopharynx, oropharynx and hypopharynx was estimated by a computer program, with the imagenological reconstruction in the mid-sagittal plane and using the same limits described above for volume (Fig. 3).
For the two-dimensional assessment of the upper airway, lateral cephalograms obtained from a private radiologic center of the district of Las Con-des, Santiago, Chile were used. The ray equipment utilized was the Orthopantomograph® OP300. The lateral cephalograms were taken in natural head position stabilized by the ear pieces (Bansal et al., 2012), with a source-to-object distance of 152 cm, exposed to 73 kVp and 14 mA for 0.64 seconds and the central ray shot to the left side of the face with a 1.25 magnification. The parameters for the digitization of the images were 300 dpi resolution, 8 bits and in the original size. The images were imported to the Dolphin 3D software (version 11.5, Dolphin Imaging & Management Solutions, Chatsworth, USA).
For the three-dimensional assessment of the upper airway, TMJ Cone beam CT scans obtained from a private radiologic center of the district of Las Condes, Santiago, Chile were used. The equipment utilized was the 3D ACCUITOMO® XYZ Slice View tomograph. The images were taken in natural head position stabilized by the ear pieces (Bansal et al.), with a 15 cm field of view, 15x15x15 cm volume size, 0.3 mm isotropic voxels, 120 kV and 36.9 mA 40 seconds exposure. Dolphin 3D software program (version 11.5, Dolphin Imaging & Management Solutions, Chatsworth, USA), for the export of the images was used (Alves et al., 2012). The images were exported in DICOM format, with a 1024x1024 square image matrix pixels, 76 Hz resolution and 12-bit grayscale.
The two and three dimensional analyses were performed by a single calibrated operator (I.V.). The measurements were tabulated and subjected to statistical analysis in Excel, SPSS 17.0 and Prism 5. The Spearman correlation coefficient was used to determine if there existed correlation between varia-bles. The strength of correlation was determined according to Martínez-Ortega et al. (2009).
Individuals were classified according to their anteroposterior distance of the upper airway into: nor-mal, slightly reduced, moderately reduced and severely reduced (Cifuentes et al.). With the average upper airway volume of the normal group a critical volume was determined to suggest a narrow upper airway. With this value it was possible to estimate the specificity, sensitivity, negative predictive value (NPV) and positive predictive value (PPV) of the 2D upper airway assessment with a lateral cephalogram. Fig. 2. Anatomical limits of the upper airway in the sagittal plane.
Fig. 3. Sagittal area of the nasopharynx, oropharynx and hypopharynx.
V/SA V/CSA SA/CSA
r p-value r p-value r p-value
Nasopharynx 0.79 0.00 0.76 0.00 0.61 0.00
Oropharynx 0.87 0.00 0.88 0.00 0.66 0.00
Hypopharynx 0.84 0.00 0.79 0.00 0.60 0.00
RESULTS
The sample consisted of 100 subjects, 57 women and 43 men, between 18 and 52 years old.
There is a statistically significant correlation (p <0.01) between the 2D and 3D upper airway assessment. However, there is variation in the strength of it, as shown in Table I and Table II.
The strength of correlation between the upper airway anteroposterior distance (AP) and volume (V) and between its anteroposterior distance and sagittal area (SA) was weak in the naso and hypopharynx (r <0.51), but moderate in the oropharynx ( 0.50 <r <0.76). On the other hand, the strength of correlation between the upper airway anteroposterior
distance and cross-sectional area (CSA) was weak at all three levels of it (r <0.51) (Table I).
There is a strong correlation between the upper airway volume with its sagittal and cross-section area throughout the entire upper airway (r> 0.75), but a moderate correlation between the upper airway sagittal area with its cross-sectional one (0.50 < r <0.76) (Table II).
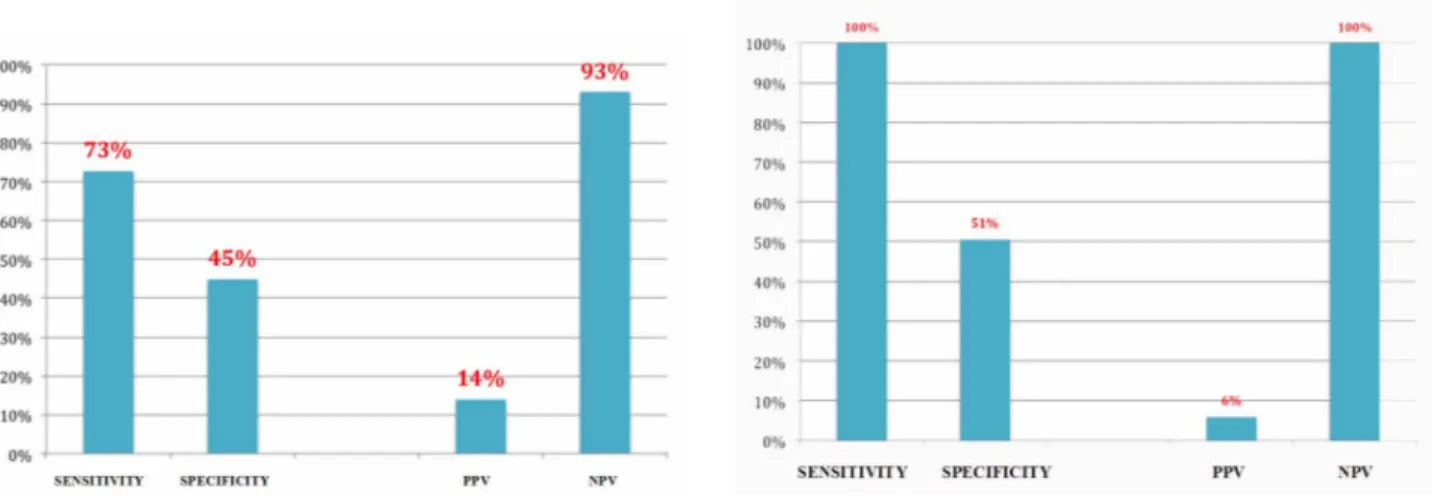
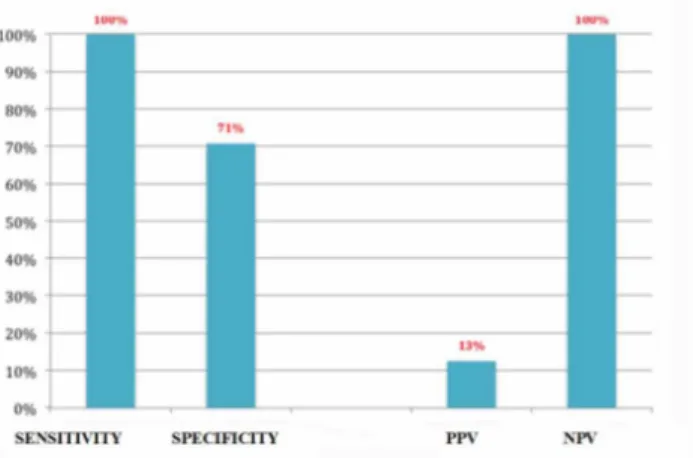
The specificity, sensitivity, negative predictive value (NPV) and positive predictive value (PPV) of the 2D upper airway assessment with a lateral cephalogram as shown in (Figs. 5, 6 and 7).
AP: anteroposterior distance. V: volume. SA: sagittal área CSA: cross-sectional area. Table I. Correlation between anteroposterior distance, volume and area.
Table II. Correlation between volume and area.
V: volume. SA: sagittal área CSA: cross-sectional area
Fig. 5 Sensitivity, specificity, positive predictive value and negative predictive value of the nasopharynx assessment with lateral cephalogram
Fig. 6. Sensitivity, specificity, positive predictive value and negative predictive value of the oropharynx assessment with lateral cephalogram.
AP/V AP/AS AP/CSA
r p-value r p-value r p-value
Nasopharynx 0.44 0.00 0.50 0.00 0.35 0.00
Oropharynx 0.51 0.00 0.55 0.00 0.46 0.00
DISCUSSION
Anteroposterior linear measurements for upper airway assessment, are often not accurate because this kind of evaluation has significant limitations of a 2D representation of a 3D structure. Therefore, the CBCT has been introduced as a relatively new and effective method that delivers 3D images and allows volume, sagittal and cross-sectional area analysis and thereby a better diagnosis (Grauer et al., 2009).
Currently, the preliminary diagnosis of the upper airway is still based on what is observed in the lateral cephalogram. For this reason, we sought to correlate the 2D with the 3D assessment of the upper airway and thus deter-mine whether it is appropriate to use the lateral cephalogram for the evaluation of this anatomical structure, and to discriminate which patients will require an additional CBCT.
The results showed a significant correlation between all two and three dimensional variables, but with different strengths of association. This is similar to what has been found in the international literature (Vig et al., 1980; Hoffstein et al., 1991; Aboudara et al.; Souza et al.).
In scientific studies different ways exist to delimit the upper airway so, there is no known normal volume range for this region, hindering the diagnosis of a reduced upper airway and makes comparisons with other studies difficult. For this reason, in this work and in an exploratory way, a critical volume of the upper airway was determined to calculate specificity, sensitivity, positive and negative predictive value of the upper airway assessment with a la-teral cephalogram, taking as reference the CBCT as "gold standard".
The results show a high sensitivity and high negative predictive value for the upper airway assessment with the lateral cephalogram. Therefore, if the lateral cephalogram shows a normal upper airway, then it is highly likely to be true, but if it shows an anteroposterior reduced upper airway, then a 3D assessment would be necessary because it might not be true.
Further studies are needed characterize the upper airway from a three-dimensional view, so diagnosis may be improve with this test.
CONCLUSIONS
There is a weak correlation between two- and three-dimensional assessment of the upper airway.
The lateral cephalogram has a high sensitivity and high negative predictive value, therefore, an additional complementary examination would not be necessary if the 2D assessment of the upper airway throws a normal result.
It is suggested that when the upper airway is decreased in the lateral cephalogram, it would be appropriate to perform CBCT to confirm.
VILAZA, I.; ARAYA-DÍAZ, P. & PALOMINO, H. M. Evaluación
bidimensional y tridimensional de la vía aérea superior. Int. J. Morphol.,
35(1):357-362, 2017.
RESUMEN: El objetivo de este estudio fue validar y
correlacionar las medidas bidimensionales (2D) con las medidas tridimensionales (3D) de la evaluación de las vías aéreas superiores. Se realizaron cefalogramas laterales y cone beam CT en 100 sujetos adultos para realizar una evaluación 2D y 3D de la vía aérea superior. Se utilizó el coeficiente de correlación de Spearman para determinar si había corre-lación entre las variables. Además, para la evaluación 2D de la vía aérea superior, se calculó la especificidad, sensibilidad, valor predictivo nega-tivo y valor predicnega-tivo posinega-tivo. Se encontró correlación en todas las va-riables entre dos y tres dimensiones. En la nasofaringe y la orofaringe, se encontró una correlación débil (r <0,51) mientras que en la orofaringe moderada (0,50 <r <0,76). Las pruebas de validez de la evaluación 2D resultaron en una sensibilidad del 73 %, una especificidad del 45 %, un valor predictivo negativo del 93 % y un valor predictivo positivo del 14 % para la nasofaringe; 100 % de sensibilidad, 51 % de especificidad, 100 % de valor predictivo negativo y 6 % de valor predictivo positivo en la orofaringe y 100 % de sensibilidad, 71 % de especificidad, 100 % de valor predictivo negativo y 13 % de valor predictivo positivo en la hipofaringe. Existe una débil correlación entre la evaluación 2D y 3D de la vía aérea superior. Sin embargo, el cefalograma lateral tiene una alta sensibilidad y alto valor predictivo negativo, por lo tanto, un examen complementario no sería necesario si la evaluación 2D de la vía aérea superior arroja un resultado normal.
PALABRAS CLAVE: Ancho orofaríngeo; Análisis de vías respiratorias; Cefalograma.
REFERENCES
Aboudara, C.; Nielsen, I.; Huang, J. C.; Maki, K.; Miller, A. J. & Hatcher, D. Comparison of airway space with conventional lateral headfilms and 3-dimensional reconstruction from cone-beam computed tomography. Am. J. Orthod. Dentofacial Orthop., 135(4):468-79, 2009. Alves, M. Jr.; Baratieri, C.; Mattos, C. T.; Brunetto, D.; Fontes, R. da C.; Santos, J. R. & Ruellas, A. C. Is the airway volume being correctly analyzed? Am. J. Orthod. Dentofacial Orthop., 141(5):657-61, 2012. Bansal, N.; Singla, J.; Gera, G.; Gupta, M. & Kaur, G. Reliability of
natu-ral head position in orthodontic diagnosis: A cephalometric study.
Contemp. Clin. Dent., 3(2):180-3, 2012.
Brown, A. A.; Scarfe, W. C.; Scheetz, J. P.; Silveira, A. M. & Farman, A. G. Linear accuracy of cone beam CT derived 3D images. Angle Orthod.,
79(1):150-7, 2009.
Cifuentes, J.; Lasserre, R. & Santelices, P. Síndrome de apnea obstructiva del sueño. Perspectivas de la cirugía ortognática. Rev. Chil. Ortod.,
21(1):130-47, 2004.
Grauer, D.; Cevidanes, L. S.; Styner, M. A.; Ackerman, J. L. & Proffit, W. R. Pharyngeal airway volume and shape from cone-beam computed tomography: relationship to facial morphology. Am. J. Orthod.
Dentofacial Orthop., 136(6):805-14, 2009.
Hoffstein, V.; Weiser, W. & Haney, R. Roentgenographic dimensions of the upper airway in snoring patients with and without obstructive sleep apnea. Chest, 100(1):81-5, 1991.
Linder-Aronson, S. & Leighton, B. C. A longitudinal study of the development of the posterior nasopharyngeal wall between 3 and 16 years of age. Eur. J. Orthod., 5(1):47-58, 1983.
Ludlow, J. B.; Gubler, M.; Cevidanes, L. & Mol, A. Precision of cephalometric landmark identification: cone-beam computed tomography vs conventional cephalometric views. Am. J. Orthod.
Dentofacial Orthop., 136(3):312-3, 2009.
Martínez Ortega, R. M.; Tuya Pendás, L. C.; Martínez Ortega, M.; Pérez Abreu, A. & Cánovas, A. M. El coeficiente de correlación de los rangos de Spearman caracterización. Rev. Habanera Cienc. Méd., 8(2), 2009. Souza, K. R.; Oltramari-Navarro, P. V.; Navarro, R. de L.; Conti, A. C. & Almeida, M. R. Reliability of a method to conduct upper airway analysis in cone-beam computed tomography. Braz. Oral Res., 27(1):48-54, 2013.
Swennen, G. R.; Schutyser, F.; Barth, E. L.; De Groeve, P. & De Mey, A. A new method of 3-D cephalometry Part I: the anatomic Cartesian 3-D reference system. J. Craniofac. Surg., 17(2):314-25, 2006.
Vig, P. S. & Hall, D. J. The inadequacy of cephalometric radiographs for airway assessment. Am. J. Orthod., 77(2):230-3, 1980.
Corresponding author: Pamela Araya Díaz
Departamento del niño y Adolescente Área de Ortodoncia
Facultad de Odontología Universidad Andres Bello Calle echaurren 237 Santiago
CHILE
E-mail: [email protected]