Cooperatives Versus Corporates in the Spanish
Agricultural Sector: Non-Parametric Estimation
of Technical Efficiency
Ma Isabel Alonso de Magdaleno1, Jes´us Garc´ıa-Garc´ıa2
1 Departamento de Administraci´on de Empresas, Universidad de Oviedo, Spain 2
Departamento de Contabilidad, Universidad de Oviedo, Spain
Abstract The technical efficiency of small firms is central to the debate about the role of small-scale industries in generating growth and employment in devel-oping economies. Some studies find small firms to be more efficient than large firms in some industrial sectors but not in others, while other studies find them to be less efficient overall. This paper focuses on agricultural enterprises in the northern part of Spain. It compares the distributions of efficiency and identifies most important correlates. It can have important implications for political de-cisions because this mixed evidence sends conflicting signals to policy makers. It also studies the variation across the two principal forms of business organi-zation focused on ownership, cooperative and corporate firms. Variation in the efficiency may take place between firms that are organised in different ways and result in changes from one form of business organisation to another. This anal-ysis allows us to know what firms are most efficient in the sector considered. Non-parametrical techniques are used in the analysis, concretely Data
ment Analysis (DEA). Highly efficient firms have distinct characteristics that distinguish them from inefficient firms: investments in technology, workforce, au-tomation, organizational practices. . . This analysis allows us to know what firms are most efficient in the sector considered if so why.
Keywords Efficiency, DEA, Agricultural Sector, Cooperatives, Corporates. JEL ClassificationM10, M19, Q13.
1. Introduction
Because of the relative decline of agriculture since the 1960s, Spain’s rural pop-ulation decreased and many farms disappeared. Spanish agriculture has remained relatively backward by western European standards: capital investment per hectare is about one-fifth the average for the Organisation for Economic Cooperation and Development (OECD), and the vast majority of farms are small. Since Spain joined the European Economic Community (EEC) in 1986, the Spanish agricul-tural sector has had to respect Europe-wide policies. As a result, many small-scale operations, especially in grape growing and dairying, had to cease. In recent decades, however, the amount of agriculturally productive land in Spain has in-creased through irrigation and the conversion of fallow lands.
neglect have created a serious land erosion problem, most notably in the dry plains of Castilla-La Mancha.
Compared with other West European countries, the proportion of land de-voted to agricultural purposes is low. About 5 million hectares are dede-voted to permanent crops: orchards, olive groves, and vineyards. Another 5 million lay fallow each year because of inadequate rainfall. Permanent meadows and pas-tureland occupied 13.9 million hectares. Forests and scrub woodland accounted for 11.9 million hectares, and the balance was wasteland or was taken up by populated and industrial areas.
The primary forms of property holding in Spain have been large estates (lat-ifundios) and tiny land plots (min(lat-ifundios). The Agrarian Census (INE, 2000) found that 50.9 percent of the country’s farmland was held in properties of 200 or more hectares, although farms of this size made up only 1.1 percent of the country’s 2.3 million farms. At the other end of the scale, the census showed that 61.8 percent of Spain’s farms had fewer than 5 hectares of land. These farms accounted for 5.2 percent of the country’s farmland. Furthermore, just under 25-percent of all farms consisted of less than 1 hectare of land, and they accounted for 0.5 percent of all farmland. Minifundios were particularly numerous in the north and the northwest. Latifundios were mainly concentrated in the south, in Castilla-La Mancha, Extremadura, Valencia and Andaluc´ıa.
Crop areas were farmed in two highly diverse manners. Areas relying on no-irrigated cultivation, which made up 85 percent of the entire crop area, depended solely on rainfall as a source of water. They included the humid regions of the north and the northwest, as well as vast arid zones that had not been irrigated. The much more productive regions devoted to irrigated cultivation accounted for about 4 million hectares, it already had doubled since 1950.
half of the irrigated area was planted in corn, fruit trees, and vegetables. Other agricultural products that benefited from irrigation included grapes, cotton, sugar beets, potatoes, legumes, olive trees, strawberries, tomatoes, and fodder grasses. Depending on the nature of the crop, it was possible to harvest two successive crops in the same year on about 10 percent of the country’s irrigated land.
Citrus fruits, vegetables, cereal grains, olive oil, and wine (Spain’s traditional agricultural products) continued to be important nowadays in the country’s agri-cultural production. Because of the changed diet of an increasingly affluent popu-lation, there was a notable increase in the consumption of livestock, poultry, and dairy products. Meat production for domestic consumption became the single most important agricultural activity, accounting for 30 percent of all farm-related production in 1983. Increased attention to livestock was the reason that Spain became a net importer of grains. Ideal growing conditions, combined with prox-imity to important north European markets, made citrus fruits Spain’s leading export. Fresh vegetables and fruits produced through intensive irrigation farming also became important export commodities, as did sunflower seed oil that was produced to compete with the more expensive olive oils in oversupply throughout the Mediterranean countries of the European Union.
Our primary purpose in the present study is to differentiate the most efficient companies from the least efficient ones on the basis of a set of economic variables by legal status, ownership and autonomous community.
2. Agriculture in the Northern Spain: A Brief Description
Green Spain is the name given to the strip of land between the Bay of Biscay and the Cantabrian and Basque mountains in northern Spain. Green Spain is considered to be formed by the regions of Galicia, Asturias, Cantabria and the Basque Country. It is called green because it has a wet and moderate oceanic climate, strongly influenced by the Atlantic Ocean winds that get trapped by the mountains. Green Spain contrasts with its dry central plateau.
Because semiarid plateaus and mountains subject to temperature extremes dominate the interior of Spain, the most productive agricultural areas tend to be the coastal regions. Thus the north and the northwest, where there is a relatively mild, humid climate were the principal corn producing and cattle-raising areas. Apples and pears were the main orchard crops in this area, and potatoes were another of its leading products.
Galicia, which consists of Spain’s four westernmost provinces directly north of Portugal, had a concentrated farm population living on intensely fragmented plots. Accordingly, per capita farm income was low, compared with that of the northern regions lying to the east, where there were fewer people and higher per capita income levels because of a more diversified economy that included industry, mining, and tourism.
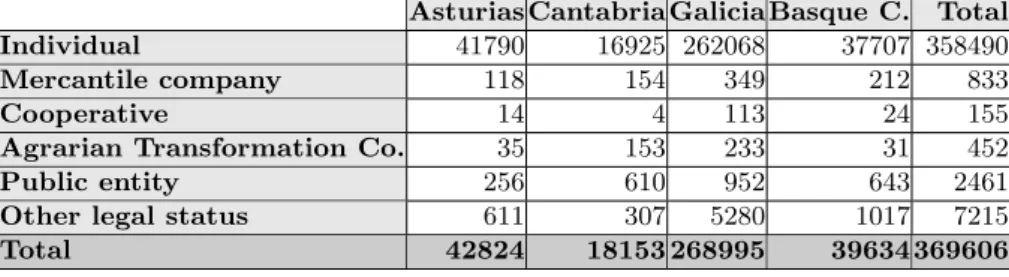
Agricultural operations in northern Spain are most frequently dedicated to a mixed combination of agriculture and livestock farming. According to INE (2000) only 1135 agriculture operations, a 2.7 percent of the total business are exclusively dedicated to agriculture farming.
• Individual: The owner is considered to be an individual when they are an individual or a group of individual persons (brothers, joint heirs, etc.) that work a joint heir ship or other grouping of lands or livestock together without having legally formed a company or association.
• Mercantile Company:is a group of people whose partnership agreement is documented in a public deed and is also registered in the Mercantile Reg-ister. These companies are classified as Public Limited Company, Limited, Collective and Company Responsibility.
• Public Entity:in this case, ownership corresponds to one of the different public administrations: Central, Autonomous or Local.
• Production Cooperative:is an association that works to obtain agricul-tural products as a joint undertaking, complying with the principles and regulations of the General Law of Cooperatives and their development norms.
• Agrarian Transformation Company (ATC): non-profit entity with social and economic purpose for the production, transformation and mar-keting of agricultural, livestock or forestry products, duly registered in the corresponding register.
Table 1 shows the distribution of agricultural operations. Individual is the most frequent legal status found in the business, consequence of the structural distribution of property holding. This study only takes a sample composed of mercantile companies (corporates) and cooperatives.
3. Brief Overview of Methodological Framework
Data Envelopment Analysis (DEA) is an efficiency evaluation model based on mathematical programming theory.
Table 1: Distribution of agricultural operation.Source: INE (2000). Asturias Cantabria Galicia Basque C. Total
Individual 41790 16925 262068 37707 358490
Mercantile company 118 154 349 212 833
Cooperative 14 4 113 24 155
Agrarian Transformation Co. 35 153 233 31 452
Public entity 256 610 952 643 2461
Other legal status 611 307 5280 1017 7215
Total 42824 18153 268995 39634 369606
efficiency of each member of a set of comparable organizational units based on a theoretical optimal performance for each organization.
DEA offers an alternative to classical statistics in extracting information from sample observations. In contrast to parametric approaches such as regression analysis, which fit the data through a single regression plane, DEA optimizes each individual observation with the objective of calculating a discrete piece-wise frontier determined by the set of Pareto efficient Decision Management Units. For this, the organizational units under analysis are designated as Decision Man-agement Units (DMUs) and these DMUs can be separate firms or institutions, or they can be separate sites or branches of a single firm or agency (Pinilla, 2001; Coelliet al., 1999; Ramanathan, 2003).
The concept of DEA is developed around the basic idea that the efficiency of a DMU is determined by its ability to transform inputs into desired outputs. This concept of efficiency was adopted from engineering which defines the efficiency of a machine/process as Output/Input.
The key advantage of DEA over other methods of performance evaluation is that it allows one to consider a number of outputs and inputs simultaneously, regardless of whether all the variables of interest are measured in common units (Sextonet al., 1986).
DEA generalizes this single output/input technical efficiency measure to mul-tiple outputs/inputs by constructing a relative efficiency measure based on a single ”virtual” output and a single ”virtual” input. The efficient frontier is then determined by selecting DMUs, which are most efficient in producing the virtual output from the virtual input. Because DMUs on the efficient frontier have an efficiency score equal to 1, inefficient DMUs are measured relative to the efficient DMUs. The efficiency ranking is relative to other DMUs. It is not possible to determine if DMUs judged to be efficient are optimizing the use of inputs to produce outputs.
Furthermore, DEA calculations are non-parametric. Non-parametric models differ from parametric models in that the model structure is not specified a priori but is instead determined from data. The term non-parametric is not meant to imply that such models completely lack parameters but that the number and nature of the parameters are flexible and not fixed in advance. Non-parametric models are therefore also called distribution free and do not require specification or knowledge of a priori weights for the inputs or outputs.
For many applications, these features make DEA a more flexible tool as com-pared to other conventional efficiency measures derived from stochastic produc-tion frontier or economic value added (EVA), which are based on producproduc-tion function estimation involving many inputs but only one output.
A formula for relative efficiency incorporating multiple inputs and outputs is introduced and the DEA model, which allows relative efficiency measures to be determined is developed. This is followed by a discussion of the information made available by solving the model and some issues of practical concern in applying the technique. The measurement of relative efficiency where there are multiple possibly incommensurate inputs and outputs was addressed by Farrell and de-veloped by Farrell and Fieldhouse, focusing on the construction of a hypothetical efficient unit, as a weighted average of efficient units, to act as a comparator for an inefficient unit.
A common measure for relative efficiency is, efficiency = weighted sum of outputs/weighted sum of inputs, which introducing the usual notation can be written as: -efficiency is usually constrained to the range [0,1]-,
Efficiency of unit j=u1y1j+u2y2j+. . .
v1x1j+v2x2j+. . .
,
where
u1 = the weight given to outputi,
y1j = amount of output 1 from unitj,
v1= weight given to input 1,
x1j amount of input 1 to unitj.
The initial assumption is that this measure of efficiency requires a common set of weights to be applied across all units. This immediately raises the problem of how such an agreed common set of weights can be obtained. There can be any difficulties in obtaining a common set of weights. First, it may simply be difficult to value the inputs or outputs. This measure of efficiency coupled with the assumption that a single common set of weights is required is thus unsatisfactory.
comparing this measure to similarly calculated measures for all other firms. Each firm’s performance measure traces out a best-practice frontier, and all DMUs lie either on or below the frontier (Charnes et al. 1994). A best-practice frontier maps out the maximum level of output (minimum level of input) that could be produced (used) for any given level of input (output). Figure 1 shows a graphical representation of an output-oriented DEA model with a single input for 10 firms. The best-practice frontier is traced through the points representing the maxi-mum level of output for a given input; any points below the frontier are deemed inefficient.
Figure 1: Output-oriented DEA model.
the same level of input and produce the same or higher level of output. The analysis is accomplished by requiring solutions that can increase some outputs (decrease some inputs) without worsening the other inputs or outputs (Charnes
et al.1994).
The one-input, one-output case can be expanded to cases involving multiple inputs and multiple outputs. Charneset al. (1978) proposed a method in which the multiple-input, multiple-output model was reduced to a ratio with a single “virtual” input and single “virtual” output by estimating a set of weights de-picting each DMU in the most favourable position relative to other DMUs. In equation form, the model is as follows:
Maxh0(u, v) = ∑
ruryro ∑
ivixio
s.t.: ∑
ruryrj ∑
ivixij
≤1, forj= 0,1, . . . , n
ur ∑
ivixio
≥ε, forr= 1, ..., s
vi ∑
ivixio
≥ε, fori= 1, ..., m
where:
yrj = quantity of outputr produced by firmj
xij = quantity of inputiproduced by firmj
ur = weight for outputr
vi = weight for inputi
ε= small positive quantity
problem as follows:
Maxw0= ∑
r
uryro
s.t.: ∑ i
vixio= 1 ∑
r
uryrj− ∑
i
vixij ≤0
ur≥ε
vi≥ε
F¨areet al.(1994) developed a variation of the preceding linear programming approach to model efficiency, productivity, and capacity1. The models they use measure the efficiency of individual producers by constructing a “best-practice frontier” through a piecewise linear envelopment of the data generated by all pro-ducers in the group. Estimates generated by those models are therefore “relative” measures based on the best producers within the group.
The following sections describe several linear programming models to estimate input and output technical efficiency and capacity output based on the approach used by F¨areet al.(1994).
Output technical efficiency is a measure of the potential output of a DMU given that inputs are held constant. F¨areet al.(1994) modeled the output tech-nical efficiency measure for any DMU using linear programming:
Maxθ θ, z
s.t.: θujm6 J ∑ j=1
zjujm, m= 1,2, . . . , M
J ∑ j=1
zjxjn6xjn, n= 1,2, . . . , N,
zj >0, j = 1,2, . . . , J
where:
1
θ= output technical efficiency measure
ujm = quantity of outputmproduced by DMU j
xjn = quantity of inputnproduced by DMUj
zj = intensity variable for DMUj
A value ofθ= 1.0 signifies that the DMU is efficient; a value of>1.0 indicates that the DMU is inefficient. For example, a score of 1.25 means that it should be possible to increase all outputs from a DMU by 25 percent with the same level of inputs.
An input-oriented technical efficiency model examines the vector of inputs used in the production of any output bundle, and measures whether a firm is using the minimum inputs necessary to produce a given bundle of outputs. Efficiency is measured by the maximum reduction in inputs which will still allow a given output bundle to be produced.
Figure 2: Input-oriented DEA model.
inef-ficient because they could produce the same level of output for less input. For example, the point (6,5) means 6 units of input are used to produce 5 units of output. Another firm is using 3 units of input to produce 5 units of output. The first firm is technically inefficient compared to the second firm because much more input is used to produce the same level of output.
F¨areet al.(1994) proposed the following input-oriented DEA model to mea-sure technical efficiency:
Minλ λ, z
s.t.: ujm6 J ∑
j=1
zjujm, m= 1,2, . . . , M, (Eq. 1)
J ∑ j=1
zjxjn6λxjn, n= 1,2, . . . , N, (Eq. 2)
zj>0, j= 1,2, . . . , J,
where:
λ= efficiency measure to be calculated for each DMUj ujm = quantity of outputmproduced by DMU j
xjn = quantity of inputnused by DMUj
zj = intensity variable for DMUj
Since the variableλis calculated for each DMU, the preceding formulation is estimated once for each DMU in the data set. Equations 1 and 2 define a set of constraints for each output and input. If there are two outputs, Equation 1 will define a set of constraints, one for each output. A value ofλ=1.0 means that a firm is considered efficient, while a valueλ <1.0 means a firm is inefficient. Thus, a value ofλ=0.70 means that a firm could reduce its inputs by 30%, and produce the same level of output.
found in Charneset al.(1994, chp. 22). Since the early work of Charnes, Cooper and Rhodes (CCR), there have been a number of extensions to the DEA model.
Some of the benefits of DEA are:
• no need to explicitly specify a mathematical form for the production func-tion
• proven to be useful in uncovering relationships that remain hidden for other methodologies
• capable of handling multiple inputs and outputs
• capable of being used with any input-output measurement
• the sources of inefficiency can be analysed and quantified for every evalu-ated unit
It should be emphasized that a linear program of this form must be solved for each of the DMU.
Data Envelopment Analysis (DEA) has been recognized as a valuable analyt-ical research instrument and a practanalyt-ical decision support tool2. DEA has been credited for not requiring a complete specification for the functional form of the production frontier nor the distribution of inefficient deviations from the fron-tier. Rather, DEA requires general production and distribution assumptions only. However, if those assumptions are too weak, inefficiency levels may be systemat-ically underestimated in small samples. In addition, erroneous assumptions may cause inconsistency with a bias over the frontier. Therefore, the ability to al-ter, test and select production assumptions is essential in conducting DEA-based research.
Numerous applications of this technique can be found in the literature. A comprehensive collection of theoretical and empirical work can be found in Em-rouznejad (2001).
2
4. Analytical Framework
Many studies have focused on the analysis of efficiency in the primary sector. Global and business efficiency in processing of milk products have been thor-oughly studied by Arzubi & Berbel (2001), Singhet al. (2000) and Ferrier and Porter (1991) in Argentina, India and USA, respectively. A similar research was done by Gonz´alez et al. (1996) and Pardo et al. (2001) in Spain. Efficiency of raw cotton cooperatives was studied by Caputo & Lynch (1993) in California. Japanese agricultural cooperative sector was studied by Sueyoshiet al. (1998). Athanassopoulos & Ballantine (1995) analyzed the efficiency of the agricultural processing industry in United Kingdom, industry also studied by Aldaz & Millan (2000) with a temporal evolution perspective in Spanish regions.
Many studies have been devoted to the agricultural industry in the Southern and Eastern parts of Spain. Temporal evolution was used by Damas & Romero (1997) for olive oil mill cooperatives in Ja´en, while Vidalet al.(2000) and Segura & Vidal (2001) studied efficiency on citrus fruit cooperatives in Valencia with a static analysis. Despite not being an application of the DEA analysis, works of Calatrava & Ca˜nero (2001a , 2001b) applied to the study of technical efficiency in the glasshouse growers of Almer´ıa by econometrical techniques. Aldaz & Mill´an (1996) work, focused on measurement and comparison of agricultural productiv-ity between Spanish autonomous communities, is remarkable. And also works by Chavas & Aliber (1993), Colomet al.(1996), Damas et al.(1997), Fern´andez & Herruzo (1996), Mart´ınezet al.(2002), Pardoet al.(2001), Prieto (1987), Prieto
et al.(1990), Sabat´e (2002) and Vidal et al.(2000), among others.
Our primary purpose in the present study was to differentiate the most ef-ficient companies from the least efficient ones on the basis of a set of economic variables by legal status3, ownership and autonomous community.
Sample selection starts from a database that is made up of the annual accounts of the agricultural companies located in Asturias, Cantabria, Galicia and Basque Country (based on Agrarian Census and the database SABI –Sistema de An´alisis de Balances Ib´ericos-). So the sample was limited to business required to deposit their financial statements in the Registro Mercantil (Business Register). This keeps out any individual operation and any other legal status not compelled to deposit financial statements. Analysed accounts correspond to the year 2004.
A set of filters is applied to the database to guarantee the quality of finan-cial information and also to guarantee that the selected sample really shows the economic activity of mercantile companies and cooperatives in the agricultural sector. Companies are eliminated if they did not carry out any activity, omit data about fixed assets or operating income or they do not provide any information about their employees. We also test the sectorial classification declared by every company against its business purposes in financial statements.
After the filtering process, sampling was limited to 118 companies whose legal status is mercantile company (corporates) or cooperative. Mercantile companies are divided on legal liability so we have in the sample public limited companies and limited liability companies (Sociedad An´onima and Sociedad de Responsabil-idad Limitada according to Spanish mercantile legislation, R.D. 1564/1989, Offi-cial Spanish Gazette BOE 310-1564; for cooperatives legislation, see Ley 27/1999, Official Spanish Gazette BOE 170-15681) that in the paper will be denoted by their Spanish acronyms, S.A. for public limited companies and S.L. for limited liability companies. Cooperatives are autonomous association of persons united voluntarily to meet their common economic, social, and cultural needs and
aspi-3
rations through a jointly owned and democratically controlled enterprise, as de-fined by International Cooperative Alliance. It may also be dede-fined as a business owned by the people who use its services. A mainstream cooperative comprises a legal entity owned and democratically controlled by its members, with no pas-sive shareholders, unless they hold non-voting shares. It thus combines the equal control characteristic of many partnerships with the legal personality conferred on corporations.
Many works have been devoted to the measure of efficiency in agricultural cooperatives; of these we mention Akridge & Hertel (1991), Cook (1995), Cook & Iliopoulus (2000), Guzm´anet al.(2006), Lerman & Parliament (1991), Montegut
et al. (2002), Porter & Scully (1987), Segura & Oltra (1995), Sexton & Iskow (1993). Howewer, this work goes beyond and focuses on the comparative between companies with different legal and organizational forms.
The output and input orientation (see section 3) have been applied to the study of the efficiency on the agricultural sector. Nevertheless, in this paper we have performed an input orientation model because we consider input model to be more relevant to the working scheme of cooperatives whose members work for a fixed production while minimizing cost.
DEA requires to define the inputs and outputs to be used in the analysis. Different criteria have been applied for the selection of variables in the design of DEA models (Mart´ınez & Mart´ınez Carrasco, 2002; Damas & Romero, 1997; Jaenicke & Lengnick, 1999; Chavas & Aliber, 1993; Ferrier & Porter, 1991). We have followed the seminal work of Smith (1990) which developed a financial anal-ysis by means of DEA for multidimensional ratio scaling.
To reach our goal, we conducted a Delphi4study. Through this study, we asked a panel of sectorial experts their opinion about the best measures of efficiency
(inputs and outputs) contained in the account books of the companies. Then, we proceeded to observe whether there was correlation between the answers using the Kendall5 correlation coefficient. Kendall coefficient validated the variable selection with a value of 0.85.
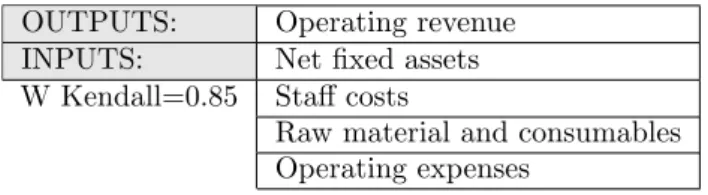
Selected variables were: operating revenue, net fixed assets, staff cost, raw ma-terial and consumables cost and another operating expenses. They were classified as inputs-outputs according to Table 2.
Table 2: Variables used in the analysis.
OUTPUTS: Operating revenue
INPUTS: Net fixed assets
W Kendall=0.85 Staff costs
Raw material and consumables Operating expenses
5. Isotonicity Test
For the validation of the developed DEA model, we examined the assumptions of the “isotonicity” relationships between the input and output factors, i.e., an increase in any input should not result in a decrease in any output (Charneset al., 1985; Bowlin, 1987). Following Golany and Roll (1989), regression analysis on the selected input and output factors is a useful procedure to examine the isotonicity relationships between the input and output factors. If the correlation of the selected input and output factors is positive, these factors are isotonically related and can be included in the model. The factor that has a weak isotonic-ity relation to the other factors should be re-examined. Alternatively, a strong
5
correlation may indicate that the information contained in one factor is already represented redundantly by other factors. In addition, according to Golany and Roll (1989), the number of DMUs should be at least twice of the total number of input and output factors considered when applying the DEA model. In this study the number of DMUs is 118. Therefore, in this study, the proposed DEA model has high construct validity.
According to the results of intercorrelation analysis, we easily see that the correlation coefficients between outputs and inputs are all positive and the iso-tonicity test is passed. The results are shown in Table 3.
Table 3: Correlation results.
Input 1 Input 2 Input 3 Input 4 Output Input 1 Pearson 1 0,015 0,225 ** 0,375 ** 0,161 *
Sig. (1-tailed) , 0,436 0,007 0,000 0,040
Input 2 Pearson 0,015 1 0,235 ** 0,508 ** 0,796 **
Sig. (1-tailed) 0,436 , 0,005 0,000 0,000
Input 3 Pearson 0,225 ** 0,235 ** 1 0,712 ** 0,729 **
Sig. (1-tailed) 0,007 0,005 , 0,000 0,000
Input 4 Pearson 0,375 ** 0,508 ** 0,712 ** 1 0,834 **
Sig. (1-tailed) 0,000 0,000 0,000 , 0,000
Output Pearson 0,161 * 0,796 ** 0,729 ** 0,834 ** 1
Sig. (1-tailed) 0,040 0,000 0,000 0,000 ,
** Correlation is significant at the 0.01 level (1-tailed). * Correlation is significant at the 0.05 level (1-tailed).
Input 1:Net fixed assets.Input 2:Raw material and consumables.Input 3:Staff costs. Input 4:Operating expenses.Output:Operating revenue.
6. Empirical Results and Discussion
Table 4 illustrates the results obtained in the input efficiency analysis. DMUs, legal entity and efficiency levels are shown.
Table 4: Efficiency Results.
DMU1 S.A. 1,000 DMU41 S.L. 1,000 DMU81 S.L. 0,792
DMU2 S.L. 1,000 DMU42 S.L. 1,000 DMU82 C. 0,598
DMU3 S.L. 1,000 DMU43 C. 0,608 DMU83 S.L. 0,660
DMU4 S.A. 0,920 DMU44 S.L. 0,657 DMU84 C. 0,677
DMU5 S.A. 0,429 DMU45 S.L. 0,790 DMU85 S.L. 0,607 DMU6 S.L. 1,000 DMU46 S.A. 0,124 DMU86 S.L. 0,783 DMU7 S.L. 1,000 DMU47 S.L. 0,801 DMU87 S.L. 0,106 DMU8 S.A. 0,869 DMU48 S.L. 0,297 DMU88 S.L. 1,000 DMU9 S.L. 0,779 DMU49 S.L. 1,000 DMU89 S.A. 1,000 DMU10 S.L. 1,000 DMU50 S.L. 0,671 DMU90 S.L. 1,000 DMU11 S.A. 0,177 DMU51 S.L. 0,727 DMU91 S.A. 1,000 DMU12 C. 0,877 DMU52 S.L. 0,791 DMU92 C. 0,481 DMU13 S.L. 0,016 DMU53 S.L. 0,782 DMU93 S.L. 0,857 DMU14 S.L. 0,963 DMU54 S.L. 0,863 DMU94 S.L. 1,000 DMU15 S.A. 0,628 DMU55 S.L. 1,000 DMU95 S.L. 0,892 DMU16 S.L. 1,000 DMU56 S.L. 0,731 DMU96 S.A. 1,000 DMU17 S.L. 0,891 DMU57 S.L. 1,000 DMU97 S.L. 0,709 DMU18 S.A. 0,335 DMU58 S.L. 0,762 DMU98 S.L. 1,000 DMU19 S.L. 0,604 DMU59 S.L. 1,000 DMU99 S.L. 0,982 DMU20 S.A. 1,000 DMU60 S.L. 0,943 DMU100 S.L. 1,000 DMU21 S.L. 1,000 DMU61 S.L. 0,360 DMU101 S.A. 1,000 DMU22 S.L. 0,852 DMU62 S.A. 0,124 DMU102 S.L. 0,524 DMU23 S.L. 0,752 DMU63 S.L. 0,419 DMU103 C. 0,687 DMU24 C. 0,792 DMU64 S.L. 0,937 DMU104 S.A. 1,000 DMU25 S.L. 1,000 DMU65 S.L. 1,000 DMU105 S.L. 0,741 DMU26 S.L. 1,000 DMU66 S.L 1,000 DMU106 S.A. 1,000 DMU27 S.A. 0,713 DMU67 C. 0,733 DMU107 C. 1,000 DMU28 S.L. 0,651 DMU68 S.L. 1,000 DMU108 C. 1,000 DMU29 S.L. 0,790 DMU69 S.L. 1,000 DMU109 S.L. 1,000 DMU30 S.A. 0,445 DMU70 S.A. 0,258 DMU110 S.L. 0,406 DMU31 C. 0,624 DMU71 C. 0,345 DMU111 S.L. 1,000 DMU32 S.L. 0,782 DMU72 S.L. 1,000 DMU112 S.L. 1,000 DMU33 S.L. 0,736 DMU73 S.L. 1,000 DMU113 S.A. 1,000 DMU34 S.L. 1,000 DMU74 S.L. 0,985 DMU114 C. 1,000 DMU35 S.L. 0,750 DMU75 S.L. 0,770 DMU115 C. 0,961 DMU36 S.L. 1,000 DMU76 S.L. 0,681 DMU116 S.L. 0,890 DMU37 S.L. 0,809 DMU77 C. 0,718 DMU117 S.L. 1,000 DMU38 S.L. 0,815 DMU78 S.L. 0,679 DMU118 S.L. 0,937 DMU39 S.L. 0,826 DMU79 S.L 0,987
level, between 60 and 80 percent of efficiency. 14 percent of the companies are in low levels, below 50% of efficiency.
According to legal entity there is about 45 percent of S.A. and another 45 percent of S.L. in the highest levels of efficiency, while only about a 25 percent of cooperatives.
Cooperatives are mostly grouped on the intermediate level of efficiency, about a 56 percent, with a 44 percent of S.L. and a 15 percent of S.A. In the lowest level of efficiency we can find a majority of mercantile societies, 35 percent of S.A. and 10 percent of S.L., while only 18 percent of cooperatives. Graphs 1, 2 and 3 show these results for each level of efficiency.
Graph 1: High levels efficiency.
Most efficient S.A. and S.L. can be found at Basque Country and while S.L. also at Cantabria. We must remember almost cooperatives in Green Spain are located at Galicia, so there we can find the most and the less efficient.
Graph 2: Medium levels efficiency.
Graph 3: Low levels efficiency.
assets, permanent workers. . . ) results in a low efficiency. Otherwise, cooperatives are enterprises that put people at the centre of their business and not capital, decisions taken by cooperatives balance the need for profitability with the needs of their members and the wider interests of the community. Cooperatives create and maintain employment-providing income so maybe there is no interest in holding a low level of activity.
corporates and cooperatives we are testing the hypothesis that the two samples came from the same population. Testing for difference of two means we found that there is no significant difference between them (see Table 5). So we conclude that legal entity is not related in any way to efficiency degree.
Table 5: Test of two means of unpaired samples with unequal variance. Corporates Cooperatives
Mean 0.806 0.734
Variance 0.060 0.037
Observations 102 16
Hypothesized Mean Difference 0
Observed Mean Difference 0.072
df 23.369
t Stat 1.331
P (T<=t) one-tail 0.098
T Critical one-tail 1.713
P (T<=t) two-tail 0.196
T Critical two-tail 2,068
Results are consistent with another works in this field and have consequences at the managerial and legislative levels. The result should not be interpreted that the definition of property rights does not affect the efficiency in which resources are allocated in organizations. Cooperatives could have problems that create inefficiencies within the cooperative form, but its legal entity as cooperative also could put them on edge over the rest of legal entities. If benefits are properly utilized, cooperative form can obtain the same or even higher levels of efficiency (Salazar & Galve, 2008).
According to these arguments, derived from property rights theory, cooper-atives should always be less efficient than capitalist firms. But reality leads us to question this statement and consider the advantages of cooperatives against capitalist forms. The arguments that support these advantages are based on the theory of transaction costs, greater flexibility in the cooperative firm and in their tax protection (Salazar & Galve, 2008). Higher tax protection is pointed by Porter & Scully (1987) as the main cause of advantages through reduction of tax rates and favouritism in subsidies.
To conclude, certain characteristics that may increase the inefficiency of the cooperative firm can place it in a better position to efficiency in a contradic-tory way. This may explain the little influence of the form of government over efficiency and the inconsistency of the results of the analysis. It is also very im-portant to remark that the results of our work are biased by its regional and sectoral characteristics. This bias prevents consideration of the companies ana-lyzed as representative of the rest of Spanish companies, we must be cautious about extrapolating results.
References
1. Akridge, J. and T. Hertel, (1991): Cooperative and Investor-Oriented Firm Effi-ciency: A Multiproduct Analysis.Journal of Agricultural Cooperation, 1-14. 2. Aldaz, N. y J. Mill´an, (1996): Comparaci´on de medidas de productividad total de
los factores en las agriculturas de las Comunidades Aut´onomas espa˜nolas.Revista Espa˜nola de Econom´ıa Agraria, 177, 73-114.
3. Aldaz, N. y L. Mill´an, (2000): An´alisis no param´etrico de productividad regional en la industria alimentaria.III Encuentro de Econom´ıa Aplicada. Valencia, 1-3 junio. 4. Alvarez Pinilla, A., (2001):La medici´on de la eficiencia y la productividad. Ediciones
Pir´amide, 2001.
6. Athanassopoulos, A. and J. Ballantine, (1995): Ratio frontier an´alisis for assessing corporate performance.Journal of The Operational Research Society,46, 427-440. 7. Babb, E. and R. Boynton, (1981): Comparative Performance of Cooperative and Private Cheese Plants in Wisconsin. North Central Journal of Agricultural Eco-nomics, 3, 157-164.
8. Banker, R., R. Charnes and W. Cooper, (1984): Some Models for Estimating Tech-nical and Scale Inefficiencies in Data Envelopment Analysis.Management Science,
30, 1078-1092.
9. Bowlin, W., (1989): A comment on evaluating the efficiency of US air force organi-zations.Journal of Operational Research Society, 40, 1059-1061.
10. Calatrava, J. y R. Ca˜nero, (2001a): Funciones de producci´on frontera en inver-naderos almerienses: identificaci´on de factores relacionados con la eficiencia t´ecnica.
Revista de Estudios Agrosociales y Pesqueros,193, 9-26.
11. Calatrava, J. y R. Ca˜nero, (2001b): Eficiencia productiva y adopci´on de tecnolog´ıas en los invernaderos almerienses: un an´alisis mediante funciones de producci´on es-toc´asticas.IV Congreso de la Asociaci´on Espa˜nolade Econom´ıa Agraria.Pamplona, 19-21 septiembre.
12. Caputo, M. and L. Lynch, (1993): A nonparametric efficiency analysis of California cotton ginning cooperatives. Journal of Agricultural and Resource Economics, 18, 251-265.
13. Chaddad, F. and M. Cook, (2004): Understanding New Cooperative Models: An Ownership Control Rights Typology.Review of Agricultural Economics, 26, 1-13. 14. Charnes, A., W. Cooper and E. Rhodes, (1978): Measuring the efficiency of
decision-making units.European Journal of Operational Research,2, 429-444.
15. Charnes, A., T. Clark, W. Cooper and B. Golany, (1985): A development study of data envelopment analysis in measuring the efficiency of maintenance units in the US Air Force.Annals of Operations Research, 2, 95-112.
16. Charnes, A., W. Cooper, A. Lewin and L. Seiford, (1994):Data envelopment anal-ysis, theory, methodology and applications. Norwell, MA: Kluwer Academic Pub-lishers.
1-16.
18. Coelli, T., D. Rao and G. Batesse, (1999):An introduction to efficiency and pro-ductivity analysis. Kluwer.
19. Cook, M., (1995): The Future of U.S. Agricultural Cooperatives: A Neo-Institutional Approach. American Journal of Agricultural Economics, 77, 1153-1159.
20. Cook, M. and Iliopoulos, (2000): Ill-Defined Property Rights in Collective Action: the Case of US Agricultural Cooperatives, en C. Menard [ed.]: Institutions, Con-tracts, and Organizations: Perspectives from New Institutional Economics, 335-348. London: Edward Elgar.
21. Colom, A., P. Sabat´e y E. S´aez, (1996): An´alisis econ´omico-financiero de com-petitividad y eficiencia productiva del sector cerealista de la provincia de Huesca.
Investigaci´on Agraria Econom´ıa,11, 117-138.
22. Damas, E. y C. Romero, (1997): An´alisis no param´etrico de la eficiencia relativa de las Almazaras Cooperativas en la Provincia de Ja´en Durante el Per´ıodo 1975-1993.
Revista Espa˜nola de Econom´ıa Agraria, 180, 263-279.
23. Emrouznejad, A., (2001):An Extensive Bibliography of Data Envelopment Analysis (DEA), Volume I: Working Papers, Business School, University of Warwick. 24. F¨are, R., S. Grosskopf and E. Kokkenlenbergl, (1989): Measuring plant capacity
uti-lization and technical change: a nonparametric approach.International Economic Review, 30, 655-666.
25. F¨are, R., S. Grosskopf and C. Lovell, (1994):Production frontiers. Cambridge Uni-versity Press. Cambridge.
26. Farrell, J. M., (1957): The Measurement of Productive Efficiency. Journal of the Royal Statistical Society, 120, 253-281.
27. Fern´andez, M. y A. Herruzo, (1996): La productividad total de los factores en la agricultura y ganader´ıa espa˜nolas: un an´alisis regional.Investigaci´on Agraria: Econom´ıa, 11, 71-97.
28. Ferrier, G. and P. Porter, (1991): The productive efficiency of United-States milk processing cooperatives.Journal of Agricultural Economics,42, 161-173.
30. Intrilligator, M., (1971): Mathematical optimization and economic theory. Engle-wood Cliffs, NJ: Prentice-Hall.
31. Gonz´alez, E., A. ´Alvarez y C. Arias, (1996): An´alisis no param´etrico de eficiencia en explotaciones lecheras.Investigaci´on Agraria: Econom´ıa,11, 173-190.
32. Guzm´an, I., N. Arcas y D. Garc´ıa, (2006): La Eficiencia T´ecnica como Medida de Rendimiento de las Cooperativas Agrarias. CIRIEC-Espa˜na.Revista de Econom´ıa P´ublica, Social y Cooperativa, 289-311. Centro Internacional de Investigaci´on In-form. sobre la Econom´ıa P´ublica Social y Cooperativa. Valencia.
33. Instituto Nacional de Estad´ıstica (2000). http://www.ine.es.
34. Jaenicke, E. and L. Lengnick, (1999): A soli-quality index and its relationship to efficiency and productivity growth measures: two decompositions.American Agri-cultural Economics Association, 81, 881-893.
35. Lerman, Z. and C. Parliament, (1991): Size and Industry Effects in the Performance of Agricultural Cooperatives.European Review of Agricultural Economics, (1), 15-29.
36. Ley 27/1999, de 16 de julio, de Cooperativas.
37. Lovell, C. and P. Schmidt, (1988): A Comparison of Alternative Approaches to the Measurement of Productive Efficiency, in Dogramaci and F¨are (eds.)Applications of Modern Production Theory: Efficiency and Productivity, Kluwer: Boston. 38. Mart´ınez, J. y F. Mart´ınez, F., (2002): Las empresas de comercializaci´on hort´ıcola
de Almer´ıa: An´alisis no param´etrico de eficiencia t´ecnica.Estudios Agrosociales y Pesqueros, 197, 105-128.
39. Montegut Y.; P. Sabat´e y M. Clop, (2002): An´alisis de la eficiencia del asocia-cionismo cooperativo en la D.O. Garriges Lleida.Investigaci´on Agraria: Producci´on Vegetal, 17, 441-456.
40. Pardo, L., D. Ruiz, J. Rodr´ıguez, J. Martos y P. Lara, (2001): Aplicaci´on de la metodolog´ıa DEA en la medida de la eficiencia de la producci´on de leche en C´ordoba.
IV Congreso de la Asociaci´on Espa˜nola de Econom´ıa Agraria. Pamplona, 19-21 septiembre.
42. Prieto, A., (1987): Disponibilidad de recursos y eficiencia productiva. Revista de Estudios Agro-Sociales, 142, 47-82.
43. Prieto, A., J. F. Revuelta y F. Rodriguez, (1990): Eficiencia productiva agraria en las comarcas de la Comunidad Aut´onoma de Castilla y Le´on.Revista de Estudios Agro-Sociales, 151, 119-138.
44. Ramanathan, R., (2003): An Introduction to Data Envelopment Analysis: A tool for Performance Measurement,sage publishing.
45. Real Decreto Legislativo 1564/1989, de 22 de diciembre, por el que se aprueba el texto refundido de la Ley de Sociedades An´onimas.
46. Sabat´e, P., (2002): An´alisis comparativo de la eficiencia de las cooperativas fruteras de la provincia de Lleida. CIRIEC-Espa˜na,Revista de Econom´ıa P´ublica, Social y Cooperativa, 41, 163-182.
47. Salazar T. and C. Galve, (2008): Cooperativa vs Capitalista. ¿Afecta la forma de gobierno a la eficiencia productiva?.Revista Europea de Direcci´on y Econom´ıa de la Empresa, 17, 133-144.
48. Segura, B. y M. Oltra, (1995): Eficiencia en la gesti´on de las cooperativas agrarias de comercializaci´on.Investigaci´on Agraria. Econom´ıa,10, 217-232.
49. Segura, B. y F. Vidal, (2001): El valor de la ineficiencia t´ecnica en las cooperativas agrarias de comercializaci´on hortofrut´ıcola.IV Congreso de la Asociaci´on Espa˜nola de Econom´ıa Agraria.Pamplona, 19-21 septiembre.
50. Seiford, L. and R. Thrall, (1990): Recent Developments in DEA: The Mathematical Programming Approach to Frontier Analysis.Journal of Econometrics,46, 7-38. 51. Sexton, R. and J. Iskow, (1993): What Do We Know About the Economic Efficiency
of Cooperatives: An Evaluative Survey.Journal of Agricultural Cooperation, 8, 15-27.
52. Sexton, T., R. Silkman and A. Hoogan, (1986): Data Envelopment Analysis: cri-tique and extensions. InMeasuring Efficiency: An Assessment of Data Envelopment Analysis.(R. H. Silkman, Ed.), 73-104.
54. Smith, P., (1990): Data envelopment analysis applied to financial statements.
Omega, International Journal of Management Science, 18, 131-138.
55. Sueyoshi, T., T. Hasebe, F. Ito, F., J. Sakai and W. Ozawa, (1998): DEA-bilateral performance comparison: an application to Japan agricultural cooperatives (Nokyo).Omega, International Journal of Management Science, 26, 233-248. 56. Vidal, F., B. Segura y F. del Campo, (2000): Eficiencia de las cooperativas de