Analysis of risk disclosure in Spanish firms
38
0
0
Texto completo
(2) I N D E X 1. Introduction………………………………………………………...P.1 2. Regulations of risk disclosure…………………………………....P.4 2.1. FRR No. 48……………………………………………....P.4 2.2. IFRS No. 7……………………………………………….P.6 2.3. GAS No. 5……………………………………………….P.9 2.4. Nacional Regulation (PGC) ……………………….....P.10 3. Risk disclosure literature………………………………………...P.11 4. Hypothesis……………………………………………………......P.16 4.1. Hypothesis in Spanish economic crisis……………...P.16 5. Methodology……………………………………………………....P.18 5.1. Measure of risk disclosure degree…………………...P.18 5.2. Type of risk……………………………………….….....P.20 5.3. T-Student Contrast………………………………….....P.21 6. Data and results………………………………………………......P.23 6.1. Data……………………………………………………...P.23 6.2. Result…………………………………………………….P.24 6.2.1. Indexes development……………………….P.24 6.2.2. Risk disclosure indexes………………........P.30 6.2.3. Conclusions………………………………….P.32 7. References…………………………………………………….......P.34.
(3) Abstract In the last decade the users have been denounced the lack of information about risk disclosure in the financial statements of the companies. One increase disclosure of risks translates directly in a high number of advantages that benefit both users as firms, like capital cost reductions. The objective of this study is to check if companies disclose more risk disclosure in financial crisis or in periods of economic prosperity. Furthermore, the behaviour of different trends about the types of risk is explained also in this study. For it has been analysed a sample of non-financial Spanish companies that listed in IBEX-35 in 2006 and 2011 using a new methodology proposed in the study of Cabedo and Tirado (2009). The results obtained show that these companies have disclosed more information about risk in times of crisis, i.e. more in 2011 than 2006. Key words: Disclosure Risk, Risk, Financial Risk, Non-Financial Risk, Management Reports, Financial Crisis, New Methodology.. Resumen En la última década se ha ido denunciado por los usuarios la falta de divulgación de riesgo por parte de las empresas en sus estados financieros. Una mayor divulgación de riesgos tiene como consecuencia una serie de ventajas que benefician tanto a usuarios como a las empresas, como reducciones de coste de capital. El objetivo de este estudio es comprobar si las empresas divulgan más información sobre riesgo en periodos de crisis financiera o en periodos de prosperidad económica. También se explican las diferentes tendencias sobre la divulgación de información sobre diferentes tipos de riesgo en los años estudiados. Para ello se ha analizado una muestra de empresas españolas no financieras del IBEX-35 en el año 2006 y 2011 utilizando una metodología nueva propuesta en el estudio de Cabedo y Tirado (2009). Los resultados obtenidos demuestran que estas empresas si han divulgado más información en periodos de crisis. Palabras claves: Divulgación de riesgos, Riesgos, Riesgos financieros, Riesgos no financieros, Informe de gestión, Crisis financiera, Nueva metodología..
(4) Comparative analysis of risk disclosure indexes before and after the financial crisis. Francesc Pedro Andrés. 1.. Introduction. In the current context, where we have profound changes and a high degree of uncertainty, has forced to companies to adapt their structures so that they remain well associated with the needs required by a new competitive atmosphere, as we shall see, by important institutional frameworks and expert authors on the subject. To cope this new situation, companies have been required to make changes in the way they organize and manage their business as well as the disclosure of information about these. These deficiencies in the utility of the information disclosed by the companies have been reported by several authors and accounting committees throughout the years. These, of those who will speak later, have released their concerns to reduce those gaps in the accounting information that could undermine the actual information given to users, and is why they have advised the need to incorporate new information elements in the financial statements in order to comply a demand that has been users who demand such information are directed, and which are those that have the final say in making their investment decisions. The concepts of risk and risk management have received considerable attention in recent years, and that the absence of disclosure of information about the various types of risk has increased in recent decades, mainly caused by the increased complexity of the business structures, and which has been the target of some criticism about the limitations of the current model publication of financial information. One example can be found in the document of Schrand and Elliott (1998) whose Committee of Experts for Accounting Reform addressed this weakness and recommended including in the financial statements of the companies a number of different indicators of risk to which they are currently exposed. These weaknesses had an empirical rigor when Solomon (2000)1 showed the results of some surveys were obtained by sampling to UK investors. He was obtained that a significantly high number of respondents agreed that was required directors provide as much information and detail of risk rather than making sporadic and general notes of the risk management policies that followed their companies. After the results and identifying deficiencies in disclosures of business risk, institutional investors recognized the importance of the ability of evaluation of the risk profile of the company, and again, this was only possible if quality information is provided. 1. Can be consulted other authors as Beck (1998), Cea (1992), Kwok (2003) or ICAC (2002). ~1~.
(5) Comparative analysis of risk disclosure indexes before and after the financial crisis. Francesc Pedro Andrés. In this line, Hunt (2003) investigated the emphasis that companies were putting respect to risk disclosure. With his articles he started a great debate regarding the communication of this type of information, as he believed that the amount of information provided by companies was very low, and firms were dedicated to give the minimal information within the international standards permitted under the normative. So he insisted that it had to change the rules, because companies would not provide more information voluntarily. Other example is explained by Lev and Zarowin (1999) where disseminated which have been the main causes of the deterioration of the usefulness of the information provided by the financial statements for potential users, leading to greater demand for relevant information and a high effort by regulators to improve the quality and timeliness of financial information. Currently, it seems that there is still a traditional accounting model something in business, characterized by providing information prepared based on historical data, which is past data. That's why it is very risky decision argued by past events and form projections of future events, heightened by an environment like this, which is characterized by high instability. As described in the preceding paragraphs, therefore emerges the need to incorporate most current and detailed information on the risk of the financial statements of these companies. So, the different organizations responsible for global accounting standards have been forced to amend the normative in an attempt to adapt to the economic times and the demands of users, realizing the need of a quickly introduction of any measures about risk disclosure and getting that the information to be more closer to reality, that provides historical data disclosed in the financial statements over the previous years and normally they do not show a true picture of the risks faced by different companies. The disclosure about risks has significant advantages both for users of accounting information as to the own companies that have this type of data. One of the most important advantages attributed to the disclosure risks is its influence in the cost of capital and their reduction. The perceptions of risk that have the investors on a company are going to be one of the main factors determining the variation that will bear the cost of capital. This is one reason why the presentation of risk information will allow investors to reduce their uncertainty about the risk’s exposure of the companies. As a result of past action, the spread also be reduced because is closely related to capital cost and risk expectations. The spread is the difference that is above the levels. ~2~.
(6) Comparative analysis of risk disclosure indexes before and after the financial crisis. Francesc Pedro Andrés. required by the sector, which are required by capital providers in situations where there is inadequate information to assess the risk of the company. So this is one of the main reasons why the presentation of risk information will allow investors to reduce their uncertainty about exposure with various companies. Once shown the demand for risk information by users and the advantages of it, the present work aims to analyse the degree of risk disclosure of non-financial companies listed on the Spanish stock market, IBEX-35. This analysis was done for two years, 2006, one year before the global financial crisis, and 2011, year immersed in the crisis. To study the level of disclosure we have relied on the development of indices of disclosure proposed by Cabedo and Tirado (2009). Furthermore, in this work are going to make an empirical application which should be regarded the degree of risk disclosure information of Spanish companies. Briefly, the results obtained in this research has been that companies which composed the sample have intensified about risk disclosure information in periods of financial crisis compared to periods of economic prosperity, specifically, it has been intensified in 2011 compared to 2006.. The rest of the work is structured in different sections. The second point explain the different normative about risk disclosure, national and international level. The third point is a bibliographic review of the literature that analyses the degree of risk disclosure. The fourth point tries to explain the hypothesis that will contrast the study, which mainly tries to show that companies disclose more risk information in their financial statements in periods of economic crisis that in period of economic prosperity. The fifth section presents the methodology used in the study to test the hypothesis. Finally, the sixth point explains both the data collected like the conclusions demonstrated in the research study.. ~3~.
(7) Comparative analysis of risk disclosure indexes before and after the financial crisis. Francesc Pedro Andrés. 2. Regulations of risk disclosure at national and international level As seen above, the various agencies responsible of the accounting rules sought to increase and encourage the appearance of real risk information, which companies are exposed throughout their business. First, will to try to explain what have been the main rules of disclosure on risks that have been issued internationally, and they are: •. FRR No. 48, published by Securities and Exchange Commission (SEC) in 1997. •. IFRS No.7, announced by International Accounting Standards Board (IASB) in August 2005. •. GAS No. 5, issued by German Accounting Standards Committee (GASC) in 2000. Briefly, the first two rules regulate the treatment of risk information and their disclosure in the financial statements. However, the third is more global, and obliges German companies to develop a complete state of risks, integrating financial risks and nonfinancial risks. Then will appear the target, types of risk and information about these previous rules governing: 2.1. FRR Nº48 This standard was published in 1997 by the Securities and Exchange Commission (SEC), which is independent US federal agency, and was created in 1934. This organization is responsible for enforcing federal laws of the stock values, options markets, and other electronic exchanges. The objective SEC wanted with the creation of the FRR No. 48 standard was to try to fill the gap left by the companies regarding disclosure risks, and that disadvantaged investors. For it obliged to companies that had some stock quote to presentation of on risk information, caused mainly by the use of derivatives and similar assets. This obligation focused solely on financial risks, ignoring other types of risks that seem less important in the historical and economic context. These financial risks were: •. Interest rate risk. •. Exchange rate risk. •. Commodity risk. ~4~.
(8) Comparative analysis of risk disclosure indexes before and after the financial crisis. Francesc Pedro Andrés •. Risk of changes in the price of stock values.. It is observed that there are some types of risks that are believed important now and that companies are increasingly at risk, as credit risk or liquidity, among others, and does not appear in the list above. This is due to the current time when the legislation was made, recall that it was in 1997, and considers these types currently as secondary important risk at the time. Furthermore, in order to place the information about risk in a specific place, the law created a new special section in the financial statements called Management's Discussion and Analysis (MD&A)2 and in which should fit the different information on disclosure of these risks. Regarding the type of information that companies should provide these types of risk, found it convenient to reflect both qualitative and quantitative information: •. With respect to qualitative information, the organization attempt to transmit information with more clearly to users, allowing these to have a better understanding of both the risk that has the company like the system to manage it, the two with equal importance. So, the rule want to integrate information about the main risks like accounting policies and management systems to combat it, or types of instrument used to mitigate them.. •. Below was presented the quantitative information that was intended to give users a higher level of forward-looking information, i.e. information aimed at the future. For this, the SEC filed three different formats with which companies could publish this information about the market risk: o. Sensitivity Analysis: The first option which could be allowed to show the hypothetical potential losses as a result of quantitative variations in the types of risk in an estimate, normally 1 year period.. o. Value Risk (VAR): The next alternative made possible estimate the maximum future loss caused by a hypothetical variation in the different types of risks.. o. Tabular: The third option included information which the investors could determine the future cash flows that were obtained with the financial instruments used by the company, and logically, it was sensitive to market risk.. 2. MD&A equal to Management Report or “Informe de Gestión” in the Spanish Financial Statement. ~5~.
(9) Comparative analysis of risk disclosure indexes before and after the financial crisis. Francesc Pedro Andrés. We can notice that while the first two alternatives can give us an explicit measure of market risk, the third allows users to obtain different variables that evaluate the risks posteriorly. In addition, the rule allows to investors the risk measurement considered three different dimensions: •. Fair value. •. Cash flow. •. Income. Next, it publishes a table that contained the different formats and variable that allows the FRR Nº48:. FRR No. 48. Risk. Format. Measures Income. Sensitivity Analysis. Cash Flow Fair Value. Qualitative. Market. information. Risk. Income Value Risk (VAR). Cash Flow Fair Value. Tabular. None, because the risk is not measured in an explicit form. Table 1: Concepts of regulation FRR No. 48. 2.2. IFRS Nº7. This regulation was issued in 2005 by the Accounting Standards Board (IASB), agency founded in April 2001, which collected the witness of the IASC, (International Accounting Standards Committee). It is the international body responsible for the development of the International Financial Reporting Standards, as well as promoting both the use like the different applications of these regulations.. The objective of the IASB with IFRS No. 7 was regulate the disclosure of risk information, allowing for improved understanding and cohesion of the financial positions in the companies in order to support consumers in risk assessments carried out about the financial instruments.. ~6~.
(10) Comparative analysis of risk disclosure indexes before and after the financial crisis. Francesc Pedro Andrés. Observe how a significant difference between this and the previous legislation exist. The first wanted to introduce the information, while the second seeks to regulate it. This is caused mainly by the different economic and historical contexts in which we can find each of the regulations.. With regard to the types of risks, in this standard identifies three types of financial risks about provide information of these: •. Credit risk. •. Liquidity risk. •. Market risk: In it the risk of exchange rate, interest rate and commodity risk is integrated.. We must emphasize a similarity and a difference with the regulation FRR No. 48. On the one hand, the rules of the IASB also tries to convey a greater emphasis on the regulation of the types of financial risks, although in this group is included the credit risk and liquidity risk, elevating these to a higher level importance in firms, thing that the first normative does not. However, as makes the first rule, the IFRS Nº7 again let nonfinancial risks in the background in terms of importance, and this, as we shall see, will be reflected in the disclosure of risk presented by different companies. On the other hand, it is true that this regulation leaves the possibility to report other types of different risks to those above, but without implementing any specific treatment on the information given on these in terms of measure, formats, where publish…. As to the specific place where they should be placed reports of financial statements of companies, the IFRS No.7 is more flexible than the previous regulation because it simply indicates to be included in the financial statements in general. It is true that according to an article of the regulation, allows to present the same information in other financial statements too, such as the management report, although setting up the condition of existing cross-references in the financial statements. . As regards the type of information to be submitted, this legislation again stressed the need to publish qualitatively and quantitatively information about risks: •. On one side is qualitative information. This regulation tries to make a leap of quality in it, in order that the risk disclosure made by enterprises be clear and useful, and can be derived from them future information to help in decisiondecisions to investors. For this, the IASB has forced companies to introduce the. ~7~.
(11) Comparative analysis of risk disclosure indexes before and after the financial crisis. Francesc Pedro Andrés. objectives, policies and management used, as well as methods used in measuring. •. On the other hand appears the quantitative information. The IASB stresses the disclosure form for each type of risk presented, as well as data that exhibit the actual exposure the company has in the published date of the financial statements. In addition, the agency warns of the need to incorporate additional information on risk in the event that the above data do not have the required level agreed by the IASB. Thus, the regulation differs how to present the information as the types of risks named in the list above: o. Credit risk: Defined as the possibility of default of one of the two parties of the contract. The law says the firms must include the following information on financial instruments that suffer this type of risk: Amount that better represents the maximum exposure value. Description of collateral available to the company. Information about the credit quality of the counterparty. In addition, the legislation requires companies to disclose additional information about mature assets or it has suffered a loss of value.. o. Liquidity risk: Defined as the exposure of firms to difficulties of cancelling financial debt obligations, the regulation requires: Report about expirations outstanding liabilities Report on the management and policies used in these remaining maturities. o. Market risk: Is specified as the possibility of variations in cash flow caused by fluctuations in market prices. As named above, the rule in this risk includes the foreign exchange, the interest rates and commodity risk. Thus, the IASB in general, requires inputting sensitivity data for these types of risks, in break down and in the filing date of the financial statements.. This regulation has been upgraded each period of time so that it could be tailored to different economic times and business needs, and to avoid an outdated legislation which might cause problems for both companies like to users. Thus, the latest update of this standard has been in 2014.. ~8~.
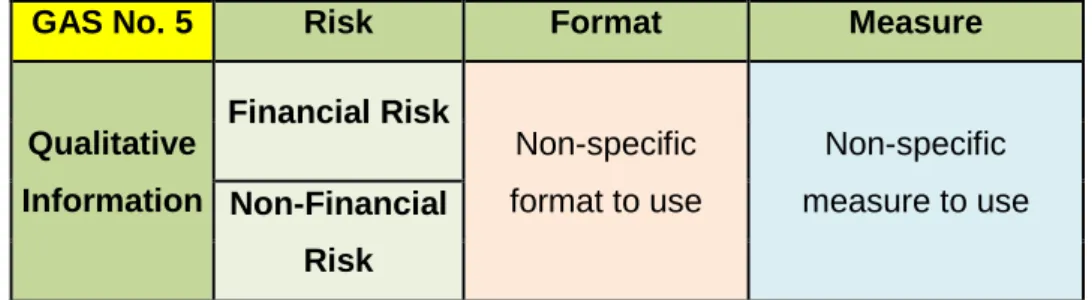
(12) Comparative analysis of risk disclosure indexes before and after the financial crisis. Francesc Pedro Andrés. Finally, the main features that bring the standard are embodied in the next table:. IFRS No. 7. Risk. Format. Market Risk. Sensitivity Analysis. Measure Loss Results and Value of Equity. Qualitative Information. Income Liquidity Risk. Value Risk (VAR). Cash Flow Fair Value. Credit Risk. Tabular. None, because the risk is not measured in an explicit form. Table 2: Concepts of regulation IFRS No. 7. 2.3. GAS Nº5 The GAS No. 5 is a specific regulation in Germany and affects the companies listed on the stock exchange in the Bavarian country. It was introduced by the German Accounting Standards Committee (GASC) in 2000. The stated objective was to regulate the disclosure of risk information concerning these specific companies. The GASC is the organization responsible of regulating specific accounting standards of the German nation With regard to the types of risks, this specific regulation is different from the previous two because the German accounting organisation forced to the companies to publish information on virtually all types of risks, forcing to the firms to have a global view of the types of risk, both financial like non-financial. This is a consequence of intent by the German authorities to consider the existence of a much larger range of risks that may affect such different societies.. Regarding the position in which the GASC wanted information on risk disclosures were published, the rule states that the German listed companies should do in the management report, just as to the FRR No. 48 standard.. First, the rule leaves the door open for the measurement of the quantification of risks, as it does not prescribe a specific methodology for it. In addition, the normative leaves the possibility that the companies themselves are using the methods of measuring risk. ~9~.
(13) Comparative analysis of risk disclosure indexes before and after the financial crisis. Francesc Pedro Andrés. that they believe to best appropriate for themselves. However, the regulation setting the condition that the risks will be quantified when companies can testify that these will be measured when, firstly, the companies can use safe and recognized methods, and secondly, when economically justified and can thus affect the decisions of investors. When this happens, the methodology used for quantification should be disclosed in the financial statements. It is important to underline that GASC provides this condition only for the financial risks.. Finally, note one of the peculiarities established in this regulation and that it have not found in the previous two. The GASC feature imposed was the obligation to report on two sides that has a risk, and it is the gross risk and the net risk. The net risk is defined as the difference between the risk mitigation obtained by the company through its risk management policies and gross risk. In this way the German accounting body want to societies published which were the gross risk and the net risk, and also explain what were the methods used to achieve these reductions. Below it shown a table with a summary of this German regulation:. GAS No. 5. Risk. Format. Measure. Qualitative. Non-specific. Non-specific. Information Non-Financial. format to use. measure to use. Financial Risk. Risk Table 3: Concepts of regulation GAS No. 5. 2.4. Nacional Regulation (PGC) Once explained the main regulations that rule international level accounting standards used by businesses in risk, I will also explain to the characteristics of national regulation, that is, from Spain.. First, the International Accounting Standards was adopted, and secondly, there were some modifications in both the "Código de Comercio" like in the "Ley de Sociedades Anónimas" in order to introduction the obligation to publish information on risks faced by financial instruments used by companies. The purpose of these amendments is to bring about a process of reform of the accounting standards in order to fill the void that. ~ 10 ~.
(14) Comparative analysis of risk disclosure indexes before and after the financial crisis. Francesc Pedro Andrés. has regulation in this sense, and that exploit the companies to provide the minimum information on risks.. The Spanish accounting regulations has different obligations depending on whether the companies are listed o no on the stock market of Spain, the IBEX-35: •. Companies that listed on the stock market and consolidate group: Spanish accounting rules require these companies to prepare financial statements according to accounting rules the International Accounting Standards. Specifically, in terms of assumed risk, it should apply the IFRS standard Nº7 explained in detail above.. •. Companies that listed on the stock market but not consolidate group, or companies that unlisted: These should prepare annual accounts in accordance with the accounting criteria established in Spanish legislation in the “Plan General de Contabilidad”. In terms of disclosure risks which provide the PGC, this indicates a list of the principal risks and uncertainties which companies should report. Mainly it comes to price risk exposures, credit, liquidity and cash flow, but also requires reporting on management policies used to mitigate risks and the goals they have for the near future.. With regard to the specific place where they should report on risks in its annual accounts, the Spanish agency forced to do so in the management report.. ~ 11 ~.
(15) Comparative analysis of risk disclosure indexes before and after the financial crisis. Francesc Pedro Andrés. 3. Risk disclosure literature Stanton and Stantos (2002) made some research studies risk information. The objective of this project was to investigate the number of studies that had been published between 1990 and 2000 period about disclosure risks. The result obtained was that 70 studies were written on the disclosure of risks. However, all these works spoke very generally about the risks faced by companies, and none more concretely specify what types of risks were, features that had, how had affected in the companies or the users of these information. However, it is true that in recent years has increased the number of investigations about the impact of the FRR No. 48 normative had, which we have seen in previous points, and that was issued by the Securities and Exchange Commission (SEC) about risk disclosure of derivatives market. Briefly, these works have been talking about empty that has occupied this law in terms of disclosure of risks issued by companies, as well as support offered to shareholders since then. This information was crucial to evaluate different risk exposures and developments of the derivatives business. In this sense, Rajgopal (1999) conducted a major research study about the relationship that existed between exposure to commodity risk, sensitivity to gas prices and the expectations placed on the oil market. The results confirmed that this association existed and revealed the real utility and the good reliability that the indicators on price sensitivity had. So it extracted three encouraging conclusions in this study: •. First, he showed that investors try to assess the risk associated with an investment decision thoroughly. Logical information knowing that investors always look for the best balance between the higher return assuming less risk.. •. Secondly, he examined the three different forms of disclosure rules allowing FRR No. 48, but he realized that consumers assess risk very differently depending on the format used. This can be a mistake, because although there are three different ways to find measurement risk, should not get mixed results. Thus the regulation tries to adapt to investors offering these alternatives for each investor should use that is most fits your needs, but not to obtain uneven results between them.. •. Third, he found that the disclosure requirements required by companies are usually a sum of insufficient information. The result is that users employ a measure of information that does not allow them to understand correctly the risk exposure of investing in different societies. These problems appear when. ~ 12 ~.
(16) Comparative analysis of risk disclosure indexes before and after the financial crisis. Francesc Pedro Andrés. companies do not meet the necessary requirements, and according to some empirical studies, it showed that there are a significantly high number of companies that do. One problem of main works that investigate the behaviour of firms after the incorporation of the rules FRR No. 48 is that it was examined in general the risks of the market, leaving aside another important type of risk, as credit or liquidity risk. Furthermore, only a small amount of writing is really focused on the disclosure of risks as well as management and risk policies. However, some research worked if it does, such as the writings by Linsley and Shrives (2000) in which adds some comparisons between the advantages and disadvantages that the disclosure of risks, and that are included in these risk reports. Afterwards, Linsley and Shrives (2005) wrote an article of similar topics focused on financial companies. The results showed the most important potential benefits arising from the improvement of publication about risk information, enabling a reduction in cost of capital. As a result of this reduction, capital providers can reduce a portion of the spread, which is one component of the cost of capital. Observe that both parties receive a benefit because users get improved information allowing them to make a more efficient decision-making, while companies benefit from a lower cost of capital. Linsley and Shrives (2000, 2005) suggest in their study that the provision of information by companies about the characteristics of the risks that affect them and how to combat them lies in a more useful for investors and their decisions. According to Dietrich et al. (2001), who also made various tests in terms of risk disclosure, support and defend the advantages of greater disclosure to allow to the market to have increased efficiency. However, Linsley and Shrives (2005) discussed the existence of some obstacles to major risk disclosures by companies. One of the most important obstacle is that exist still a tendency by managers to try to offer the least amount of risk information permitted by the accounting standards. They believe that the benefit of hiding information risk is greater than the benefit for publishing, when, according to them, this is not true. Moreover, several works also gone on record with different empirical studies about the legislation establishing by GASC in Germany, that is, the GAS No. 5. One example was Kajüter (2001) who said the requirements of this legislation was discussed by empirical findings discovered as to the risk disclosures performing German companies. ~ 13 ~.
(17) Comparative analysis of risk disclosure indexes before and after the financial crisis. Francesc Pedro Andrés. listed on the stock exchange. As already described in the previous section, this standard requires disclosure risk in the following exercises since 2000. The article written by Kajüter is compound by a sample of 82 non-financial companies. After making the relevant evidence, it appeared that most of these companies surveyed offered a systematic approach succeeded a restrictive risk disclosure, in which it was published the minimum information limited by regulation. In this line we find Woods and Reber (2003) who seemed suitable to raise a number of comparisons between 6 German companies affected by GAS No. 5 and 6 British companies regulated by international accounting standards, between 2000 and 2001, i.e., before and after the entry into force of the German legislation. Briefly, it sought to place the German level of disclosure before and after the GAS No 5 rule, taking as a reference the level of British companies. The conclusions were an increased risk of disclosure of German companies between 2000 and 2001, confirming the effect of accounting regulation on businesses. On this occasion, the measure for these recounts was counted as a risk disclosure the revelations that contained the word "risk". However, the negative aspect was that German companies were minimally publishing the magnitude of future risk, highly relevant information to users according Linsley and Shrives (2005). On the other hand, experts like Beattie et al (2004) extended the study of disclosures about more kind of information, including risk information, of three industry sectors, which were metallurgy, automotive and Agra Food. The study, whose sample consisted of 27 companies, provided information about all the annual report, also investigating topics different to the disclosure of risks. With respect to the numerical data obtained, only 813 units text of 12293 analysed (about 7%), referred to prospective data, i.e., with future vision. Moreover, of these 813, only 7% is quantified. On the other hand, only 291 units text relieve information about "risk-opportunity" (about 2.4%). Note that in the case of these samples, the dissemination of information on risk is relatively small, being almost all historical data and raising the difficulty discussed above for users.. Finally, we have one of the studies on risk information more extensive in recent decades, and are also the largest and most important to date of its publication, 2004. Its authors were Beretta and Bozzolan (2004). This research was based on Italian companies listed on the respective stock exchange of the country. So they were sampled 85 Italian companies. Among the most important conclusions found in this. ~ 14 ~.
(18) Comparative analysis of risk disclosure indexes before and after the financial crisis. Francesc Pedro Andrés. study, the authors noticed that Italian companies were reporting risk information, but the problem is that the information was about the past, some of this about the present, and almost nil-looking about future risk. Thus, Italian companies continued the trend we have been seeing in the companies in other countries. Therefore, those responsible for disseminating risk information companies still have a reluctant attitude in terms of publishing information about future risks, without specifying whether the information will have a positive or negative impact on their companies too. Furthermore, the authors also noticed that companies often tried to excuse the risks that have a negative impact will be due to external and uncontrollable actions for the company. So they try to show an image that if something negative happens, never seems to be the fault of the company. This class of actions by management has been demonstrated by studies that can be a major risk factor in the reporting.. ~ 15 ~.
(19) Comparative analysis of risk disclosure indexes before and after the financial crisis. Francesc Pedro Andrés. 4. Hypothesis In this research it attempts to establish a series of hypotheses that collect various proven methodologies, both theoretically like practically, in other works that are described above. However, these methodologies will be used with a new sample and a target that have not yet been sought in other studies at the moment. The sample has Spanish nationality. The aim is to contrast the rates of disclosure of different types of risks of these companies at different times in the recent economic history in Spain. These historical moments are specifically 2006 and 2011. Finally, methodology, data, sample and results will be explained in subsequent points. 4.1. Hypothesis in Spanish economic crisis Everyone knows the state of the economic in the past 7 or 8 years, specifically since 2007, which has extended an unprecedented and global financial crisis that has constantly whipped the countries across 5 continents, regardless of level of development and wealth of those. Many experts agree this financial crisis is one of the hardest in the history. The reasons for these affirmations are that it is a crisis that has affected the whole system in general: from the population and society, with numerous unemployment rates; to public entities, which have large debts and deficits; to private entities, such as multinational corporations and SMEs; great inequalities in societies, etc. After the first 3 or 4 years of this crisis, some countries showed signs of recovery and GDP growth, as the US or China, while others were sunk, worsening quarter after quarter. Countries like Spain, Greece or Italy. These behaviours have depended of different systematic structures that countries have developed throughout recent history, which have enabled some countries to generate new growth of GDP, while another has hindered his departure from the crisis. If we focus on Spain, it has been one of richest countries hardest hit and sunk, mainly caused because much of the Spanish GDP in 2005 and 2006 was from sectors of construction, which has finally been the sector most affected by the financial crisis. This situation has resulted in Spain high rates of unemployment, numerous business closures, immensely indebted entities, tremor of Welfare State followed to enormous social inequality, corruption, etc.. ~ 16 ~.
(20) Comparative analysis of risk disclosure indexes before and after the financial crisis. Francesc Pedro Andrés. So, the Spanish multinationals have also undergone several changes, having to adapt to the economic times by passing the world. Thanks to the enormous potential that have these companies in solvency, liquidity, customer base and high yields have been able to support these early years of this crisis. However, as stated above, these companies have changed structures inside too. This is where we find the main objective of this research: To determine whether nonfinancial Spanish companies that listed on IBEX-35 have greater risk disclosure in its financial statements since 2006, known as the year before the crisis, with high growth and huge financial data, until the year 2011, where the crisis had stabilized and the different companies had taken action on the matter to be safeguarded. Based on the above explanation, this research study has established the null hypothesis to which companies have more risk disclosure in their financial statements in periods of economic crisis those in periods of economic prosperity. Logically would expect that companies have improved their risk disclosure index during these years of financial crisis, where users of this information know the highest risk that they are being subjected now if they invest, compared to the level of risk that could have these companies in 2006. As a result, organizations are aware of the increased demand for risk information by users in order to be efficient in making decisions, and therefore should more give quantity of risk disclosure. However, we must also emphasize the possibility that happen the alternative hypothesis, which shows that quite the opposite might occur. Therefore, it could happen that a company hide even more risk that has the business now in order to appear less risky than other companies, provided this is within the legal terms, and therefore this company is constantly reflecting its real image. Briefly, the hypotheses to be tested are: •. H0:. The risk disclosure by companies is equal in financial crisis periods and. economic prosperity periods. •. H1: The risk disclosure by companies is different in financial crisis periods and economic prosperity periods.. ~ 17 ~.
(21) Comparative analysis of risk disclosure indexes before and after the financial crisis. Francesc Pedro Andrés. 5. Methodology 5.1. Measure of risk disclosure degree First, this point explains how and what have been the methods used for the analysis of narrative content that have been conducted in this research study. Note in the two years compared in each company has analysed both the Annual Report like the Management Report. One objective has been to know was the transfer of risk information of Annual Report to Management Report. However, the encoding of the risks as well as the risk disclosure indexes has made only about the Management Report. In this work, we have relied on the methodology proposed by Cabedo and Tirado (2009) to measure the risk disclosure degree of companies with the aim of establishing a universal unit of measurement information narrative content. Unlike other methodologies, such as Shrives Linsley (2006) or Abrham and Cox (2007), who took as unit of measurement phrases or keywords (e.g. risk), Cabedo and Tirado (2009) use stages. These are understood as an informational level about a particular aspect of risk, regardless of the length of the phrases that incorporate it. Using narrative stages like quantification methodology, the problem that arises with the quantity-quality relation is solved. It is important to do an aside: more quantity of risk disclosure does not equivalent to more quality of risk disclosure. For example, imagine that the company "A" speaks of the same risk in three paragraphs, but only mention it. However, the company "B" speaks only in one paragraph, but in it, mention, quantifies and informs about policies used to mitigate this risk. It would be unfair to say that the company "A" speaks three times more about this risk that the company "B". In the above example, it is observed that this methodology is used in order to encode them correctly risks. Once closed this aside, Tirado y Cabedo (2009) suggest that risk information can be classified into five stages, depending the quality of this information that is being disclosed: •. Stage 1: Companies simply mentioned the risks to which it is exposed.. •. Stage 2: Companies make a description of the risk while indicates how it affects.. •. Stage 3: Companies report quantitatively the impact of risk. •. Stage 4: Companies report the management carried out in this risk.. ~ 18 ~.
(22) Comparative analysis of risk disclosure indexes before and after the financial crisis. Francesc Pedro Andrés •. Stage 5: Companies report types of instruments used to mitigate the risk.. Note that stadiums are not exclusive, so a paragraph can be in more than one stage. Finally, the study also explains the construction of different indexes about risk disclosure. The risk disclosure index for each company is built from the number of stages in which it is located for each risk that the company provides. Therefore, there is a risk disclosure index for each of the companies and the years that have been studied, 2006 and 2011. This index is composed of three types of index for each type of global risk has been investigated in this study. First, there is the risk index (RI), which is composed as follows:. IR(i) = IRF(i) + IRNF(i) According to the above illustration,. IR(i). is the risk disclosure index of the company (i);. IRF(i) is the financial risks disclosure index of the company (i); Finally, IRNF(i) is the non-financial risk disclosure index of the company (i). To calculate. IR(i). is required the calculation of the other two sub-indices described in. the above equation So, for calculate IRF(i), we have the next equation:. In this equation, "rf" is the type of financial risk, "Erf" is the value of stage “j” about financial risk "rf" for the company (i). On the one hand, "Erf" have value 1 if the company (i) is in this stage, and on the other hand, have value 0 if not. In addition, “m” is the number of stages.. ~ 19 ~.
(23) Comparative analysis of risk disclosure indexes before and after the financial crisis. Francesc Pedro Andrés. So, for calculate IRNF(i) we have the follow illustration:. In this equation, "rNf is the type of non-financial risk, while "ErNf" is the value of the stage “j” about non-financial risk "rNf" for the company (i). Then, "ErNf" take value 1 if the company (i) located in that stage and take value 0 if not. "fih" reflects risk factors as long as categories of non-financial risk present more of a risk factor. Then, "fih" take value 1 for each of the “n” factors of each non-financial risk.. 5.2. Type of risk To analyse various type of risk disclosure degree we have used the business risk model proposed by Arthur Andersen and used by the ICAEW (1997) to propose a framework for disclosure an entrepreneurial risks. Authors like Shrives Linsley (2005) and Kajüter (2001) have also used this model to analyse the degree of disclosure of business risks in their research. So, Arthur Andersen divided the risks into the following types: •. Financial Risk (FR): o. Exchange Rate Risk: generated by changes in interest rates that the companies have contracted in their financial operations.. o. Interest rate Risk: derived from changes in the value of the exchange rates of currencies.. o. Commodity Risk: derived from variations in the price of goods.. o. Liquidity Risk: Potential losses resulting from the lack of liquidity to meet short-term obligations.. o. Credit Risk: derived by unexpected defaults in the customer base of the company caused by reduced liquidity or reduced solvency of them.. •. Non-Financial Risk (NFR): o. Strategic Risk: associated with the plans and future business strategies.. o. Business Risk: affects the competitiveness of the company and creating shareholder value.. ~ 20 ~.
(24) Comparative analysis of risk disclosure indexes before and after the financial crisis. Francesc Pedro Andrés. o. Empowerment Risk: risk factors which influence the internal strength of the company.. o. Information. Processing. and. Technological. Risk:. occasioned. in. processing information with inadequate technology systems. o. Integrity risk: derived from unethical actions of employees and management team that can influence the reputation of the company.. 5.3. T-Student Contrast Contrast hypothesis is defined as a procedure based on the observation of samples collected and the theory of probability to determine if the hypothesis is a reasonable sentence. So, is needed the support of a method that help estimate, given a level of assumed probability, the maximum variation that may suffer the risk factor value required. The method used is the statistical T Student test, whereas hypothesis testing will be an analysis of means that will allow realizing a hypothesis contrast, viewed in the point 4. In other word, observe if the companies have intensified the dissemination of information on risk since the financial crisis initiated in 2011 respect to 2006. This test applies when the sample obtained follows a normal distribution. However, will have a good result when the size of this population be too small to statistic be distributed normally. Therefore, is used an estimate of the standard deviation instead of the real value itself:. Distribution of T Student. ~ 21 ~.
(25) Comparative analysis of risk disclosure indexes before and after the financial crisis. Francesc Pedro Andrés. Specifically, this research has used the comparison of means for paired samples, where the hypothesis to contrast, which is explained in above point, is the follow: •. H0: X 2006 = X 2011. •. H1: X 2006 ≠ X 2011. where the X is the population average for 2006 and 2011.. The statistic used also for realize the contrast the hypothesis is the next:. t=. X −X σ (X − X ) n 2006. 2011. 2006. where the. X is the sample mean, and. σ (X. 2006. 2011. −X ) n 2011. is the standard error about. the average of differences.. Under the null hypothesis follows a Student t distribution with n-1 degrees of freedom:. •. The H0 will be accept when |t| ≤ tn−1; α/2. •. The H0 will be refuse when |t| > tn−1; α/2. ~ 22 ~.
(26) Comparative analysis of risk disclosure indexes before and after the financial crisis. Francesc Pedro Andrés. 6. Data and results 6.1. Data The initial sample collected for this research study has been 66 units. In turn, this sample of 66 consists in 33 companies, which have been collected the financial statements of two years, 2006 and 2011. These 33 are non-financial Spanish companies listed on the stock exchange Ibex-35. Thus, its main activity is not based on providing money. However there have been some problems in specific companies. Some of them existed in 2006, but have been involved in processes of fused with other companies before 2011, doing disappear some firms from one year to another, mainly caused by the problems associated with the financial crisis. Examples of companies with this problem have been Cintra, which it has fused in 2010 with Ferrovial. As has been said above, the samples are taken on December 31, 2006, i.e. for the financial year and the financial statements of 2006, and December 31, 2011, i.e. for the financial year and the financial statements respective of 2011. Finally, the total sample has been 62 units because some companies have eliminated of the sample because we have not been able to find the financial statements of a particular year by the problems described above, i.e., business fused. So, the information studied has been collected from the management reports of the different companies. For this, we have gone directly to the different corporate web of companies with objective to form the database on which we will work. This data source has been complemented with the database of the CNMV, as there have been some companies that have already abolished financial statements of 2006 at its corporate websites, considering that nine years have passed since 2006 until the actual moment. To make the database taking the possession of the financial statements of the two years, there have been the following actions on the management report: •. First it is counted only those paragraphs about disclosure of risk information. •. Second it is also counted the total number of paragraphs of these financial statements. •. Third has been encoded each paragraph in the 5 stages explained above according to the type of information that reported in these. Therefore, it have accumulated paragraphs of the same type of risk at different stages to which. ~ 23 ~.
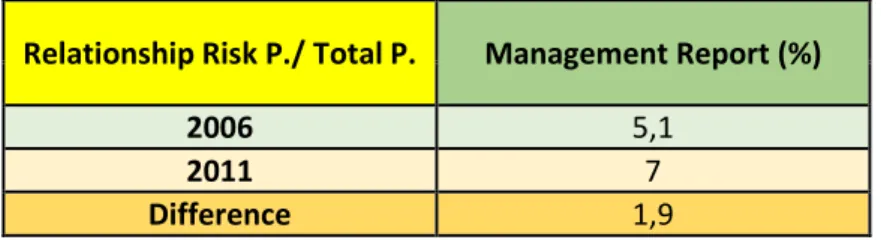
(27) Comparative analysis of risk disclosure indexes before and after the financial crisis. Francesc Pedro Andrés. they belonged, with the intention to demonstrate, as mentioned above, the quality of risk information that disclose the different companies in their Management Reports. 6.2. Results 6.2.1. Indexes development First will be presented Table 1 where one wants to compare the relationship that has existed between the total paragraphs and paragraphs that speak only about risk information in the management report on the different years studied, with the purpose of show the variations:. Relationship Risk P./ Total P.. Management Report (%). 2006 2011 Difference. 5,1 7 1,9. Table 1: Relation between total paragraphs and risk paragraphs. The data presented in the above table are in percentage. With respect to the management report, we note that there has been an increase in the ratio between the two years. In 2006, companies were reporting in average about 5 paragraphs of 100, while in 2011, this figure has increased until 7%. The reasons of this growth are: •. First, as showed in the Table 2, many companies in 2006 spoke absolutely nothing about risks disclosure in the management report, while in 2011, almost all of companies speak some type of risk information (one except). This increases the above relationship.. •. Second, Management Reports have not suffered a high increase of total paragraphs, like the Annual Report has had. Is necessary to comment that the Annual Report published in 2011 have had a high increase about total paragraphs disclosure compared in 2006, and in the same companies. This could be logical because the Report Management is a secondary document compared to the Annual Report. Therefore, companies have not put the same. ~ 24 ~.
(28) Comparative analysis of risk disclosure indexes before and after the financial crisis. Francesc Pedro Andrés. emphasis about the increases of information disclosure in the two types of documents. Secondly, it will explain another table (Table 2) that will compare the number of companies that report risk information disclosure in Management Report in the two years:. Risk. Risk disclosure 2006 2011. No information Information No information Information. Nº 9 21 1 29. % 30 70 3 97. Table 2: Risk disclosure in Management Report. In this table are shown the number of companies in 2006 that not reported any paragraph about any risks. In this case were 9 companies, equal to 30% of the sample for this year. It is a high number considering that the companies were required by international accounting standards, above view, to include in this report the main risks to which they are exposed. However, we observed in 2011, except the company "Distribución Internacional de Alimentos (DIA SA)", the rest have already included risk disclosure in Management Reports, adapting to the established regulation and benefiting users. From this point on, we will explain in more detail the information seen in the above tables, differentiating the financial risk of non-financial risk, and showing the differences and similarities between the two years in terms of risk disclosure. Below we can see the Table 3, where specified the different types of financial risk and the way that companies write about them in Management Reports:. ~ 25 ~.
(29) Comparative analysis of risk disclosure indexes before and after the financial crisis. Francesc Pedro Andrés. Interest rate Risk. Financial Risk. Exchange Rate Risk. Commodity Risk. Credit Risk. Liquidity Risk. Nº. %. Nº. %. Nº. %. Nº. %. Nº. %. Information. 15. 50. 16. 53. 24. 80. 22. 73. 21. 70. No Information. 15. 50. 14. 47. 6. 20. 9. 27. 9. 30. Information. 10. 33. 9. 30. 17. 57. 11. 37. 13. 43. No Information. 20. 67. 21. 70. 13. 43. 19. 63. 17. 57. Stage 1 Stage 2 Stage 3 Stage 4 Stage 5 Stage 1 Stage 2 Stage 3 Stage 4 Stage 5. 15 7 4 6 5 20 10 3 11 5. 100 47 27 40 33 100 50 15 55 25. ESTADIOS 14 9 3 6 7 21 14 2 9 9. 100 64 21 43 50 100 67 10 43 43. 6 5 1 6 3 13 10 0 6 4. 100 83 17 100 50 100 77 0 46 31. 9 5 0 3 2 19 12 1 9 4. 100 56 0 33 25 100 63 5 47 21. 9 4 2 5 3 17 7 0 8 2. 100 44 22 56 33 100 41 0 47 12. 2006. 2011. 2006. 2011. Table 3: Financial risk disclosure in the Management Report •. Stage 1: Mention only the risks to which they are exposed. •. Stage 2: Perform a description of the risk and how it affects the company. •. Stage 3: Measure quantitatively the impact of risk. •. Stage 4: Report on risk management. •. Stage 5: Report on the types of instruments used to mitigate the risk.. Respect to 2006, the interest rate risk and the exchange rate risk are the risk that companies divulge more. However, the percentage of those companies that did it was approximately 50% of companies, the percentage was short. Respect the stages, between 40% and 60% approximately of companies that reported financial risk information did it in the stage 2 and 4, i.e., the explication and management of the two types of risks we are analysing. Underline the 50% in the stage 5, which has also been a good data, although has been only reflected in the exchange rate risk, not in the interest rate risk. However, the percentage of stage 3, risk quantification, has been quite low in the two risks. As for the other three types of risk, the percentages of companies that have reported information about them have ranged between 20 and 30%. The data are very short and give an idea of the low general risk disclosure in 2006. As for the stages, companies. ~ 26 ~.
(30) Comparative analysis of risk disclosure indexes before and after the financial crisis. Francesc Pedro Andrés. follow a similar trend to the previous risks. Both stages 2 like 4 have gotten correct data. Note the 80% about commodity risk and the 56% about credit risk in the stages 2. With respect to stage 5, has a lower rate than the previous two stages, ranging from 25 to 50%. Finally, the stage 3 has been the worst level in terms of percentage, ranging from 0% to 17% of maximum. Respect to 2011, we can see several important changes compared to 2006. First, we observe that the risks assumed as secondary in 2006 have taken more importance in 2011, getting even to levels of the two main risks in 2006, exchange rate risk and interest rate risk. This has been caused by the type of financial crisis that only affected in 2011 because both credit risk as liquidity risk had strongly increased respect to 2006, so the users had demanded in 2011 an increase of this risk disclosure too. Second, we observe the increase trend about information disclosure of the 5 types of risk, getting almost all of companies above to 50% of information disclosure. Excluding the risk of commodity, the other 4 risk have got high percentages, varying between 60 and 70%. Commodity risk is the kind of risk least disclosed by the companies in this year too. Respect to stages, the behaviour is similar than 2006. Thus, Stage 2 is the most notable of all stages, with percentages about 60%. Stage 4 has stagnated compared to 2006, with an average of approximately 48%. However the stage 5 has plummeted, and companies have not disclosed information about the instruments used to mitigate risks, because the average stood at 25%. Finally, we find in 2011 that the stage 3 continues almost unnoticed by companies, where only 6% surveyed firms quantify all risks in its Management Report. Next, there is a graph will demonstrate in a visual way the increase regarding disclosure of 2011 compared with 2006, and how some risk have assumed more importance in 2011 too, such as liquidity risk and credit risk:. ~ 27 ~.
(31) Comparative analysis of risk disclosure indexes before and after the financial crisis. Francesc Pedro Andrés. 70 60. 70. 67. 63 57. 50. 50. 47. 43 2006. 40 27. 30. 30 2011. 20. 20 10 0 Interest rate Risk. Exchange Rate Risk. Commodity Risk. Credit Risk. Liquidity Risk. Graph 1: Comparison of financial risk disclosure in 2006 and 2011. Finally, in this section shown the details of the rates of non-financial risks disclosure, through the Table 4: NonFinancial Risk 2006 2011. No Information Information No Information Information 1 2 3 4 5 1 2 3 4 5. 2006. 2011. Business Risk Nº % 24 80 6 20 14 47 16 53 6 1 0 3 1 16 10 1 1 1. 100 17 0 50 17 100 63 6 6 6. Empowerment Technological Risk Risk Nº % Nº % 25 83 27 90 5 17 3 10 26 87 23 77 4 13 7 23 ESTADIOS 5 100 3 100 1 20 2 67 0 0 0 0 1 20 1 33 1 20 1 33 4 100 7 100 0 0 3 43 0 0 0 0 2 50 3 43 0 0 0 0. Integrity risk Nº % 29 97 1 3 25 83 5 17. Strategic Risk Nº % 20 67 10 33 11 37 19 63. 1 0 0 0 0 5 1 0 1 0. 10 3 0 3 1 19 9 1 1 0. 100 0 0 0 0 100 20 0 20 0. Table 4: Non-Financial risk disclosure in the Management Report •. Stage 1: Mention only the risks to which they are exposed. •. Stage 2: Perform a description of the risk and how it affects the company. •. Stage 3: Measure quantitatively the impact of risk. ~ 28 ~. 100 30 0 30 10 100 47 5 5 0.
(32) Comparative analysis of risk disclosure indexes before and after the financial crisis. Francesc Pedro Andrés •. Stage 4: Report on risk management. •. Stage 5: Report on the types of instruments used to mitigate the risk. Regarding to 2006, we can see how is almost null the risk disclosure. Business risk and strategy risk are the most important with percentages of 20% and 33% respectively. As for the 3 risks remaining, these are almost negligible, with percentages oscillating between 0 and 17%. Respect to stages, none are defined as the most important because the stages 2, 4 and 5 have very different percentages in the different type of non-financial risks. The only certainty is the null apparition of the stage 3, with 0% of quantification in any of the 5 types of non-financial risk. Regarding to 2011, this year continue the trend set in 2006 in terms of the types of risk, but with more disclosure in all of them. Both business risk as strategically risk are locating now around 55 and 65%. These data obtained in 2011 about these two risks are close to some financial risks seen before. However, the three remaining risks have increased slightly compared to 2006 but remain marginal. Respect to stages, highlighting the slump of percentage of stage 5, which obtained together with the stage 3, similar percentages to 0%. Regarding the stage 2 and stage 4, these are the most important, but this stages get mixed percentages depending on the type of risk is observed. Below, the graph No. 2 supports the above explanation, in which only business risk and strategic risk are disclosed in the Management Reports:. 63. 70 53. 60 50. 33. 40 30. 20. 20. 23 17. 13. 2011. 17 10 3. 10 0 Business Risk. Empowerment Risk. Technological Risk. Integrity risk. Strategic Risk. Graph 2: Comparison of non-financial risk disclosure in 2006 and 2011. ~ 29 ~. 2006.
(33) Comparative analysis of risk disclosure indexes before and after the financial crisis. Francesc Pedro Andrés. 6.2.2. Risk disclosure indexes In this section will publish the different disclosure indexes which will allow us to observe the behaviour of trends of risk information between 2006 and 2011. Next we can see both financial risks disclosure index (IRF) like non-financial risks disclosure index (IRNF), which have already been explained in detail the methodology in the section above, and the two indexes together compose the final index (IR) The objective of this section is to present a data set represented through tables and graphs that help to understand in a visual way what have been the movements and trends about the significance of risk disclosure in the two years about the sample taken. For this, show the Table 5: 2006. 2011. Stage Average. Nº. %. Nº. %. IR IRF IRNF. 5,81 3,77 2,03. 100 65 35. 10,84 6,23 4,61. 100 57 43. In this table it can see the different average of the stages achieved about Management Report of the two years. In addition, the percentage of financial risks and non-financial risks is also published. First, highlight the difference between the number of paragraphs about risk disclosed in 2006 and in 2011, with an unequal of almost twice in terms of paragraphs. Secondly, it can see reflected in the explanatory table the little importance was given to nonfinancial risks in 2006, and the progress that have taken these until 2011, reducing the distances that separate the two families of risk. It states that there is a trend to equalization of disclosure of information about both types of risks.. ~ 30 ~.
(34) Comparative analysis of risk disclosure indexes before and after the financial crisis. Francesc Pedro Andrés. 12,00 10,00 4,72 8,00. IRNF. 6,00. IRF. 1,97. 4,00. 6,16 3,78. 2,00 0,00. 2006. 2011. Graph 3: Comparison of risk disclosure indexes in average in 2006 and 2011. Noted in this graph of stacked column the change occurred in the global risk disclosure, from less than 6 stages in 2006 to about 11 around the year 2011. Also seen in the graph the garnet colour, who reflects the non-financial risks, it has gained ground to the financial risks, represented by the colour blue, equalizing the differences established in 2006. Finally, there is one last table (Table 6) that provides the indexes of significance that have the different types of risk between the two years: T test for average of two paired sample Average Variance Observations. IR. IRF. IRNF. 2006 2011 2006 2011 2006 2011 5,75 10,875 3,78125 6,15625 1,96875 4,71875 58,3225806 94,3709677 23,8538306 30,78125 14,6118952 39,2409274 32. 32. 32. 32. 32. 32. Hypothetical average difference. 0. 0. 0. Degree of freedom. 31. 31. 31. Statistical t. -3,409418664. -2,306825861. -2,795457625. P(T<=t) two-tails. 0,001824976 *. 0,027911287 **. 0,008816169 *. Critical value of t (twotails). 2,039513446. 2,039513446. 2,039513446. Table 6: Significance of disclosure index in 2006 and 20117 (*) Significant at 1% (**) Significant at 5%. ~ 31 ~.
(35) Comparative analysis of risk disclosure indexes before and after the financial crisis. Francesc Pedro Andrés. Regarding to Table 6, it observed data as average or variance of the different kinds of risk. However, the most significant data to be found in this table is the P (T <= t) twotailed, who is equivalent to the significance of change of risk disclosure information between 2006 and 2011. In this case, comparing the financial risk and non-financial risk, we find that has been more significant growth of non-financial risk disclosure. This result supports the data and explanations above, in which the strong growth of nonfinancial risks indicated. Furthermore, conclusions show the tendency to equalization disclosure of the major types of risk in the time.. In addition, in the above table we obtain a still more important fact demonstrating the theory and the objective of this research because the level of significance obtained in disclosure of global risk information was even higher, and therefore, the hypothesis is fulfilled. It is simply that companies have more risk disclosure in times of financial crisis than times of economic prosperity.. The results of this research show the existence of statistically significant differences for the three risk disclosure indexes. So, these results reject the null hypothesis, who it says that the risk disclosure in companies is equal in periods of financial crisis and in periods of economic prosperity. So finally, in times of financial crisis (2011) the companies disclose more risk information than in periods of economic prosperity (2006). 6.2.3. Conclusions Throughout this research study we has been denouncing the lack of risk disclosure by businesses through articles and documents of national and international authors named in previous points, warning the inefficiency that has this information and it difficult the decision-making by users.. Increased risk disclosure has many advantages, and these benefit both the companies as users of this information. One of the most important advantages is the reduction of the spread, which allows companies have lower risk capital, thanks to the influence that have this information in investors because it relates directly to a reduction of uncertainty.. ~ 32 ~.
(36) Comparative analysis of risk disclosure indexes before and after the financial crisis. Francesc Pedro Andrés. This research study aims to show if companies have intensified the risk disclosures in their financial statements, concretely the Management Report, as a result of the financial crisis which Spain is immersed.. To achieve this purpose we have collected information getting a sample of 62 data, which is composed of Management Report of two full years of 31 companies. These years are 2006 and 2011. Are years that it lives a different economic context. These 31 companies that compose the sample used by research are firms listed in the stock market of Spain, IBEX-35, and these are companies with non-financial character.. Finally, the results obtained in the study according to the sample used show that these 31 companies have intensified risk disclosure in the Management Report since 2006 until 2011, and this increase has been both financial risks as non-financial risks. This behaviour is caused by increase of demand of risk information by users caused by the financial crisis started in 2007 that increased exponentially both uncertainty and caution that have currently investors and users of this information when making decisions.. ~ 33 ~.
(37) Comparative analysis of risk disclosure indexes before and after the financial crisis. Francesc Pedro Andrés. 7. References. Beattie, V., McInnes, W., Fearnley, S., (2004ª). Through. the. Eyes. Hunt, B., (2003) The Timid Corporation: Why Business is Terrified of Taking. of. Risk, Wiley, Chichester.. Management: Narrative Reporting Across Three Sectors. Final Report, ICAEW. Centre. for. Business. Kajüter,. framework for the analysis of firm. 5, Der Betrieb.. communication,. The. Lev, B., Zarowin, P., (1999) The boundaries of financial reporting and. International Journal of Accounting,. how to extend them, Journal of. Num. 39, May. Accounting Research, Vol. 37, Mar.. Cabedo, J.D., Tirado,J.M. (2004) The disclosure of risk in financial statements, Accounting Forum Review, Num. 28, Oct.. Linsley, P., Shrives, P., (2000) Risk management and reporting risk in the UK, Journal of Risk, Num. 3, Sep.. Cabedo, J.D., Tirado, J.M., (2007) La regulación. contable de. riesgos. sobre en. los. Linsley,. P.,. (2005). Regulation and Compliance, Num. 13, Oct.. Cabedo, J.D., Tirado, J.M., (2009) Divulgación de información sobre riesgos: una propuesta para su. Linsley, P., Shrives, P., (2006) Risk reporting: A study of risk disclosures. medición, Innovar Journal, Vol. 19,. in. May-Aug.. the. annual. reports. of. UK. companies, The British Accounting. J.R.,. Kachelmeier,. Review, Num. 38, May.. S.J.,. Kleinmuntz, D.N., Linsmeier, T.J., (2001) Market efficiency, bounded. business. Shrives,. banking sector”, Journal of Financial. Journal, núm. 184, Jan.. rationality,. P.,. Disclosure of risk information in the. estados financieros, Partida Doble. Dietrich,. Empirische. Befunde und der Entwurf des DRS. Beretta, S., Bozzolan, S., (2004) A. divulgación. (2001). Risikoberichterstattung:. Performance, London.. risk. P.,. and. supplemental. reporting. disclosures”,. Rajgopal, S., (1999) Early evidence on. Journal of Accounting Research.. ~ 34 ~. the informativeness of the SEC’s market risks disclosures: the case of commodity price risk exposure of oil.
(38) Comparative analysis of risk disclosure indexes before and after the financial crisis. Francesc Pedro Andrés. and gas producers, The Accounting. Stanton,. Review, Num. 74, Jul.. P.,. Stanton,. J.,. (2002). Corporate annual reports: research perspectives. Schrand, CM., Elliott, JA., (1998) Risk. Accounting,. Auditing and Accountability Journal. and financial reporting: a summary. (EDITORIAL), Vol 15, Jun.. of the discussion at the 1997, AAA / FASB conference.. used,. Woods,. M.,. Reber,. B.,. (2003). A. comparison of UK and German Solomon, J.F., Solomon, A., Norton, S.D.,. Joseph,. N.L.,. (2000). A. conceptual framework for corporate risk disclosure emerging from the agenda for corporate governance reform,. The. British. Accounting. Review, Num. 32, Jan.. ~ 35 ~. reporting. practice. in. respect. of. disclosure post GAS 5, Unpublished conference Reporting. paper,. 6th. and. Financial Business. Communication Conference, Cardiff Business School, Cardiff..
(39)
Figure


+3


Documento similar
In the preparation of this report, the Venice Commission has relied on the comments of its rapporteurs; its recently adopted Report on Respect for Democracy, Human Rights and the Rule
Keywords: iPSCs; induced pluripotent stem cells; clinics; clinical trial; drug screening; personalized medicine; regenerative medicine.. The Evolution of
Astrometric and photometric star cata- logues derived from the ESA HIPPARCOS Space Astrometry Mission.
The photometry of the 236 238 objects detected in the reference images was grouped into the reference catalog (Table 3) 5 , which contains the object identifier, the right
In addition to traffic and noise exposure data, the calculation method requires the following inputs: noise costs per day per person exposed to road traffic
Public archives are well-established through the work of the national archive services, local authority-run record offices, local studies libraries, universities and further
Method: This article aims to bring some order to the polysemy and synonymy of the terms that are often used in the production of graphic representations and to
In the “big picture” perspective of the recent years that we have described in Brazil, Spain, Portugal and Puerto Rico there are some similarities and important differences,
