A NuSTAR survey of nearby ultraluminous infrared galaxies
16
0
0
Texto completo
(2) The Astrophysical Journal, 814:56 (16pp), 2015 November 20. Teng et al.. NuSTAR brings improved angular resolution (half-power diameter, or HPD, ∼58″) and improved sensitivity at energies above 10 keV to bear on the problem of whether AGNs contribute significantly to the bolometric output of ULIRGs. In this paper, we present the results of a NuSTAR survey of nine of the nearest ULIRGs. This paper is organized as follows: Section 2 details our sample and their multi-wavelength properties; Section 3 presents the new X-ray observations obtained for this study; Section 4 presents the NuSTAR photometry of our sample; Section 5 presents a detailed broadband X-ray spectral analysis of our sample, Section 6 discusses the general properties of ULIRGs in our study; and Section 7 summarizes our results. Throughout this paper, we adopt H0 = 71 km s−1 Mpc−1, ΩM = 0.27, and Λ = 0.73 (Hinshaw et al. 2009). Luminosities taken from the literature have been recalculated for our assumed cosmology.. Genzel et al. 2001; Kim et al. 2002). In simulations (Di Matteo et al. 2005; Springel et al. 2005; Hopkins et al. 2008), during the final coalescence of the merging galaxies, massive gas inflows trigger rates of star formation as high as those inferred for ULIRGs, and nuclear accretion may be obscured by large, even Compton-thick (NH1024 cm−2) column densities. In this picture, feedback from nuclear accretion eventually disperses the gas, and a traditional optical quasar is revealed. Supporting this picture is the observational evidence that AGNs are more common in ULIRGs with morphologies that are advanced mergers (e.g., Veilleux et al. 2009a; Teng & Veilleux 2010). It is one thing to find AGN signatures in a galaxy, and a very different thing to find that the AGN dominates the galaxy’s energy production. For a quarter century, a key question has been, “Are ULIRGs powered mainly by star formation, or by nuclear accretion?” (e.g., Genzel et al. 1998; Armus et al. 2007; Farrah et al. 2007; Veilleux et al. 2009a). Excitation diagrams (Genzel & Cesarsky 2000; Armus et al. 2007) using midinfrared diagnostics were developed to determine which ULIRGs are AGN-dominated. While these diagnostics generally correlate, systematic errors and considerable scatter remain (Veilleux et al. 2009a). Thus, while excitation diagrams have indicated which ULIRGs have larger AGN contributions in a relative sense, they have not settled the question of whether accretion power dominates the energetics of ULIRGs. Many X-ray surveys have attempted to quantify the AGN contribution in ULIRGs. For example, half of the ULIRG sample of Koss et al. (2013) was detected by the Swift Burst Alert Telescope (BAT) at energies above 14 keV. A complication is that ULIRGs are notoriously X-ray weak, generally believed to be due to obscuration (e.g., Franceschini et al. 2003; Ptak et al. 2003; Teng et al. 2005). There is growing evidence that the AGNs in many ULIRGs are obscured by Compton-thick column densities. For example, IRASF04103–2838 has an iron line with a large equivalent width (EW) of ∼1.6 keV (Teng et al. 2008), as predicted for AGNs obscured by high column densities (Krolik & Kallman 1987; Levenson et al. 2002). As a second example, using Suzaku, Braito et al. (2009) reported a direct AGN component above 10 keV in the Superantennae, and Teng et al. (2009) reported a marginal detection in Mrk273. However, these latter detections are at very low levels, near the sensitivity limits of Suzaku and BeppoSAX, and may additionally suffer from contamination by unrelated sources due to the limited spatial resolution of those observatories at energies above 10 keV. An example of these limitations can be found in the case of Mrk231: BeppoSAX and Suzaku reported a direct AGN component above 10 keV (Braito et al. 2004; Piconcelli et al. 2013). However, recent Nuclear Spectroscopic Telescope Array (NuSTAR; Harrison et al. 2013) observations of Mrk231 found that the AGN is in fact intrinsically X-ray weak rather than highly obscured as previously thought (Teng et al. 2014). The ratio of intrinsic 2–10 keV luminosity to bolometric luminosity for Mrk231 is only 0.03%, compared to the 2%–15% seen in Seyferts and radio-quiet quasars (Elvis et al. 1994). For objects accreting at close to the Eddington rate, the same ratio is typically ∼0.3%–0.7% (e.g., Vasudevan & Fabian 2009; Lusso et al. 2010, 2012). Thus, the previous claimed detections at energies above 10 keV may have been due to contamination (Teng et al. 2014).. 2. THE SAMPLE 2.1. The Selection During its two-year baseline mission, NuSTAR observed a sample of nine of the nearest (z<0.078) ULIRGs, out of the total sample of ∼25 ULIRGs within that volume, based on the selection of Sanders et al. (2003). The sample was split into a “deep” sample of five ULIRGs observed for >50 ks, and a “shallow” sample of four objects observed for ∼25 ks. The deep sample consists of the four ULIRGs at z<0.078 that are brightest at 60 μm. This selection by low redshift and high infrared brightness was done to maximize the likelihood of obtaining high-quality NuSTAR data. The Superantennae was added to the deep sample because previous observations at >10 keV suggested the presence of a Compton-thick AGN. All five deep survey sources have previous observations above 10 keV by BeppoSAX or Suzaku PIN; three have reported detections. In addition, the deep sample targets have simultaneous soft X-ray coverage from either Chandra (Mrk 231; Teng et al. 2014) or XMM-Newton (the other four). Table 1 lists the targets and exposure times for the entire sample. The shallow sample targeted nearby ULIRGs showing AGN signatures in their optical spectra. Thus, the shallow sample, like the deep sample, is biased toward high detection rates at X-ray energies. 2.2. Multiwavelength Characterization of the NuSTAR Sample The targets in our sample have been very well studied across the electromagnetic spectrum. In this section, we note the information at other wavelengths and past X-ray observations that are relevant to our study. 2.2.1. The Deep Survey. 1. IRAS05189–2524 is an advanced-stage merger with a single nucleus. Optically classified as a Seyfert 2, nearinfrared spectroscopy reveals the presence of a hidden broad line region via broad Paschen α (Veilleux et al. 1999a, 1999b). Continuum and emission-line diagnostics from Spitzer spectra indicate that the infrared luminosity of this source is dominated by an AGN (Veilleux et al. 2009a). In the X-ray band, IRAS05189–2524 is one of the brightest ULIRGs on the sky. Historic XMM-Newton and Chandra data imply a 2–10 keV X-ray continuum with a 2.
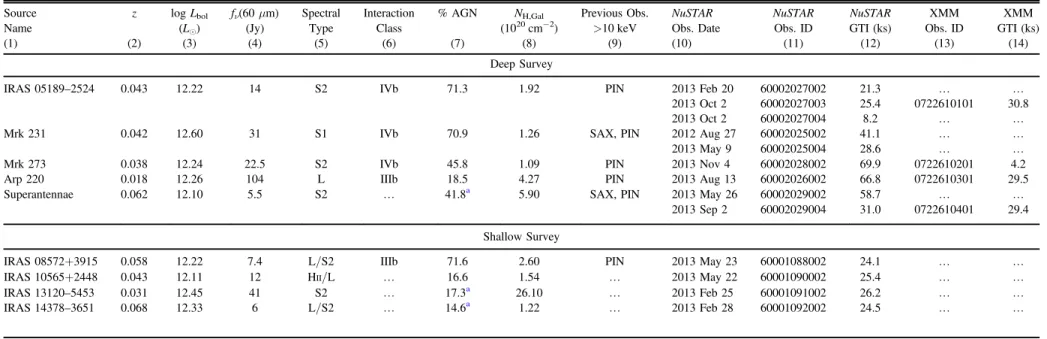
(3) Source Name (1). z (2). log Lbol (Le) (3). fν(60 μm) (Jy) (4). Spectral Type (5). Interaction Class (6). % AGN (7). NH,Gal (1020 cm−2) (8). Previous Obs. >10 keV (9). NuSTAR Obs. Date (10). NuSTAR Obs. ID (11). NuSTAR GTI (ks) (12). XMM Obs. ID (13). XMM GTI (ks) (14). Deep Survey IRAS 05189–2524. 0.043. 12.22. 14. S2. IVb. 71.3. 1.92. PIN. Mrk 231. 0.042. 12.60. 31. S1. IVb. 70.9. 1.26. SAX, PIN. Mrk 273 Arp 220 Superantennae. 0.038 0.018 0.062. 12.24 12.26 12.10. 22.5 104 5.5. S2 L S2. IVb IIIb K. 45.8 18.5 41.8a. 1.09 4.27 5.90. PIN PIN SAX, PIN. 2013 2013 2013 2012 2013 2013 2013 2013 2013. Feb 20 Oct 2 Oct 2 Aug 27 May 9 Nov 4 Aug 13 May 26 Sep 2. 60002027002 60002027003 60002027004 60002025002 60002025004 60002028002 60002026002 60002029002 60002029004. 21.3 25.4 8.2 41.1 28.6 69.9 66.8 58.7 31.0. K 0722610101 K K K 0722610201 0722610301 K 0722610401. K 30.8 K K K 4.2 29.5 K 29.4. 2013 2013 2013 2013. May 23 May 22 Feb 25 Feb 28. 60001088002 60001090002 60001091002 60001092002. 24.1 25.4 26.2 24.5. K K K K. K K K K. The Astrophysical Journal, 814:56 (16pp), 2015 November 20. Table 1 The Sample. Shallow Survey. 3. IRAS IRAS IRAS IRAS. 08572+3915 10565+2448 13120–5453 14378–3651. 0.058 0.043 0.031 0.068. 12.22 12.11 12.45 12.33. 7.4 12 41 6. L/S2 HII/L S2 L/S2. IIIb K K K. 71.6 16.6 17.3a 14.6a. 2.60 1.54 26.10 1.22. PIN K K K. Notes. Col. (1): source name. Col. (2): redshift. Col. (3): bolometric luminosity which is assumed to be 1.15L8–1000 μm. Col. (4): optical spectral type (S1 = Seyfert 1; S2 = Seyfert 2; L = LINER; HII = H II region). Col. (5): interaction class, which is a proxy for the age of the merger, ranging from III to V (see Veilleux et al. 2002). Col. (6) IRAS 60μm flux density from Kim & Sanders (1998). Col. (7): the fraction of the total infrared luminosity attributed to the AGN using six independent methods of evaluating line and continuum Spitzer data (Veilleux et al. 2009a). Col. (8): the Galactic column density from Dickey & Lockman (1990). Col. (9): previous pointed hard X-ray observations. Col. (10): observation start date of the NuSTAR data. Col. (11): NuSTAR observation identification. Col. (12): NuSTAR good time interval. Col. (13): simultaneous XMMNewton observation identification. Col. (14): XMM-Newton good time interval. a These three objects were not studied in Veilleux et al. (2009a). To calculate the AGN fraction in these sources, we downloaded reduced spectra from the Cornell Atlas of Spitzer/Infrared Spectrograph Sources (CASSIS; Lebouteiller et al. 2011). We then fit each spectrum using PAHFIT version 1.2 (Smith & Draine 2007). These measurements were used to estimate the AGN fraction following the recipe for methods 1–4 and 6 in Veilleux et al. (2009a). The estimated AGN fractions from these five methods were averaged together.. Teng et al..
(4) The Astrophysical Journal, 814:56 (16pp), 2015 November 20. Teng et al.. −1. luminosity of ∼10 ergs . The source was observed by Suzaku in 2006, at which time its 2–10 keV flux appears to have dropped by a factor of ∼30 and the Fe line became more prominent. Its 0.5–2 keV flux appeared unchanged. The target was undetected by Suzaku PIN (Teng et al. 2009), and those data were unable to distinguish whether this change in observed flux was due to a change in the intrinsic AGN luminosity or to a change in the thickness of the absorbing column. IRAS05189–252 was also detected by Swift BAT in the 14–195 keV energy range (Koss et al. 2013). Of the four ULIRGs surveyed by Koss et al. (2013), IRAS05189–2524 has the most significant detection in the 24–35 keV band, at 4.2 σ. 2. Mrk 231 is a merger remnant that contains both an intense starburst and a luminous quasar with a Type 1 optical spectral classification. It is also a rare iron lowionization broad absorption line quasar (FeLoBAL; e.g., Adams & Weedman 1972; Gallagher et al. 2002, 2005; Veilleux et al. 2013). Continuum and emission-line diagnostics from Spitzer spectra indicate that the infrared luminosity of this source is dominated by an AGN (Veilleux et al. 2009a). Teng et al. (2014) found that the AGN is Compton-thin and intrinsically X-ray weak, with the intrinsic 2–10 keV luminosity being only 0.03% of the AGN bolometric luminosity. The NuSTAR and Chandra X-ray data on this source were also analyzed by Feruglio et al. (2015). Their results suggest the presence of an ultrafast outflow where the ionized wind reaches speeds of ∼2 × 10⁴ km s−1. 3. Mrk 273 shows a single nucleus in UV and optical images, but the near-infrared reveals a double nucleus (Armus et al. 1990; Scoville et al. 2000; Surace et al. 2000). It is optically classified as a Seyfert2 galaxy (Khachikian & Weedman 1974; Veilleux et al. 1999a). Continuum and emission-line diagnostics from Spitzer spectra indicate that roughly half the infrared luminosity of this source is powered by an AGN (Veilleux et al. 2009a). Teng et al. (2009) reported a 1.8σ detection of Mrk 273 by Suzaku PIN. Their best-fit model used two partial covering absorbers to model minor spectral variability below 10 keV over six years. The model favored the scenario in which the covering fractions of the absorbers (NH,1∼1.6 × 1024 cm−2, NH,2 ~ 3 ´ 10 23 cm−2) was time-variable. Koss et al. (2013) reported a 2.4σ detection in the 24–35 keV band. 4. Arp 220 is the closest ULIRG, has a double nucleus, and is one of the most famous infrared sources. It is optically classified as a LINER (Armus et al. 1989; Taniguchi et al. 1999). CO observations suggest that the western nucleus hosts a deeply buried AGN. The total column density of that nucleus is ∼1025 cm−2 (Downes & Eckart 2007; Scoville et al. 2014). Continuum and emission-line diagnostics from Spitzer spectra indicate that the AGN powers a small fraction of the total infrared luminosity (Armus et al. 2007; Veilleux et al. 2009a). Past X-ray observations find that the nuclear spectrum of Arp 220 is best fit by a flat power law (Ptak et al. 2003), and Iwasawa et al. (2005) detected a strong Fe K emission line (EW = 1.9±0.9 keV) in low-quality XMM-Newton data, implying a Compton-thick nucleus. 43. The detection of the line was confirmed by Teng et al. (2009) using Suzaku data, but with an EW of only +0.54 0.420.32 keV. Arp 220 was undetected by Suzaku above 10 keV (Teng et al. 2009). 5. The Superantennae, also known as IRASF19254–7245, is a binary ULIRG whose southern nucleus is optically classified as a Type 2 AGN (de Grijp et al. 1987). Its XMM-Newton spectrum shows a hard power-law continuum above 2 keV (Γ = 1.3) and has an Fe line with an EW of 1.4 keV (Braito et al. 2003). It was marginally detected above 10 keV by Suzaku (Braito et al. 2009). The Suzaku data indicate that the Superantennae harbors a Compton-thick AGN with a column density of ∼3 × 1024 cm−2. Jia et al. (2012) found that the relative line strength between the 6.4 and 6.7 keV lines as seen by Chandra varied between 2001 and 2009.. 2.2.2. The Shallow Survey. 1. IRAS08572+3915 is a double-nucleus ULIRG whose northwestern nucleus is thought to host an AGN. Its optical spectrum is intermediate between a LINER and Seyfert2 (Veilleux et al. 1995, 1999a). Continuum and emission-line diagnostics from Spitzer spectra indicate that the infrared luminosity of this source is dominated by an AGN (Veilleux et al. 2009a). No significant X-ray detection of this source has been reported, but Chandra data show a detection of a few counts. Using the hardness ratio between the 0.5–2 and 2–8 keV Chandra bands and assuming a power-law spectrum with Γ = 1.8, Teng et al. (2009) estimated a 0.5–10 keV flux of ~3 ´ 10-14 erg s−1 cm−2, corresponding to a luminosity of ∼2 × 1041 erg s−1. The target was previously observed, but was not detected by Suzaku (Teng et al. 2009). 2. IRAS10565+2448 is a pair of interacting spiral galaxies, with two distinct nuclei in the optical and near-infrared (Scoville et al. 2000). The western nucleus is much brighter. The optical spectrum is that of an H II region or a LINER (Veilleux et al. 1995, 1999a). Continuum and emission-line diagnostics from Spitzer spectra indicate that the infrared luminosity of this source is dominated by star formation, not an AGN (Veilleux et al. 2009a). This source was detected by both Chandra and XMM-Newton. These spectra were typical of ULIRGs, with a power-law component as well as a MEKAL hot gas component (e.g., Teng & Veilleux 2010). In two observations, the +2 -14 erg s−1 cm−2 and 2–10 keV flux was 3.74 ´ 10 −1 −2 +1.7 14 6.7-2.8 ´ 10 erg s cm , the inferred intrinsic 2–10 keV luminosity was 1.7 ×1041 erg s−1 and 3.7 × 1041 erg s−1, the spectral index of the best-fit +0.66 +0.25 model was G = 2.140.53 and 1.41-0.23 , and the kT +0.17 0.68MEKAL temperature was and 0.12 keV +0.14 0.68-0.07 keV (Teng & Veilleux 2010). 3. IRAS13120–5453 has a morphology that is classified as “single or obscured nucleus with long prominent tails” by Haan et al. (2011). Its optical spectral classification is Seyfert 2 (Véron-Cetty & Véron 2010). This source was detected by Chandra (Iwasawa et al. 2011) and has extended soft X-ray emission. The observed 2–7 keV band flux is 1.4 × 10⁻¹³ erg s−1 cm−2 and the 2–10 keV X-ray luminosity assuming no extinction other than 4.
(5) The Astrophysical Journal, 814:56 (16pp), 2015 November 20. Teng et al.. −1. Galactic is 4.5 × 10 erg s . The 3–7 keV spectrum is +1.5 fit by a power law of G = 2.60.9 , and the 0.4–2 keV data 0.26 are fit with a MEKAL component of kT = 0.82+ 0.14 keV (Iwasawa et al. 2011). 4. IRAS14378–3651 shows a single nucleus (Bushouse et al. 2002) in optical and near-infrared Hubble Space Telescope images. It is optically classified as a LINER (Kim et al. 1998). This source was detected by Chandra with 40 counts in 14 ks (Iwasawa et al. 2011). The observed 2–7 keV band flux is 2.1 × 10⁻¹⁴ erg s−1 cm−2 and the 2–10 keV X-ray luminosity assuming no extinction other than Galactic is 3.4 × 1041 erg s−1. Its hardness ratio implies a highly absorbed spectrum with Γ∼0.35. 41. source region was used to extract the source spectrum. The background spectrum was extracted using a region of the same size in a nearby source-free area. The spectrum was binned to at least 15 counts per bin so that χ2 statistics can be applied. 3.2. NuSTAR Observations The NuSTAR observations were reduced using the NuSTAR Data Analysis Software (NuSTARDAS) that is part of HEASoft version 6.15.1, with NuSTAR calibration database version 20131223. The script nupipeline was used to produce calibrated event files for each of the two focal plane modules (FPMA and FPMB; Harrison et al. 2013). The good time intervals of these events are listed in Table 1. All spectra were binned such that χ2 statistics can be used. The E<20 keV NuSTAR background is spatially nonuniform over FPMA and FPMB, as a result of stray light being incompletely blocked by the aperture stop. To correct for this aperture background and the instrumental background, we followed the procedure in Wik et al. (2014) to create simulated total background events for each source. The simulated backgrounds were scaled for exposure time, size of the extraction region, and the response of individual chips for each observation. The simulated backgrounds were used to create background-subtracted images for photometry in Section 4 and background spectra for the spectral analysis of the faint sources (IRAS 13120–5453, the Superantennae, and Arp 220) in Section 5. We conservatively estimate that the broadband systematic uncertainties in the derived background spectra are 5%. With the exception of Mrk273, source spectra were extracted using circular apertures with 1′ radii. For Mrk273, due to the projected vicinity of a background source (Mrk 273X; Xia et al. 2002), the source spectrum was extracted using a circle with 0 8 radius. Spectral analysis was performed using HEASoft version 6.15.1. For objects with multiple observations, the spectra were co-added using the FTOOL addascaspec. When modeling the spectra, an additional constant factor, typically of the order of a few per cent, is applied to account for the cross-normalization between FPMA and FPMB, and between FPMA and XMM-Newton EPIC-pn. These cross-normalization constants were allowed to vary for IRAS05189–252 and Mrk273 since these are the brightest sources, where more degrees of fit are possible; for the fainter IRAS13120–5453, Arp220, and the Superantennae they were held fixed. The cross-normalization values used were current at the time of the modeling. Subsequently, cross-normalization values have been published by Madsen et al. (2015) in the NuSTAR calibration paper. The values we used differ by only a few per cent from those of Madsen et al. (2015), and the difference has negligible impact on our results. We assumed the abundances of Wilms et al. (2000) and the photoelectric cross sections of Verner et al. (1996) in our spectral modeling with XSPEC. The assumed column densities due to Galactic absorption (NH,Gal ) are given in Table 1. All errors quoted in this paper are at the 90% confidence level (Δχ2 = 2.706 for a single parameter).. 3. OBSERVATIONS AND DATA REDUCTION The targets in our sample were observed by NuSTAR between 2012 August and 2013 November. NuSTAR observed the Deep Survey targets for a total of 50–100 ks per target over one or more epochs. These objects were also observed with Chandra (Mrk 231; Teng et al. 2014) or XMM-Newton (IRAS 05189–2524, Mrk 273, Arp 220, and Superantennae) to constrain their low-energy properties and check for spectral variability. The observations were designed such that one NuSTAR epoch for each target was simultaneous with its observation by XMM-Newton (PI: Teng). IRAS05189–2524, Arp220, and the Superantennae were observed for 33 ks by XMM-Newton. Due to visibility constraints, the total XMMNewton exposure on Mrk273 was only 24 ks. Table 1 lists the exposure times and dates for these NuSTAR and XMM-Newton observations. 3.1. Low-energy Coverage The XMM-Newton data were obtained using the EPIC array in full window imaging mode. For these observations, the medium optical blocking filter was applied. The data were reduced using XMM-Newton Science analysis Software version 13.5.0. The most up-to-date calibration files, as of 2014 May, were used for the reduction. We followed the XMM-Newton ABC guide23 to extract images and spectra for our Deep Survey targets. In particular, during the data reduction process, portions of data with high background flares were removed. The Mrk 273 data were highly affected by these flares; thus, the calibrated data only contain ∼17% of the original total exposure. All of the Deep Survey targets appear to be point sources. In order to ensure that we are probing the same spatial scale as the NuSTAR data, we used the same source extraction regions as NuSTAR data (see below). The background spectra are extracted from nearby source-free areas on the same chip using extraction regions of the same size. The extracted spectra were binned to 15–50 counts per bin, depending on the source count rate, such that χ2 statistics may be used. For IRAS13120–5453, archived Chandra data were used to extract a low-energy X-ray spectrum (PI: Sanders). These data were reduced using CIAO 4.5 with CALDB version 4.5.6. The standard calibration procedures were followed for reducing ACIS-S data in VFAINT mode using the chandra_repro script.24 As with the XMM-Newton data, the same NuSTAR 23 24. 4. NuSTAR PHOTOMETRIC RESULTS For each FPM, we created total, background, and background-subtracted images in four bands: 3–10, 10–20, 20–30, and 30–79 keV. These images were produced using the. http://heasarc.gsfc.nasa.gov/docs/xmm/abc/ http://cxc.harvard.edu/ciao/ahelp/chandra_repro.html. 5.
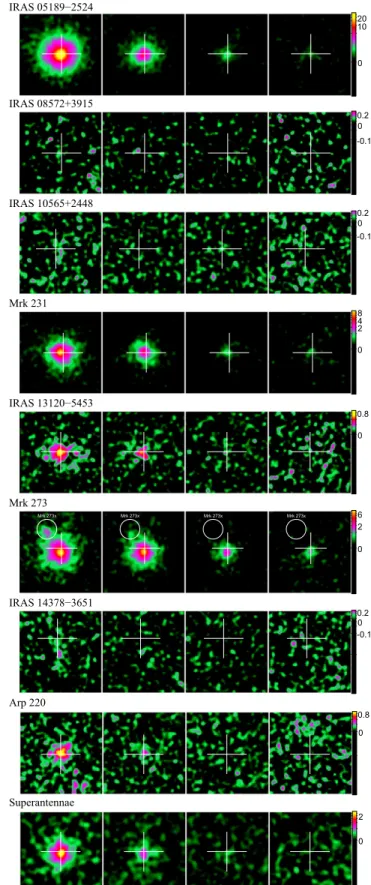
(6) The Astrophysical Journal, 814:56 (16pp), 2015 November 20. Teng et al.. nuskybgd code designed to simulate the total background (Wik et al. 2014). The nuskybkg code takes into account the telescope response and the energy dependence of the background when producing the background images. To improve photon statistics, we co-added the images from the two FPMs and all epochs if multiple observations exist. In Figure 1, we show image stamps of our co-added background-subtracted images. Using the same circular regions as the spectral extraction regions, we determined the total, background, and background-subtracted (net) counts in our images. These values are tabulated in Table 2. Two of our targets (IRAS 08572+3915 and IRAS 10565+2448) were not detected in any of the four bands and one of the targets (IRAS 14378–3651) was detected in only the 3–10 keV band. Conservatively, we assume that sources are undetected in a given band if the net counts are less than three times the estimated error. The error is calculated as 2 2 2 s = N + B + s bkgsys where N is the counting error on the number of net counts, B is the counting error on the number of background counts, and σbkgsys is the systematic error from the background simulations. σbkgsys is assumed to be 10% of the background counts below 20 keV and 3% of the background counts above 20 keV (see Wik et al. 2014 for more details). Based on the co-added images, the three brightest of our targets were detected at energies above 30 keV: IRAS05189–2524, Mrk 273, and Mrk 231. Six of our nine targets were detected in both the 3–10 and 10–20 keV bands. Assuming a simple power-law continuum, we calculated an effective photon index (Γeff) using the nominal count ratio between the 3–10 and 10–20 keV bands. These effective photon indices are also listed in Table 2. In particular, the estimated photon index for Mrk231 is ∼1.3, approximately consistent with the ∼1.4 derived from complex spectral fitting (Teng et al. 2014). Also of note is the estimated photon index of Mrk273. With Γeff∼0.7, Mrk273 is the only source with a hard spectrum among our detected targets, perhaps implying heavy obscuration. 5. BROADBAND X-RAY SPECTROSCOPIC RESULTS The modeling of the broadband (0.5–30 keV) X-ray spectrum of Mrk231 revealed a surprising result: the AGN in Mrk231 appears to be intrinsically X-ray weak and Compton-thin rather than Compton-thick (Teng et al. 2014). Following the success of the Mrk231 results, we fit the contemporaneous broadband spectrum for the deep survey sources. For IRAS13120–5453, the only shallow survey object with a NuSTAR spectrum, we use archival Chandra data to anchor the low-energy portion of the spectrum. Teng et al. (2014) demonstrated the importance of constraining both the starburst and AGN contributions to the X-ray spectrum. To model the starburst contribution, we include both the thermal and non-thermal components. The thermal component is represented by one or two MEKAL components and the non-thermal component is a cutoff power law with Γ fixed at 1.1 and a cutoff energy of 10 keV. Unless stated otherwise in the text for each source, the normalizations of these two components are held fixed so that their luminosities are consistent with the relations of Mineo et al. (2012a, 2012b) based on the target’s star formation rate (SFR). For the AGN contribution, we use power-law-based models to. Figure 1. NuSTAR background-subtracted images of each target in the (from left to right) 3–10, 10–20, 20–30, and 30–79 keV energy bands. After background subtraction, the FPMA and FPMB data were added together to improve the signal-to-noise ratio. In the cases where there are multiple exposures, all the exposures were also added together. Each image is 2′ on a side and smoothed with 4-pixel Gaussians. A 2′ wide white cross is centered on the NED position of each target, with the exception of Mrk273 whose cross is 1 6. The position of the background source, Mrk273X, is identified by a circle in the images of Mrk273. The color scale is log counts.. 6.
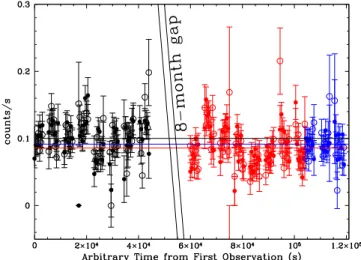
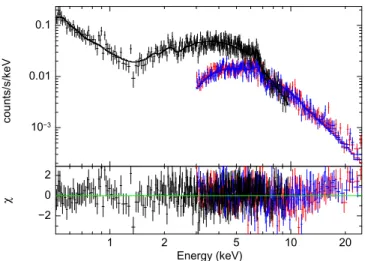
(7) The Astrophysical Journal, 814:56 (16pp), 2015 November 20. Teng et al.. Table 2 NuSTAR Photometry Resultsa Source (1) IRAS 05189–2524 IRAS 08572+3915 IRAS 10565+2448 Mrk 231 IRAS 13120–5453 Mrk 273 IRAS 14378–3651 Arp 220 Superantennae. 3–10 keV (2). NBR (3). 10–20 keV (4). NBR (5). 20–30 keV (6). NBR (7). 30–79 keV (8). NBR (9). Γeff (10). 8348.6±94.5 (14.7 ± 12.1) (17.7 ± 14.2) 2251.7±50.8 234.8±19.7 2102.7±50.2 53.2±14.1 265.0±24.9 762.5±35.8. 15.7 K K 7.6 1.7 5.6 0.4 0.8 1.6. 1870.1±46.3 (5.5 ± 9.2) (0.4 ± 9.2) 993.1±34.3 107.1±13.8 1610.5±42.2 (10.1 ± 9.6) 69.8±16.5 223.0±22.4. 7.4 K K 5.9 1.4 10.4 K 0.4 0.9. 360.9±24.3 (0.1 ± 9.4) (0.7 ± 9.4) 223.7±20.9 (30.9 ± 10.9) 473.6±24.8 (–8.4 ± 9.7) (7.5 ± 14.9) (38.6 ± 17.9). 1.6 K K 1.1 K 3.4 K K K. 169.7±27.4 (–15.1 ± 15.6) (–10.7 ± 15.7) 158.9±27.7 (24.1 ± 16.5) 222.5±24.8 (5.1 ± 15.4) (1.7 ± 24.8) (–0.8 ± 28.1). 0.3 K K 0.3 K 0.6 K K K. 1.9 K K 1.3 1.3 0.7 K 1.8 1.7. Notes. Col. (1): source name. Col. (2): net counts in the 3–10 keV band. Col. (3): net-to-background counts ratio in the 3–10 keV band. Col. (4): net counts in the 10–20 keV band. Col. (5): net-to-background counts ratio in the 10–20 keV band. Col. (6): net counts in the 20–30 keV band. Col. (7): net-to-background counts ratio in the 20–30 keV band. Col. (8): net counts in the 30–79 keV band. Col. (9): net-to-background counts ratio in the 30–79 keV band. Col. (10): effective photon index calculated using the 3–10 and 10–20 keV counts ratio by assuming a simple power law. a Values in parentheses indicate non-detections, but are included here for completeness. Since the backgrounds are simulated, we conservatively assume that sources are undetected in a given band if the net counts are less than three times the error. The errors are calculated as s = N 2 + B 2 + s 2bkgsys where N is the counting error on the number of net counts derived by subtracting the simulated background counts from the detected source counts in the same extraction region, B is the counting error on the number of simulated background counts, and σbkgsys is the systematic error from the background simulations. σbkgsys is assumed to be 10% of the background counts below 20 keV and 3% of the background counts above 20 keV (see Wik et al. 2014 for more details).. estimate the AGN luminosity. These include an absorbed power law, the AGN torus models MYTorus (Murphy & Yaqoob 2009) and BNTorus (Brightman & Nandra 2011), and reflection models. When appropriate, we also include Gaussian emission lines. The best-fit model parameters and results for the Deep Survey ULIRGs are tabulated in Table 3. 5.1. IRAS 05189–2524 IRAS05189–2524 is the X-ray brightest ULIRG in our sample. Observed in two NuSTAR pointings separated by about eight months, the second of which was divided into two data sets, IRAS05189–2524 has shown minor variability between these epochs. In Figure 2, we show the light curve for our NuSTAR observations. The average count rate in the second and third observations changed by ∼20% relative to the average count rate (∼0.1 counts per second) in the first observation. However, we note that this variation is smaller than the standard deviation (∼0.03 counts per second or ∼30%) derived when data points from all three observations are combined. Therefore, the variability is not statistically significant. Emission lines at 6.4 and 6.8 keV were detected, with a Δχ2 of 65 for four degrees of freedom. Although the light curve shows apparent minor variability, there is no obvious variation in the spectral shape between NuSTAR observations. In particular, we do not see the drop in the 2–10 keV emission measured by Teng et al. (2009) from their Suzaku data; the source appears to have reverted back to its previous “high” state. Therefore, we combined the spectra from all three NuSTAR data sets for our broadband modeling. Modeling multiple epochs of historic X-ray data, Teng et al. (2009) found that the best-fit model to explain the sudden change in spectral shape is an increase in the line-of-sight column from two partial covering absorbers. Following this result, we fit the XMM-Newton plus NuSTAR broadband spectrum with a double partial covering model for the AGN component. Following the best-fit model for Mrk231 in Teng et al. (2014), we also included a MEKAL and a cutoff power law (Γ = 1.1 with cutoff energy at 10 keV) for the non-thermal emission from high-mass X-ray binaries (HMXBs) to account. Figure 2. Background-subtracted NuSTAR 3–10 keV light curve of IRAS05189–2524. The solid points are data from FPMA and the open points are data from FPMB. Each data point represents a 500 s temporal bin. The data from the first, second, and third observations are represented in black, red, and blue, respectively. The colored lines show the average count rate for each observation. There is a ∼20% decrease in the average count rate from the first to the second pointing.. for the ∼80Me yr−1 starburst, estimated from the infrared luminosity. The photon index for the AGN, Γ = 2.51±0.02, is very steep, but is not far from the top of the range (e.g., 1.5<Γ<2.2; Nandra & Pounds 1994; Reeves & Turner 2000) observed in other AGNs. The two partial covering absorbers have NH of 5.2±0.2 × 1022 cm−2 and −2 +1.0 +1.2 22 9.3with 98±0.2% and 740.7 ´ 10 cm 1.6 % covering 2 fractions, respectively. This model is shown (cn ~ 1.07), along with the spectrum, in Figure 3. The derived Γ is steeper than Γeff estimated from the photometry because the Γeff calculation did not account for the flat power-law contribution from the HMXBs (ΓHMXB = 1.1). Given the high 2–10 keV flux levels, we do not expect this source to be highly obscured. Both the MYTorus and BNTorus 7.
(8) The Astrophysical Journal, 814:56 (16pp), 2015 November 20. Teng et al.. than the predictions of the MEKAL plasma model, if they are starburst in origin then a more complex starburst model is needed, for example with multiple temperatures, or highly nonsolar abundances. To constrain the intrinsic absorption of the AGN continuum, we added an absorption component and fixed Γ at the canonical value of 1.8. This new model requires that the intrinsic absorber have a column density of ∼4 × 1024 cm−2, implying the AGN is Compton-thick. For both torus models, we fixed the torus inclination angle at 85°, since the optical data suggest the AGN is Type2. Since we do not have an independent measure of the SFR in IRAS13120–5453 as we did for Mrk231 and IRAS05189–2524, we allowed the hot gas temperature and the normalizations of the HMXB model components to vary. We also included Gaussian components to model the lines at 1.9, 3.4, and 6.8 keV. The MYTorus model seems to fit the spectrum well (cn2 ~ 0.80 ); however, the model cannot constrain the error of Γ within the bounds of the MYTorus model (1.4<Γ<2.5). For the best-fit model, we fixed Γ at 1.8, −2 +1.2 24 resulting in a column density of 3.11.3 ´ 10 cm , consistent with the assertion by Iwasawa et al. (2011) that IRAS13120–5453 is Compton-thick based on the strength of the Fe line. The 2–10 keV absorption-corrected luminosity for IRAS13120–5453 is 1.25 × 1043 erg s−1. The starburst −2 +14.3 21 component is absorbed by a column of 5.65.6 ´ 10 cm . +0.16 The thermal component has a temperature of 0.56-0.31 keV and a 0.5–2 keV luminosity of 1.8 ´ 10 41 erg s−1. The non-thermal HMXB component has a 0.5–8 keV luminosity of 4.5 × 1041 erg s−1. The luminosities of both the thermal and non-thermal components are consistent with a SFR of ∼170Me yr−1, based on the relations of Mineo et al. (2012a, 2012b). Although high, this SFR is within the range observed for ULIRGs. For comparison, Mrk231 has a SFR of ∼140Me yr−1 (Rupke & Veilleux 2011). The absorptioncorrected 2–10 keV luminosity of IRAS13120–5454 is ∼0.67% of its AGN bolometric luminosity. The best-fit MYTorus spectrum is shown in Figure 4. Given the data quality, the BNTorus model places poor constraints on the torus opening angle and Γ. However, the values for the column density, intrinsic X-ray luminosity, and the starburst components are consistent with the results from MYTorus.. Figure 3. Best-fit model of two partial covering absorbers displayed with the IRAS05189–2524 data. The XMM-Newton data are displayed in black (binned to at least 25 counts per bin) while the co-added NuSTAR data are displayed in red (FPMA) and blue (FPMB; binned to 4σ). The modeling implies that IRAS05189–2524 hosts a luminous Compton-thin AGN.. models poorly describe the broadband spectrum (cn2 ~ 1.8 for both). From our modeling, we find that the AGN in IRAS05189–2524 is currently in a Compton-thin state. Its intrinsic 2–10 keV luminosity is 3.7 ´ 10 43 erg s−1, about 0.8% of the bolometric luminosity. Our present result is consistent with those from the multiple-epoch fitting by Teng et al. (2009). The large drop in the observed 2–10 keV flux in the 2006 Suzaku X-ray Imaging Spectrometer (XIS) data is likely due to an intervening absorber, since a change by a factor of 30 in intrinsic flux is rare in AGNs (Gibson & Brandt 2012). The incomplete nature of the time series data makes it impossible to precisely determine the timescale of variability. If it is of the order of years, as is consistent with the data, then the Compton-thick absorber responsible for the Suzaku variability must be within a few parsecs of the nucleus. However, a more extreme case of intrinsic variability (a factor of ∼260) was observed in the narrow-line Seyfert 1 galaxy PHL1092 (Miniutti et al. 2012) so we cannot absolutely rule out the possibility of strongly varying intrinsic flux. Indeed, our best-fit model, even in the high state, should not have been detectable by Suzaku PIN in the 2006 observation, which speaks to the much greater sensitivity above 10 keV of NuSTAR compared to Suzaku PIN.. 5.3. Mrk 273 Mrk273 is the only source in a past Suzaku survey of ULIRGs that was detected above 10 keV (Teng et al. 2009) by PIN. With only a marginal detection (1.8σ), the Suzaku data required a double partial covering model and implied that at least one of the partial covering absorbers is Compton-thick (NH∼1.6 × 1024 cm−2). A variability analysis using the Suzaku and historic X-ray data suggests that the variations in spectral shape between 2 and 10 keV are due to changes in the column density or the fraction of the partial covering. Mrk273 is well detected by NuSTAR up to ∼30 keV, above which the background dominates. The MYTorus and BNTorus models fit the data nearly equally well. As with the Mrk231 analysis (Teng et al. 2014), we included model components that account for HMXB and thermal emission for a starburst that is forming stars at a rate of ∼160Me yr−1 (Veilleux et al. 2009a). With the torus inclination angle fixed at 85°, the best-fit MYTorus model (cn2 = 0.91) suggests that the direct intrinsic AGN emission (or the zeroth order emission) has. 5.2. IRAS 13120–5453 We first fit the broadband spectrum of IRAS13120–5453 with a simple power law modified only by Galactic absorption and a MEKAL model for the starburst component. Because of the relatively high Galactic column density (NH, 21 −2 Gal∼4.6 × 10 cm ), it is difficult for the MEKAL model to constrain the line components below 2 keV. The best-fit power law requires Γ ∼−2 to fit the shape of the >2 keV spectrum, implying a highly obscured AGN continuum. Additionally, the spectrum shows three strong emission lines at 1.86, 3.40, and 6.78 keV which correspond to Si XIII, Ar XVIII, and Fe XXV, respectively. The Δχ2 for the iron line is 8.35 for two degrees of freedom. The strong lines of the α-elements Si (EW∼0.20 keV) and Ar (EW∼0.53 keV) may be an indication of a strong starburst. Since the lines are stronger 8.
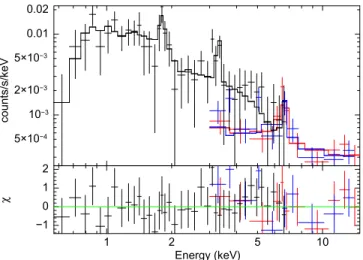
(9) The Astrophysical Journal, 814:56 (16pp), 2015 November 20. Teng et al.. Figure 5. Mrk273 broadband data modeled using the MYTorus model. The XMM-Newton EPIC-pn data are shown in black (binned to at least 15 counts per bin) while the simultaneous NuSTAR data are shown in red (FPMA) and blue (FPMB). The source is well detected by NuSTAR, the data from which were binned to 4σ.. Figure 4. Best-fit model with MYTorus components to the IRAS13120–5453 data. The Chandra data from 2006 binned to at least 15 counts per bin are displayed in black while the 2014 NuSTAR data binned to 3σ are displayed in red (FPMA) and blue (FPMB). The modeling is consistent with IRAS13120–5453 hosting a Compton-thick AGN.. Fabian 2005) is well fit to the broadband data (cn2 ~ 1.25). All model parameters are consistent with those derived from the Suzaku XIS data alone. To better model the shape of the spectrum below 2 keV, we added a second MEKAL compo+0.02 nent. The best-fit hot gas temperatures are 0.100.10 and +0.20 0.50-0.25 keV. Both these temperatures are consistent with those observed in ULIRGs (e.g., Franceschini et al. 2003; Ptak et al. 2003; Teng et al. 2005, 2009; Teng & Veilleux 2010). +0.22 The underlying reflected power law has G = 1.760.32 , 3 assuming the input ionization parameter ξ is 10 ergcms−1. The reflected 2–10 keV luminosity is ∼9.0 × 1040 erg s−1. As the detailed modeling of Mrk231 by Teng et al. (2014) has shown, it is important to constrain the HMXB component that also contributes to the X-ray spectrum. When an HMXB component (SFR = 200 Me yr−1 assuming the starburst infrared luminosity derived by Veilleux et al. 2009a) is added to the model, the reflection component is no longer required. We attempted to use the BNTorus model to constrain the properties of the obscuring torus. However, due to the poor photon statistics above 10 keV, the model does a poor job in deriving robust values and errors for parameters that characterize the torus. The model suggests a line-of-sight column density of at least 5.3 ´ 10 24 cm−2 with the best-fit value tending toward >10 25 cm−2. Similarly, the MYTorus model has difficulty constraining the properties of the torus. Using this model, the column density is at least 1.2 × 1024 cm−2, with the nominal value hitting the upper bound of the model at 1025 cm−2. In this case, it is not possible to measure the intrinsic X-ray luminosity of the AGN. Therefore, if an AGN is present in Arp220, it is highly Compton-thick and the NH cannot be constrained with the NuSTAR >10 keV data. This result is consistent with measurements by two groups that find that the western nucleus of Arp220 is embedded in a column of 1.3 × 1025 cm−2 (Downes & Eckart 2007) to 1.5 × 1025 cm−2 (Scoville et al. 2014). It is possible that the observed X-ray spectrum of Arp220 does not have an AGN component at all. If the column density is >10 25 cm−2, then no direct emission can be detected if the absorber is not “leaky.” What the observed global X-ray spectrum represents is simply the thermal and non-thermal emission from the major starburst. Therefore, we also modeled. 23 −2 +0.17 G = 1.430.03 , and the global NH is (4.4±0.1) × 10 cm . +2.4 The leaky fraction of the absorber is only 3.11.8 %. This best-fit model and the data are shown in Figure 5. The BNTorus model gives similar results (cn2 = 0.90 ). With the torus inclination angle fixed at 87°, Γ is constrained to be −2 +0.20 +1.1 23 1.290.17 and the line-of-sight NH is 3.5-0.8 ´ 10 cm . The opening angle of the torus is at least ∼43°. The BNTorus +4.3 model infers a leaky fraction of 4.52.7 %. These parameters are consistent with those derived using the MYTorus model. Teng et al. (2009) concluded that the spectral variability seen in Mrk273 was due to changes in the column density. By fitting the multiple-epoch data together and assuming a common model, they showed that the older measurements of the column density with Chandra and XMM-Newton were a factor of 2–4 lower than the Suzaku measurement. Our NuSTAR analysis is consistent with this result, as the column density we derived using the torus models is a factor of ∼4 lower than the Suzaku measurement. Similar to our Mrk231 results (Teng et al. 2014), the torus models favor a relatively flat power-law intrinsic photon index for an AGN. The intrinsic 2–10 keV luminosity of Mrk273 is ∼8.6 ´ 10 42 erg s−1, representing ∼0.3% of the AGN bolometric luminosity.. 5.4. Arp 220 Although it is the nearest ULIRG, Arp220 is the faintest source at NuSTAR energies in our Deep Survey. This source was observed by Suzaku in 2006, but was undetected above 10 keV (Teng et al. 2009). The Suzaku spectrum, with a lack of detection above 10 keV and an ionized Fe line with large EW (∼0.42 keV), suggests that the AGN is very heavily obscured. The direct emission from the AGN is completely obscured by a high column density, leaving behind a purely reflected spectrum. Since the NuSTAR flux between 15 and 40 keV is 35 times lower than the upper limit derived from the Suzaku observations, our NuSTAR observations can more tightly constrain the X-ray properties of Arp220. When modeling the new broadband X-ray spectrum, we first revisited the ionized reflection model favored by Teng et al. (2009), which did not include an HMXB component. The MEKAL plus ionized reflection model (reflionx; Ross & 9.
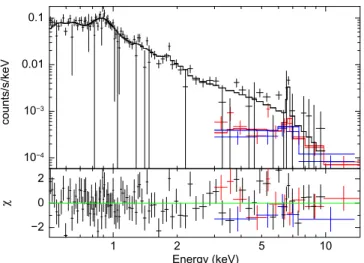
(10) The Astrophysical Journal, 814:56 (16pp), 2015 November 20. Teng et al.. Figure 7. Superantennae broadband data modeled by a single power-law AGN component as well as star formation components. The XMM-Newton EPIC-pn data, binned to at least 50 counts per bin, are shown in black while the NuSTAR data, binned to 3σ, are shown in red (FPMA) and blue (FPMB). The NuSTAR data shown are the co-added spectra of two epochs separated by about four months.. Figure 6. Arp220 broadband data modeled without an AGN component. The XMM-Newton EPIC-pn data, binned to at least 15 counts per bin, are shown in black while the simultaneous NuSTAR data, binned to 3σ, are shown in red (FPMA) and blue (FPMB). The FPMB data were of poorer quality than those of FPMA, likely due to a higher (simulated) local background. It is possible that, due to the high column density, the observed X-ray spectrum does not show any signatures of an AGN.. 5.5.1. Broadband Fitting. the Arp220 spectrum without an AGN component. The data are well fit by a two-temperature MEKAL plus a strong ionized FeK line. The iron line likely originates from the strong starburst. A strong bremsstrahlung component would be expected to accompany the 6.7 keV emission. Thus, we also included a redshifted bremsstrahlung component in the twotemperature MEKAL model. The MEKAL luminosities were fixed such that they are consistent with the SFR based on the relation of Mineo et al. (2012b). This best-fit model (cn2 = 1.22) is shown in Figure 6. To summarize, the X-ray emission from Arp220 appears to be consistent with only a starburst. However, there is the possibility that a very deeply buried AGN is present in this source.. We have applied three different models to the broadband spectrum of the Superantennae. All three include thermal and power-law components for the starburst in addition to the typical AGN component. We first tested whether a simple absorbed power law can explain the spectral shape. A point in favor of the Compton-thick AGN scenario is that the powerlaw spectrum inferred from only <10 keV data is relatively flat (Γ∼1.3; Braito et al. 2003). With the broader energy coverage of the XMM-Newton plus NuSTAR data, we find that the spectrum, after accounting for the starburst contribution, can be well fit with a standard power-law model for the AGN component (cn2 = 1.30 ). The best-fit result requires only Galactic absorption and Γ of 1.54±0.13, consistent with that measured from typical AGNs. We do not detect the presence of a strong neutral Fe line. The apparent Fe emission can be described by two narrow Gaussians with central energies at +0.16 +0.37 +370 6.540.07 and 6.87-0.10 keV. These lines have EWs of 288-94 +521 and 296-163 eV, respectively. This fit is shown in Figure 7. For completeness, we also applied the torus models to the spectrum to test whether the AGN can also be Compton-thick as suggested by Braito et al. (2009). Both the MYTorus and BNTorus models give similar parameter values; however, the BNTorus models cannot constrain the opening angle of the torus. The MYTorus model fits the data very well (cn2 = 1.27). The best-fit model implies that the underlying nuclear +0.17 spectrum, with G = 1.540.14 , is obscured by a column of −2 +5.8 24 NH = 4.2-3.1 ´ 10 cm . A nominally small fraction, +87 139 %, of the direct emission is leaked through the absorber, but the large error bars clearly indicate a poorly constrained parameter. The Compton-thin and Compton-thick models are statistically equivalent. Although technically the Compton-thick model has a smaller reduced χ2, it is a more complicated model that does a poor job of constraining the leaked emission component. If the leaked fraction parameter is left completely free, the parameter errors reach an unphysical value. If the leaked component is removed, MYTorus cannot account for most of the 3–9 keV emission in the spectrum. Therefore, we. 5.5. The Superantennae Braito et al. (2009) reported that the Superantennae was detected by Suzaku PIN above 10 keV. Although Braito et al. (2009) claim a signal-to-noise ratio of ∼10 in their 15–30 keV detection, the source spectrum is only ∼5.5% above the PIN background, which has a systematic uncertainty of ∼1.5%. They describe the source as a Compton-thick AGN (NH ∼3–4 × 1024 cm−2) shining with an intrinsic 2–10 keV luminosity of a few times 1044ergs−1, at the level of a luminous quasar. This galaxy was observed twice by NuSTAR, with a temporal separation of about four months. In both epochs, the Superantennae is weakly detected, with a 15–30 keV flux that is 30 times lower than that measured by Braito et al. (2009) with Suzaku. There appears to be no significant variability between the two sets of observations in terms of the spectral shape or the strengths of the Fe lines. Due to the lack of discernable variability, we have co-added the two sets of NuSTAR spectra in order to improve the signal-tonoise ratio of the overall spectrum. Emission lines at 6.5 and 6.9 keV were detected with Δχ2 = 30 for four degrees of freedom. 10.
(11) The Astrophysical Journal, 814:56 (16pp), 2015 November 20. Teng et al.. favor the Compton-thin interpretation of the Superantennae spectrum. With this model, the intrinsic 2–10 keV luminosity of the AGN is 1.7 × 1042 erg s−1, several hundred times lower than that reported by Braito et al. (2009). The 2–10 keV to bolometric luminosity ratio for this AGN is 0.08%. In these models, the 15–30 keV flux for the Superantennae is ∼1.7 × 10⁻¹³ ergs−1 cm−2, a factor of 30 lower than the flux measured in this band by Braito et al. (2009) with Suzaku. There does not appear to have been any notable variability below 10 keV for the Superantennae. Braito et al. (2009) noted two other sources within the Suzaku PIN non-imaging field of view that are also AGNs and have similar fluxes to the Superantennae. While they used XMM-Newton data to constrain the spectral properties of these background sources and concluded that they can be described by unabsorbed power laws, it is possible that their contributions above 10 keV were not fully accounted for. Other field sources could also have contaminated the Suzaku >10 keV measurement. These include a field source within the NuSTAR field of view in the first observation of the Superantennae. The field source is a point source ∼8 5 from the Superantennae (R.A.: 19:32:48.3, decl.: –72:33:52.0). Although fainter than the Superantennae, the count rate of this source is 36% and 45% of those of the Superantennae in the 3–10 keV and 10–20 keV bands, respectively. These numbers suggest that the field source can harden the apparent 15–30 keV Suzaku PIN spectrum of the Superantennae at >10 keV, leading to the previous conclusion that the source is Compton-thick. There may be other field sources within the Suzaku field of view that are outside the NuSTAR field of view with similar properties. Therefore, we conclude that the Suzaku data were contaminated and that the Superantennae most likely hosts a Compton-thin AGN.. grown stronger in 2013. Therefore, the relative strengths of these lines have changed between 2001 and 2013. It is unclear what caused the iron line EWs to change and the 6.4 keV line to disappear within a decade. One possibility is a change in the ionization state of the accretion disk from which the line emission arises. The variability of the iron lines supports the conclusions of Jia et al. (2012) that the lines must come from a compact region like the central engine. 5.6. The Undetected Sources: IRAS 08572+3915, IRAS 10565+2448, IRAS 14378–3651 IRAS 08572+3915, IRAS 10565+2448, and IRAS 14378 −3651 were undetected by NuSTAR in 25 ks. Given the NuSTAR sensitivity limits, this implies that the intrinsic 2–10 keV luminosities of these sources are below ∼5 × 1042 erg s−1 for the typical redshifts of our sources of ∼0.05, assuming the standard canonical AGN power-law model. Otherwise, the strong X-ray continua of these sources would have been detected above 10 keV. Using the observed count rates from our NuSTAR observations at the locations of our targets, we determined upper limits to the observed 2–10 keV luminosities of these sources, under the assumption that the obscuring column density is not high. In the derivation, we assumed only a power-law component with Γ = 1.8 and Galactic absorption. No additional column density was assumed. Using the 3–10 keV count rates for each source, we used WebPIMMS25 to estimate the unabsorbed 2–10 keV luminosity. The total 3–10 keV count rates extracted from circular regions with 1′ radii for IRAS 08572+3915, IRAS 10565+2448, and IRAS 14378−3651 are 3 × 10⁻³, 2 × 10⁻³, and 3 × 10⁻³ counts per second, respectively. Assuming no intrinsic obscuration, these rates correspond to upper limits to the 2–10 keV luminosity of ∼6 × 1041 and 7 × 1041 erg s−1 for IRAS 08572+3915 and IRAS 10565 +2448, respectively, and an intrinsic 2–10 keV luminosity of 1 × 1042 erg s−1 for IRAS 14378–3651. These limits and measurement are consistent with those previously measured by Chandra (e.g., Teng et al. 2009; Teng & Veilleux 2010; Iwasawa et al. 2011), and suggest that the intrinsic 2–10 keV to bolometric luminosity ratios in these sources are 0.01, 0.09, and 0.08%, respectively, assuming no source obscuration. However, as we saw in the case of Arp220 (Section 5.4), it is not possible to rule out very high obscuring column densities.. 5.5.2. Iron Line Variability. Jia et al. (2012) studied the Fe emission lines between 6 and 7 keV in the Superantennae in X-ray observations spanning eight years (2001–2009). They found that the 6.4, 6.7, and 6.9 keV lines varied in the three observations taken in this period. In 2001, XMM-Newton detected emission lines with central energies consistent with the 6.4 and 6.9 keV lines, but in subsequent Suzaku XIS (2006) and Chandra (2009) observations, only the 6.7 keV line was significantly detected. Furthermore, the EW of the 6.7 keV line varied over the three observations. In our broadband fitting above, we found two narrow Gaussians with energies consistent with the 6.7 and 6.9 keV lines. These lines have approximately the same EW. We examined the Fe line complex in our 2013 XMM-Newton data in more detail. By using the unbinned spectrum with the Cash statistic in XSPEC, we see signatures of the 6.7 and 6.9 keV lines. There is also a hint of the 6.4 keV emission line that is not statistically significant. We then compared the 2013 data with those taken by XMMNewton in 2001. We did not use the Suzaku or the Chandra data in this study since those two telescopes have different responses in the relevant energy range and we want to limit the variables in our comparison. Using the most up-to-date calibration, we reanalyzed the 2001 data in the same manner as the 2013 spectrum. Although the 2001 data were shallower, it is clear that the 6.4 keV line was stronger in 2001 than in 2013 (using the same continuum model as for 2013). The 6.7 keV line has appeared since 2001 and the 6.9 keV line has. 6. THE CONTRIBUTION OF AGN POWER TO ULIRGs 6.1. The Hard X-Ray Perspective For several decades, what powers the enormous infrared luminosities of ULIRGs has remained an unanswered question. Many studies concluded that the lack of strong X-ray detections in ULIRGs implied that these sources are highly obscured (e.g., Franceschini et al. 2003; Ptak et al. 2003; Teng et al. 2005; Iwasawa et al. 2011). However, these studies lacked sensitive detections at energies above 10 keV, which are necessary to disentangle the effects of obscuration in order to robustly measure the intrinsic X-ray luminosities of the AGNs in ULIRGs. With the launch of NuSTAR, which is ∼100 times more sensitive than Suzaku PIN in the 10–40 keV energy band, broadband (0.5–30 keV) X-ray spectroscopy has allowed us to estimate the intrinsic X-ray luminosity of five of the nine 25. 11. https://heasarc.gsfc.nasa.gov/cgi-bin/Tools/w3pimms/w3pimms.pl.
(12) The Astrophysical Journal, 814:56 (16pp), 2015 November 20. Teng et al.. Table 3 Best-fit Parameters for the ULIRGs in the Deep Survey Model Parameter (1). IRAS 05189–2524 (2). IRAS 13120–5453 (3). Mrk273 (4). Arp220 (5). Superantennae (6). B/A XMM/A or CXO/A. +0.03 1.020.03 +0.02 0.860.02. 1.05 (f) 1.20* (f). +0.06 0.990.06 +0.15 0.880.14. 1.05 (f) 0.90 (f). 1.05 (f) 0.85 (f). kT (keV). +0.01 0.160.01. +0.05 0.560.06. +0.15 0.640.15. +0.20 0.510.17. K. +0.02 0.160.02 , +0.10 0.690.10 +3.12 9.132.04. +9.5 43.85.7 1 (f) K K K. +0.04 0.380.05 1(f) K K K. K K K K K. Brems. kT (keV) Abs. 1 (1022 cm−2) cf 1 Abs. 2 (1022 cm−2) cf 2 Abs. HMXB (1022 cm−2) ΓHMXB ΓAGN Inc (deg) Eline(keV) EWline(keV) E line 2 (keV) EWline 2 (keV) Eline 3 (keV) EWline 3 (keV) Const. (C-thin) f0.5–2 (10−13 erg s−1 cm−2) f2–10 (10−12 erg s−1 cm−2) f10–30 (10−12 erg s−1 cm−2) LMEKAL (erg s−1) LBrems (erg s−1). K +0.20 5.190.18 +0.01 0.980.01 +0.95 9.320.68 +0.01 0.740.02 >2.66. K +232.5 315.7129.4 1 (f) K K +1.32 0.580.58. K. 1.1 (f). 1.1 (f). 1.1 (f). K. 1.1 (f). +0.02 2.510.02. 1.8 (f). +0.17 1.43.... K. +0.07 1.540.07. 85 (f) K K K K K K +0.02 0.030.02 +0.11 0.980.14 +0.03 0.760.25 +0.09 2.971.40 1.47 × 1041. K +0.07 6.780.07 +0.469 0.8990.398 K K K K K +0.04 0.980.04 +0.01 0.120.01 +0.02 0.050.02 2.80 × 1041. K +0.16 6.530.11 +0.447 0.2960.107 +0.37 6.880.08 +0.538 0.3300.148 K K K +0.04 0.750.05 +0.01 0.230.01 +0.03 0.250.03 1.77 × 1041. K. 1.66 × 1040. K. K +0.05 6.430.05 +0.033 0.0740.035 +0.02 6.800.04 +0.028 0.1170.040 K K K +0.48 1.500.50 +0.11 3.870.13 +0.11 2.740.16 1.40 × 1041 K. 85 (f) +0.11 1.860.05 0.104 (uc) +0.11 3.400.06 +0.348 0.4600.279 +0.28 6.860.12 +0.674 0.8480.562 K +0.08 0.500.24 +0.30 0.26-0.33 +0.29 0.890.78 2.03 × 1041 K. LHMXB (erg s−1). 4.70 × 1041. 7.62 × 1041. 7.09 × 1041. K. 2.79 × 1041. L0 (erg s−1) L0 (2–10 keV) (erg s−1) LAGN/Lbol,AGN (%). 5.58 × 1043 3.69 × 1043 0.81. 3.15 × 1043 1.25 × 1043 0.67. 2.40 × 1043 8.55 × 1042 0.28. K K K. 4.57 × 1042 1.70 × 1042 0.08. 122.9/101. 146.22/112. χ2/dof. 714.2/666. 36.3/48. 189.5/209. Comment on Parameter (7) FPMB-A cross-normalization XMM-Newton-FPMA or Chandra (*)-FPMA cross-normalization MEKAL gas temperature from the starburst bremsstrahlung temperature from the hot gas neutral absorber 1 covering factor 1 neutral absorber 2 covering factor 2 neutral absorber applied to the HMXB power-law component HMXB cutoff power-law index with cutoff energy at 10 keV AGN power-law index (MYTorus lower limit fixed at 1.4) inclination angle line 1 EW of line 1 line 2 EW of line 2 line 3 EW of line 3 Compton-thin fraction observed 0.5–2 keV flux observed 2–10 keV flux observed 10–30 keV flux intrinsic MEKAL 0.5–30 keV luminosity intrinsic bremsstrahlung 0.5–30 keV luminosity intrinsic HMXB 0.5–30 keV luminosity intrinsic AGN 0.5–30 keV luminosity intrinsic AGN 2–10 keV luminosity 2–10 keV X-ray-to-bolometric luminosity ratio for the AGN goodness of fit. Note. (f) denotes a fixed parameter and (uc) detnotes an unconstrained parameter. Col. (1): model parameter for each fit. Col. (2): best-fit model: const. × N H,Galactic (MEKAL + Abs nuclear HMXB ´ cutoffPL nuclear HMXB + Abs1 ´ Abs 2 ´ PLAGN + Line(6.4 keV) + Line(6.7 keV)). Col. (3): best-fit model: const. × N H,Galactic (MEKAL + Abs nuclear HMXB ´ cutoffPL nuclear HMXB + Line(6.7 keV) + MYTorus × PLAGN). Col. (4): best-fit model: const. × N H,Galactic (MEKAL + cutoffPL nuclear HMXB + MYTorus × PLAGN + Const. C - thin ´ PL AGN ). Col. (5): best-fit model: const. × N H,Galactic´ Abs1 ×(MEKAL1 + MEKAL2 + zbremss + Line(6.7 keV)). Col. (6): best-fit model: const. × N H,Galactic (MEKAL + cutoffPL nuclear HMXB + Line(6.7 keV) + Line(6.9 keV) + PLAGN). Col. (7): comments on model parameter. In the second row, the Chandra-FPMA cross-normalization is marked with an asterisk; the others are for XMM-Newton-FPMA.. ULIRGs in our sample and place constraints on the remaining four. Our observations reveal that the ULIRGs in our sample have surprisingly low observed fluxes in high-energy (>10 keV) X-rays. Of the nine ULIRGs in our NuSTAR sample, six were detected well enough to enable detailed spectral modeling of their broadband X-ray spectra. Of these six, only one, IRAS13120–5453, has a spectrum consistent with a. Compton-thick AGN. We cannot rule out the possibility that a second ULIRG in the sample, Arp220, is highly Comptonthick (NH>1025 cm−2). Thus, by the strictest definition (NH>1.5 × 1024 cm−2), these NuSTAR data show that most of the ULIRGs in our sample are not Compton-thick. However, detailed analysis of the NuSTAR data on IRAS05189–2524 and Mrk273 shows that the hard X-ray fluxes of these sources have varied compared to similar Suzaku 12.
(13) The Astrophysical Journal, 814:56 (16pp), 2015 November 20. Teng et al.. Table 4 Eddington Luminosities and Ratios ULIRG. Mbh (Me). LEdd (erg s−1). λEdd. lx. Γ. (1) IRAS05189–2524 Mrk231 Mrk273. (2) 3 × 10⁷ 2 × 10⁷ 6 × 10⁸. (3) 3.6 × 1045 2.1 × 1045 6.9 × 1046. (4) 1.2 5.2 0.04. (5) 1 × 10⁻² 2 × 10⁻³ 1 × 10⁻⁴. (6) 2.51 1.39 1.43. the X-ray faintest and also accreting at a super-Eddington rate. Mrk273 has the most massive black hole and the lowest Eddington ratio. Many studies have found that Γ becomes softer with increasing λEdd (e.g., Shemmer et al. 2005, 2008; Brightman et al. 2013). Comparing the model-derived Γ of our three brightest sources with their λEdd values, this Γ–λEdd correlation appears to hold with the exception of Mrk231. More recently, Yang et al. (2014) found a correlation between Γ and the dimensionless ratio of 2–10 keV and Eddington luminosities, which holds for black hole accretion systems including both black hole binaries and AGNs. The authors found that Γ decreases with increasing lX up to ∼10−3 but steepens again above that lX value. (See also Constantin et al. 2009.) Our limited data points from three sources are consistent with this phenomenological model. If both the Γ– λEdd and Γ–lX relations are true and indicative of the accretion processes in most AGNs, then Mrk231 is an outlier. This implies that the 2–10 keV to bolometric luminosity correction is different for Mrk231 than for most AGNs, as suggested by Teng et al. (2014).. Note. Columns: (1) ULIRG with measured dynamical black hole mass and spectrally derived X-ray AGN luminosity; (2) black hole mass; (3) Eddington luminosity; (4) Eddington ratio, λEdd = Lbol,AGN/LEdd, where Lbol,AGN is estimated by multiplying column (3) by column (6) in Table 1; (5) dimensionless 2–10 keV to Eddington luminosity ratio, lx = LX/LEdd; (6) ΓAGN, copied for convenience from Table 3 or Teng et al. (2014).. observations in 2006 (Teng et al. 2009). The observed variability in both sources can be explained by a change in the absorbing column. The column densities for both IRAS05189–2524 and Mrk273 have reduced by a factor of a few since the 2006 observations. These changes are sufficient to alter the classification of these AGNs from being Comptonthick to Compton-thin. In our sample of nine ULIRGs, three (IRAS 05189–2524, Mrk 231, and Mrk 273) have strong hard X-ray continua above 10 keV after correcting for obscuration. The remaining targets have low count rates. Only two ULIRGs (IRAS 05189–2524 and IRAS 13120–5453) have intrinsic 2–10 keV AGN luminosities above 1043ergs−1. Although the AGNs in many of these ULIRGs dominate the spectral energy distributions at other wavelengths (e.g., Veilleux et al. 2009a), these active black holes do not appear to produce as much X-ray emission as would be expected for typical AGNs. When compared to their bolometric luminosities, the AGNs in our sample of ULIRGs are not emitting as much X-ray power as Seyfert galaxies. The intrinsic 2–10 keV to bolometric luminosity ratio is in the range 0.03%–0.81%. For comparison, this value ranges from 2% to 15% for radio-quiet quasars and Seyfert galaxies (Elvis et al. 1994). However, there is evidence that objects with Eddington ratios near or above unity have smaller 2–10 keV to bolometric luminosity ratios (0.3%–0.7%; Vasudevan & Fabian 2009; Lusso et al. 2010, 2012). The low 2–10 keV to bolometric luminosity ratios for our sample could imply that these sources have high accretion rates. This is unsurprising, as ULIRGs are mergers that may be rapidly growing their central black holes. The high accretion rates of ULIRGs are consistent with the detection of ionized FeK lines in five of the six ULIRGs with spectra in our sample (IRAS 05189–2524, IRAS 13120–5453, Mrk 231, Arp 220, and the Superantennae). Iwasawa et al. (2012) suggested that there is a link between the presence of ionized lines in the COSMOS sample and high accretion rate. The exception is Mrk273, which has a low accretion rate (see below). For the three sources in our sample that have both dynamically measured black hole masses (e.g., Veilleux et al. 2009b) and spectrally derived AGN fluxes, we calculated Eddington luminosities, Eddington ratios, and 2–10 keV to Eddington luminosity ratios, tabulated in Table 4. These parameters distinguish the brightest objects in our sample each into a unique category. IRAS05189–2524 is the X-ray brightest and accreting at a super-Eddington rate. Mrk231 is. 6.2. Comparison of Hard X-Ray and Infrared Perspectives In Figure 8, we compare the intrinsic 2–10 keV to bolometric luminosity ratio, also known as the X-ray bolometric correction, to the fraction of the bolometric luminosity attributed to the AGN from infrared measurements. This latter ratio, Lbol, AGN, is the average AGN fraction calculated from six independent methods that include fine-structure line ratios, mid-infrared continuum ratios, and the EWs of the aromatic features (Veilleux et al. 2009a). Included in the figure are also two lines that help guide the eye for where a pure AGN contributing 100% of the luminosity in the infrared with 1% and 10% X-ray bolometric correction would lie for a given AGN fraction. X-ray bolometric corrections of 2%–15% are typical for Seyferts and radio-quiet quasars (Elvis et al. 1994), with much lower bolometric corrections of ∼0.3%–0.7% seen for objects accreting at close to the Eddington rate (e.g., Vasudevan & Fabian 2009; Lusso et al. 2010, 2012). While two of the eight ULIRGs lie within the range of bolometric corrections that is typical for typical Seyferts, the majority appear surprisingly faint in the X-rays. Their X-ray bolometric corrections are more in line with those of objects accreting at close to the Eddington rate. This disagreement between infrared and X-ray diagnostics is particularly large for Mrk231 and IRAS08572+3915: while Spitzer diagnostics find that these two sources are heavily dominated by AGNs, both are very underluminous in the X-rays. The ratio of intrinsic 2–10 keV luminosity to bolometric luminosity for Mrk231 is only 0.03%, and the ratio for IRAS08572+3915 is even lower (assuming no intrinsic absorption). Teng et al. (2014) established that Mrk231 is intrinsically X-ray weak, likely related to the powerful wind detected in this broad absorption line (BAL) quasar. There is growing evidence emerging that some AGNs with strong outflows, such as some BAL quasars, are intrinsically X-ray weak (e.g., Luo et al. 2013, 2014; Teng et al. 2014), suggesting that intrinsic X-ray weakness and strong winds may be linked. IRAS08572+3915, known to have a strong outflow on kiloparsec scales (Rupke & Veilleux 2013), may be another example of an intrinsically X-ray weak AGN with powerful winds. In fact, IRAS08572+3915 is a 13.
Figure
+4
![Figure 9 shows that the [O IV ] relation, which was calibrated from empirical measurements of Seyfert 1 galaxies, over-predicts the intrinsic 2 –10 keV luminosity for all sources in our sample](https://thumb-us.123doks.com/thumbv2/123dok_es/7301414.447434/14.918.479.849.73.453/relation-calibrated-empirical-measurements-seyfert-galaxies-intrinsic-luminosity.webp)
Documento similar
