Measurement of distributions sensitive to the underlying event in inclusive Z boson production in pp collisions at root s=7 TeV with the ATLAS detector
51
0
0
Texto completo
(2) Noname manuscript No. (will be inserted by the editor). Measurement of distributions sensitive to the underlying event in √ inclusive Z-boson production in pp collisions at s = 7 TeV with the ATLAS detector The ATLAS Collaboration 1 CERN,. CH-1211 Geneva 23. Switzerland. Received: 12 September 2014 / Accepted: 23 November 2014. Abstract A measurement of charged-particle distributions sensitive to the properties of the underlying event is presented for an inclusive sample of events containing a Z-boson, decaying to an electron or muon pair. The measurement is based on data collected using the ATLAS detector at the LHC in proton–proton collisions at a centre-of-mass energy of 7 TeV with an integrated luminosity of 4.6 fb−1 . Distributions of the charged particle multiplicity and of the charged particle transverse momentum are measured in regions of azimuthal angle defined with respect to the Z-boson direction. The measured distributions are compared to similar distributions measured in jet events, and to the predictions of various Monte Carlo generators implementing different underlying event models. Keywords QCD · Underlying Event · Monte Carlo. 1 Introduction In order to perform precise Standard Model measurements or to search for new physics phenomena at hadron colliders, it is important to have a good understanding of not only the short-distance hard scattering process, but also of the accompanying activity – collectively termed the underlying event (UE). This includes partons not participating in the hard-scattering process (beam remnants), and additional hard scatters in the same proton-proton collision, termed multiple parton interactions (MPI). Initial and final state gluon radiation (ISR, FSR) also contribute to the UE activity. It is impossible to unambiguously separate the UE from the hard scattering process on an event-by-event basis. However, distributions can be measured that are sensitive to the properties of the UE. The soft interactions contributing to the UE cannot be calculated reliably using perturbative quantum chromodynamics (pQCD) methods, and are generally described using different phenomenological models, usually implemented in. Monte Carlo (MC) event generators. These models contain many parameters whose values and energy dependences are not known a priori. Therefore, the model parameters must be tuned to experimental data to obtain insight into the nature of soft QCD processes and to optimise the description of UE contributions for studies of hard-process physics. Measurements of distributions sensitive to the properties of the UE have been performed in proton-proton (pp) √ collisions at s = 900 GeV and 7 TeV in ATLAS [1–5], ALICE [6] and CMS [7, 8]. They have also been performed in p p̄ collisions in events with jets and in Drell-Yan events at √ CDF [9, 10] at centre-of-mass energies of s = 1.8 TeV and 1.96 TeV. This paper reports a measurement of distributions sensitive to the UE, performed with the ATLAS detector [11] at the LHC in pp collisions at a centre-of-mass energy of 7 TeV. The full dataset acquired during 2011 is used, corresponding to an integrated luminosity of 4.64 ± 0.08 fb−1 . Events with a Z-boson candidate decaying into an electron or muon pair were selected, and observables constructed from the final state charged particles (after excluding the lepton pair) were studied as a function of the transverse momentum 1 of the Z-boson candidate, pZT . This paper is organised as follows: the definitions of the underlying event observables are given in Sect. 2. The ATLAS detector is described in Sect. 3. In Sect. 4, the MC models used in this analysis are discussed. Section 5 and Sect. 6 describe the event selection, and the correction for 1 The. ATLAS reference system is a Cartesian right-handed coordinate system, with the nominal collision point at the origin. The anticlockwise beam direction defines the positive z-axis, while the positive x-axis is defined as pointing from the collision point to the center of the LHC ring and the positive y-axis points upwards. The azimuthal angle φ is measured around the beam axis, and the polar angle θ is measured with respect to the z-axis. The pseudorapidity is given by η = − ln tan(θ /2). Transverse momentum is defined relative to the beam axis..
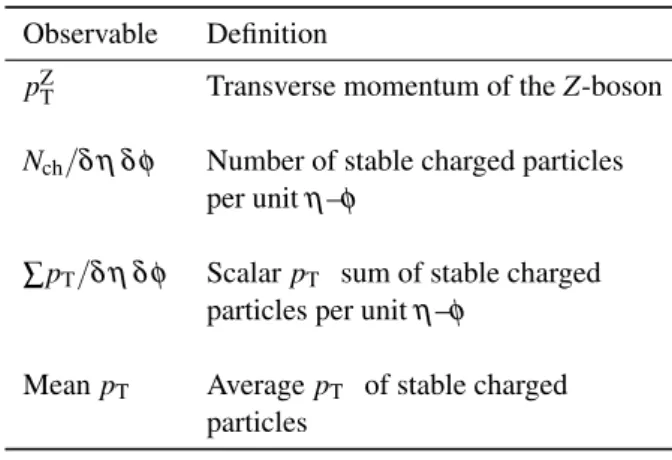
(3) 2 Z-boson. the effect of multiple proton-proton interactions in the same bunch crossing (termed pile-up). The correction of the data to the particle level, and the combination of the electron and muon channel results are described in Sect. 7. Section 8 contains the estimation of the systematic uncertainties. The results are discussed in Sect. 9 and finally the conclusions are presented in Sect. 10.. −∆ φ. ∆φ. Toward |∆ φ | < 60◦. 2 Underlying event observables Transverse 60◦ < |∆ φ | < 120◦. Since there is no final-state gluon radiation associated with a Z-boson, lepton-pair production consistent with Z-boson decays provides a cleaner final-state environment than jet production for measuring the characteristics of the underlying event in certain regions of phase space. The direction of the Z-boson candidate is used to define regions in the azimuthal plane that have different sensitivity to the UE, a concept first used in [12]. As illustrated in Fig. 1, the azimuthal angular difference between charged tracks and the Z-boson, |∆ φ | = |φ − φZ-boson |, is used to define the following three azimuthal UE regions: – |∆ φ | < 60◦ , the toward region, – 60◦ < |∆ φ | < 120◦ , the transverse region, and – |∆ φ | > 120◦ , the away region. These regions are well defined only when the measured pZT is large enough that, taking into account detector resolution, it can be used to define a direction. The away region is dominated by particles balancing the momentum of the Z-boson except at low values of pZT . The transverse region is sensitive to the underlying event, since it is by construction perpendicular to the direction of the Z-boson and hence it is expected to have a lower level of activity from the hard scattering process compared to the away region. The two opposite transverse regions may be distinguished on an event-by-event basis through their amount of activity, as measured by the sum of the charged-particle transverse momenta in each of them. The more or less-active transverse regions are then referred to as trans-max and trans-min, respectively, with the difference between them on an event-by-event basis for a given observable defined as trans-diff [13, 14]. The activity in the toward region, which is similarly unaffected by additional activity from the hard scatter, is measured in this analysis, in contrast to the underlying event analysis in dijet events [5]. The observables measured in this analysis are derived from the number, Nch , and transverse momenta, pT , of stable charged particles in each event. They have been studied both as one-dimensional distributions, inclusive in the properties of the hard process, and as profile histograms which present the dependence of the mean value of each observable (and its uncertainty) on pZT . The observables are summarised in Tab. 1. The mean charged-particle transverse momentum is. Transverse 60◦ < |∆ φ | < 120◦. Away |∆ φ | > 120◦. Fig. 1 Definition of UE regions as a function of the azimuthal angle with respect to the Z-boson.. constructed on an event-by-event basis and is then averaged over all events to calculate the observable mean pT .. Table 1 Definition of the measured observables. These are defined for each azimuthal region under consideration except for pZT .. Observable. Definition. pZT. Transverse momentum of the Z-boson. Nch /δ η δ φ. Number of stable charged particles per unit η–φ. ∑ pT /δ η δ φ. Scalar pT sum of stable charged particles per unit η–φ. Mean pT. Average pT of stable charged particles. 3 The ATLAS detector The ATLAS detector [11] covers almost the full solid angle around the collision point. The components that are relevant for this analysis are the tracking detectors, the liquid-argon.
(4) 3. (LAr) electromagnetic sampling calorimeters and the muon spectrometer. The inner tracking detector (ID) has full coverage in azimuthal angle φ and covers the pseudorapidity range |η| < 2.5. It consists of a silicon pixel detector (pixel), a semiconductor tracker (SCT) and a straw-tube transition radiation tracker (TRT). These detectors are located at a radial distance from the beam line of 50.5–150 mm, 299–560 mm and 563– 1066 mm, respectively, and are contained within a 2 T axial magnetic field. The inner detector barrel (end-cap) consists of 3 (2 × 3) pixel layers, 4 (2 × 9) layers of double-sided silicon strip modules, and 73 (2 × 160) layers of TRT straw-tubes. These detectors have position resolutions typically of 10 µm, 17 µm and 130 µm for the r–φ coordinates (only for TRT barrel), respectively. The pixel and SCT detectors provide measurements of the r–z coordinates with typical resolutions of 115 µm and 580 µm, respectively. The TRT acceptance is |η| < 2.0. A track traversing the barrel typically has 11 silicon hits (3 pixel clusters and 8 strip clusters) and more than 30 straw-tube hits. A high-granularity lead, liquid-argon electromagnetic sampling calorimeter [15] covers the pseudorapidity range |η| < 3.2. Hadronic calorimetry in the range |η| < 1.7 is provided by an iron scintillator-tile calorimeter, consisting of a central barrel and two smaller extended barrel cylinders, one on either side of the central barrel. In the end-caps (|η| > 1.5), the acceptance of the LAr hadronic calorimeters matches the outer |η| limits of the end-cap electromagnetic calorimeters. The LAr forward calorimeters provide both electromagnetic and hadronic energy measurements, and extend the coverage to |η| < 4.9. The muon spectrometer (MS) measures the deflection of muon tracks in the large superconducting air-core toroid magnets in the pseudorapidity range |η| < 2.7. It is instrumented with separate trigger and high-precision tracking chambers. Over most of the η-range, a precision measurement of the track coordinates in the principal bending direction of the magnetic field is provided by monitored drift tubes. At large pseudorapidities, cathode strip chambers with higher granularity are used in the innermost plane over the range 2.0 < |η| < 2.7. The ATLAS trigger system consists of a hardware-based Level-1 (L1) trigger and a software-based High Level Trigger, subdivided into the Level-2 (L2) and Event-Filter (EF) [16] stages. In L1, electrons are selected by requiring adjacent electromagnetic (EM) trigger towers exceed a certain ET threshold, depending on the detector η. The EF uses the offline reconstruction and identification algorithms to apply the final electron selection in the trigger. The Z → e+ e− events are selected in this analysis by using a dielectron trigger in the region |η| < 2.5 with an electron transverse energy, ET , threshold of 12 GeV. The muon trigger system, which covers the pseudorapidity range |η| < 2.4, consists. of resistive plate chambers in the barrel (|η| < 1.05) and thin gap chambers in the end cap regions (1.05 < |η| < 2.4). Muons are reconstructed in the EF combining L1 and L2 information. The Z → µ + µ − events in this analysis are selected with a first-level trigger that requires the presence of a muon candidate reconstructed in the muon spectrometer with transverse momentum of at least 18 GeV. The trigger efficiency for the events selected as described in Sect. 5 is very close to 100%. 4 Monte Carlo simulations Monte Carlo event samples including a simulation of the ATLAS detector response are used to correct the measurements for detector effects, and to estimate systematic uncertainties. In addition, predictions of different phenomenological models implemented in the MC generators are compared to the data corrected to the particle level. Samples of inclusive Z → e+ e− and Z → µ + µ − events were produced using the leading order (LO) P YTHIA 6 [17], P YTHIA 8 [18], H ERWIG++ [19, 20], Sherpa [21], A LPGEN [22] and next to leading order (NLO) P OWHEG [23] event generators, including various parton density function (PDF) parametrisations. The A LPGEN and Sherpa matrix elements are generated for up to five additional partons, thereby filling the phase space with sufficient statistics for the full set of measured observables. It should be noted, that since the measurements are all reported in bins of pZT , the results presented in this paper are not sensitive to the predicted shape of the pZT spectrum, even though they are sensitive to jet activity in the event. Table 2 lists the different MC models used in this paper. P YTHIA 6, P YTHIA 8 and H ERWIG++ are all leadinglogarithmic parton shower (PS) models matched to leadingorder matrix element (ME) calculations, but with different ordering algorithms for parton showering, and different hadronization models. In scattering processes modelled by lowest-order perturbative QCD two-to-two parton scatters, with a sufficiently low pT threshold, the partonic jet crosssection exceeds that of the total hadronic cross-section. This can be interpreted in terms of MPI. In this picture, the ratio of the partonic jet cross-section to the total cross-section is interpreted as the mean number of parton interactions per event. This is implemented using phenomenological models [24], which include (non-exhaustively) further low-pT screening of the partonic differential cross-section, and use of phenomenological transverse matter-density profiles inside the hadrons. The connection of colour lines between partons, and the rearrangement of the colour structure of an event by reconnection of the colour strings, are implemented in different ways in these phenomenological models. The P YTHIA 6 and P YTHIA 8 generators both use pT ordered parton showers, and a hadronisation model based on the fragmentation of colour strings. The P YTHIA 8 generator.
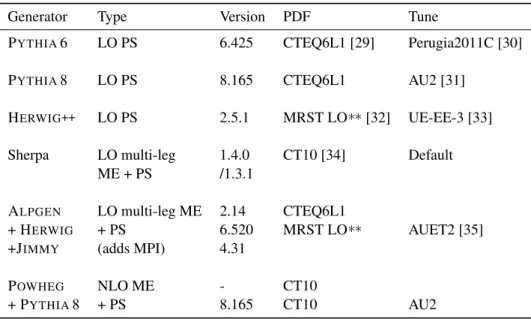
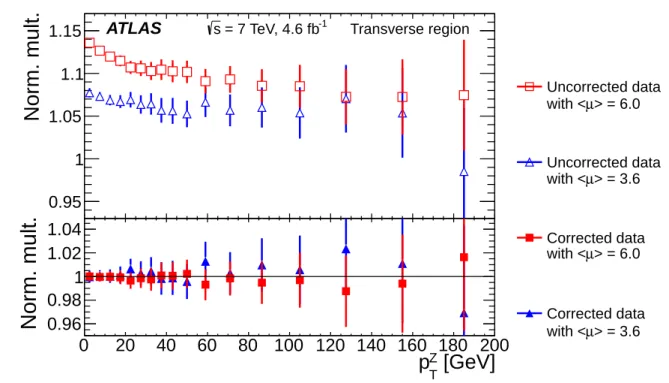
(5) 4. adds to the P YTHIA 6 MPI model by interleaving not only the ISR emission sequence with the MPI scatters, but also the FSR emissions. The H ERWIG++ generator implements a cluster hadronization scheme with parton showering ordered by emission angle. The Sherpa generator uses LO matrix elements with a model for MPI similar to that of P YTHIA 6 and a cluster hadronisation model similar to that of H ERWIG++. In A LPGEN the showering is performed with the H ERWIG generator. The original Fortran H ERWIG [25] generator does not simulate multiple partonic interactions; these are added by the J IMMY [26] package. The A LPGEN generator provides leading-order multi-leg matrix element events: it includes more complex hard process topologies than those used by the other generators, but does not include loop-diagram contributions. The A LPGEN partonic events are showered and hadronised by the H ERWIG+J IMMY generator combination, making use of MLM matching [22] between the matrix element and parton shower to avoid double-counting of jet production mechanisms. A related matching process is used to interface P YTHIA 6 to the next-to-leading-order (NLO) P OWHEG generator, where the matching scheme avoids both double-counting and NLO subtraction singularities [27, 28]. Different settings of model parameters, tuned to reproduce existing experimental data, have been used for the MC generators. The P YTHIA 6, P YTHIA 8, H ERWIG + J IMMY, H ERWIG++ and Sherpa tunes have been performed using mostly Tevatron and early LHC data. The parton shower generators used with A LPGEN and P OWHEG do not use optimised tunes specific to their respective parton shower matching schemes. For the purpose of correcting the data for detector effects, samples generated with Sherpa (with the CTEQ6L1 PDF and the corresponding UE tune), and P YTHIA 8 tune 4C [36] were passed through ATLFAST2 [37], a fast detector simulation software package, which used full simulation in the ID and MS and a fast simulation of the calorimeters. Comparisons between MC events at the reconstructed and particle level are then used to correct the data for detector effects. Since the effect of multiple proton-proton interactions is corrected using a data-driven technique (as described in Sect. 6), only single proton-proton interactions are simulated in these MC samples.. 5 Event selection The event sample was collected during stable beam conditions, with all detector subsystems operational. To reject contributions from cosmic-ray muons and other non-collision backgrounds, events are required to have a primary vertex (PV). The PV is defined as the reconstructed vertex in the event with the highest ∑ p2T of the associated tracks, consistent with the beam-spot position (spatial region inside the. detector where collisions take place) and with at least two associated tracks with pT > 400 MeV. Electrons are reconstructed from energy deposits measured in the EM calorimeter and associated to ID tracks. They are required to satisfy pT > 20 GeV and |η| < 2.4, excluding the transition region 1.37 < |η| < 1.52 between the barrel and end-cap electromagnetic calorimeter sections. Electron identification uses shower shape, track-cluster association and TRT criteria [38]. Muons are reconstructed from track segments in the MS associated to ID tracks [39]. They are required to have pT > 20 GeV and |η| < 2.4. Both electrons and muons are required to have longitudinal impact parameter multiplied by sin θ of the ID track, |z0 | sin θ < 10 mm with respect to the PV. The dilepton invariant mass of oppositely charged leptons, mll , is required to be in the region 66 < mll < 116 GeV at this stage. No explicit isolation requirement is applied to the muons, but in the case of electrons, some isolation is implied by the identification algorithm. The correction for this effect is discussed in Sect. 7.3. The tracks in the calculation of UE observables satisfy the following criteria [40]: – pT > 0.5 GeV and |η| < 2.5; – a minimum of one pixel and six SCT hits; – a hit in the innermost pixel layer, if the corresponding pixel module was active; – transverse and longitudinal impact parameters with respect to the PV, |d0 | < 1.5 mm and |z0 | sin θ < 1.5 mm, respectively; – for tracks with pT > 10 GeV, a goodness of fit probability greater than 0.01 in order to remove mis-measured tracks. The tracks corresponding to the leptons forming the Zboson candidate are excluded.. 6 Correction for pile-up The average expected number of pile-up events per hardscattering interaction (µ) was typically in the range 3 − 12 in the 2011 dataset. Of the tracks selected by the procedure described above and compatible with the PV of the hard-scattering event, up to 15% originate from pile-up, as described below. Due to the difficulty in modelling accurately the soft interactions in pp collisions and the fact that pile-up conditions vary significantly over the data-taking period, a data-driven procedure has been derived to correct the measured observables for the pile-up contribution. The measured distribution of any track-based observable can be expressed as the convolution of the distribution of this variable for the tracks originating from the Z-boson production vertex, with the distribution resulting from the superimposed pile-up interactions. The pile-up contribution is estimated from data by sampling tracks originating from a vertex well separated from the hard-scattering PV. In each.
(6) 5. Table 2 Main features of the Monte-Carlo models used. The abbreviations ME, PS, MPI, LO and NLO respectively stand for matrix element, parton shower, multiple parton interactions, leading order and next to leading order in QCD.. Generator. Type. Version. PDF. Tune. P YTHIA 6. LO PS. 6.425. CTEQ6L1 [29]. Perugia2011C [30]. P YTHIA 8. LO PS. 8.165. CTEQ6L1. AU2 [31]. H ERWIG++. LO PS. 2.5.1. MRST LO∗∗ [32]. UE-EE-3 [33]. Sherpa. LO multi-leg ME + PS. 1.4.0 /1.3.1. CT10 [34]. Default. A LPGEN + H ERWIG +J IMMY. LO multi-leg ME + PS (adds MPI). 2.14 6.520 4.31. CTEQ6L1 MRST LO∗∗. AUET2 [35]. P OWHEG + P YTHIA 8. NLO ME + PS. 8.165. CT10 CT10. AU2. event, the pile-up contribution to a given observable is derived from tracks selected with the same longitudinal and transverse impact parameter requirements as the PV tracks, but with respect to two points located at z distances of +2 cm and −2 cm from the hard-scattering PV. The shift of 2 cm relative to the PV introduces a bias in the density of the pile-up interactions. This is corrected on the basis of the shape of the distribution of the z distance between pairs of interactions in the same bunch crossing. This distribution √ is well approximated by a Gaussian with variance σ = 2σBS , where σBS ≈ 6 cm is the effective longitudinal variance of the interaction region averaged over all events. Pile-up distributions are thus obtained for each observable and are deconvoluted from the corresponding measured distributions at the hard-scattering PV. The stability of the pile-up correction for different beam conditions is demonstrated in Fig. 2. The figure compares the distributions of the average charged particle multiplicity density, hNch /δ η δ φ i as a function of pZT , before and after pile-up correction, for two sub-samples with an average of 3.6 and 6 interactions per bunch crossing (hµi), respectively. Each distribution is normalised to that obtained for the full sample after pile-up correction. The dependence of the normalised charged multiplicity distributions on pZT which can be seen before correction in Fig. 2 reflects the fact that actual contributions to this observable depend on pZT , while the pileup contribution is independent of pZT . The pile-up corrected results agree to better than 2%, a value much smaller than the size of the correction, which may be as large as 20% for this observable in low pZT bins for the data-taking periods with. the highest values of hµi. The systematic uncertainty arising from this procedure is discussed in Sect. 8.. 7 Unfolding to particle level, background corrections and channel combination After correcting for pile-up, an iterative Bayesian unfolding [41] of all the measured observables to the particle level is performed. This is followed by a correction of the unfolded distributions for the small amount of background from other physics processes. At this point, the electron and muon measurements are combined to produce the final results.. 7.1 Unfolding The measurements are presented in the fiducial region defined by the Z-boson reconstructed from a pair of oppositely charged electrons or muons each with pT > 20 GeV and |η| < 2.4 and with a lepton pair invariant mass in the range 66 < mll < 116 GeV. The results in Sect. 9 are presented in the Born approximation, using the leptons before QED FSR to reconstruct the Z-boson. These results are also provided in HEPDATA [42] using dressed leptons. These are defined by adding vectorially to the 4-momentum of each lepton after QED FSR the 4momenta of any photons not produced in hadronic decays and found within a cone of ∆ R = 0.1 around p the lepton, where the angular separation ∆ R is given by (∆ η)2 + (∆ φ )2 ..
(7) Norm. mult.. 6. 1.15. ATLAS. s = 7 TeV, 4.6 fb-1. Transverse region. 1.1. Uncorrected data with <µ> = 6.0. 1.05 1. Uncorrected data with <µ> = 3.6. Norm. mult.. 0.95. 1.040 1.02 1 0.98 0.96 0. 20. 40. 60. 80. 100 120 140 160 180 200 pZ [GeV] T. 20. 40. 60. 80 100 120 140 160 180 200. Corrected data with <µ> = 6.0. Corrected data with <µ> = 3.6. pZ [GeV] T. Fig. 2 Average charged particle multiplicity density, hNch /δ η δ φ i in the transverse region for two samples with different average numbers of interactions, hµi, normalised to the average density in the full sample after pile-up correction, before (top) and after (bottom) pile-up correction. The data are shown as a function of the transverse momentum of the Z-boson, pZT . Only statistical uncertainties are shown.. The UE observables are constructed from stable charged particles with pT > 0.5 GeV and |η| < 2.5, excluding Zboson decay products. Stable charged particles are defined as those with a proper lifetime τ > 0.3 × 10⁻¹⁰ s, either directly produced in pp interactions or from the subsequent decay of particles with a shorter lifetime. Bayesian iterative unfolding was used to correct for residual detector resolution effects. This method requires two inputs: an input distribution of the observable (the MC generatorlevel distribution is used for this), and a detector response matrix which relates the uncorrected measured distribution in this observable to that defined at the event generator level, also termed the particle level. The detector response matrix element, Si j is the probability that a particular event from bin i of the particle-level distribution is found in bin j of the corresponding reconstructed distribution, and is obtained using simulation. For the profile histogram observables in this paper, a two-dimensional (2D) histogram was created with a fine binning for the observable of interest, such that each unfolding bin corresponds to a region in the 2D space. The unfolding process is iterated to avoid dependence on the input distribution: the corrected data distribution produced in each iteration is used as the input for the next. In this analysis, four iterations were performed since this resulted only in a small residual bias when tested on MC samples while keeping the statistical uncertainties small. The unfolding uses the Sherpa simulation for the input distributions and. unfolding matrix. In the muon channel, the MC events are reweighted at the particle level in terms of a multi-variable distribution constructed for each distribution of interest using the ratio of data to detector-level MC, so that the detectorlevel MC closely matches the data. This additional step is omitted in the electron channel for the reasons discussed in Sect. 7.3. The dominant correction to the data is that related to track reconstruction and selection efficiencies, in particular at lowpT . After the selection described in Sect. 5, the rate of fake tracks (those constructed from tracker noise and/or hits which were not produced by a single particle) is found to be very small. This, as well as a small contribution of secondaries (i.e. tracks arising from hadronic interactions, photon conversions to electron-positron pairs, and decays of long-lived particles) is corrected for by the unfolding procedure.. 7.2 Backgrounds The background to the Z-boson signal decaying into a lepton pair consists of a dominant component from multijet production, smaller components from other physics sources, and a very small component from non-collision backgrounds. A fully data-driven correction procedure has been developed and applied directly to the unfolded distributions to take into account the influence of the backgrounds..
(8) 7. dNev Norm. 1 Nev dΣ p. T. 1.25 1.2 1.15 1.1. ATLAS µµ data ee data µµ fit ee fit. s = 7 TeV, 4.6 fb-1. Toward region. 30 GeV < Σ pT < 32 GeV 30 GeV < pZT < 35 GeV. 1.05 1 0.95 0.9 0. 5. 10. 15. 20. 25 ∆m ll [GeV]. Fig. 3 Impact of non-resonant backgrounds on the measurement of ∑ pT in the bin 30 GeV < Σ pT < 32 GeV and in the toward region for 30 GeV < pZT < 35 GeV. This is shown separately for the electron and muon channels as a function of the window applied to the dilepton mass |mll − MZ | < ∆ mll . The unfolded value for each channel is normalised to the corrected combined result. The statistical uncertainties at individual ∆ mll points are strongly correlated within each channel. The uncertainty range of the linear fit is shown by hatched bands for each channel. This includes the statistical and systematic uncertainties from the fit itself, as well as the relevant correlations. The vertical line at ∆ m`` = 0 marks the points to which the extrapolations are made.. The primary vertex requirement removes almost all of the beam-induced non-collision background events. Similarly, the impact parameter requirements on the leptons reduce the cosmic-ray background to a level below 0.1% of the signal. These residual backgrounds were considered as negligible in the analysis. The pp collision backgrounds to Z → e+ e− or Z → decays were found to be of the order of a few percent of the signal in the mass window [43]. The resonant backgrounds from W Z, ZZ and Zγ pair production with a Z boson decaying into leptons were estimated from simulated samples and found to amount to less than 0.2% of the selected events. Their impact on the underlying event observables is negligible and they were not considered further here. µ+µ−. The contribution from the non-resonant backgrounds (i.e. from all other pp collision processes) is larger, typically between 1% and 2% of the signal, depending on the pZT range considered, and is dominated by multijet production with a combination of light-flavour jets misidentified as electrons and heavy-flavour jets with a subsequent semileptonic decay of a charm or beauty hadron. This contribution is estimated to correspond to 0.5% of the signal for Z → e+ e− decays. and to 1 − 2% of the signal for Z → µ + µ − decays. The background in the electron channel is somewhat lower because of the implicit isolation requirement imposed on the electrons through the electron identification requirements. Smaller contributions to the non-resonant background arise from diboson, t t¯ and single top production and amount to less than 0.3% of the signal, increasing to 1% at pZT > 50 GeV. The still smaller contributions from processes such as W or Z production with jets, where a jet is misidentified as a lepton, are treated in the same way as the multijet background. These contributions amount to less than 0.1% of the signal sample. The non-resonant background is corrected for by studying the UE observables as a function of ∆ mll , the half-width of the mass window around the Z-boson signal peak. Since the distributions of UE observables in non-resonant background processes are found to be approximately constant as a function of the dilepton mass and the background shape under the Z-boson mass peak is approximately linear, the background contribution to any UE observable is approximately proportional to ∆ mll . Thus, the background contribution can be corrected for by calculating the UE observables for different values of ∆ mll , chosen here to be between 10 and 25 GeV,.
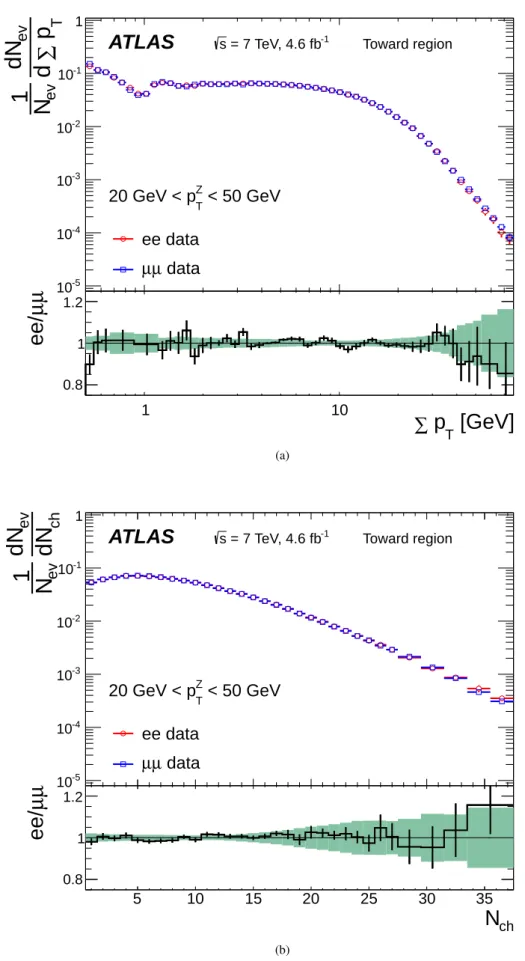
(9) 8. and extracting the results which could be measured for a pure signal with ∆ mll → 0. This procedure is performed separately for each bin of the distributions of interest. The validity of the linear approximation for the ∆ mll dependence of the background contribution was checked for all observables studied in this analysis. An example is presented in Fig. 3, where the ∆ mll dependence is shown for one bin of the ∑ pT differential distribution, as obtained in the toward region for 30 < pZT < 35 GeV and shown separately for the electron and muon channels. The values plotted in Fig. 3 are normalised to the corrected combined value. The values of the observables in the muon channel increase linearly with ∆ mll . The difference in the slope observed between the muon and the electron samples is due to the larger background in the muon channel, as discussed above. A straight line is fitted through the points obtained for the various ∆ mll values shown in Fig. 3 for each channel. For each bin in the observable and pZT , the muon and electron channels values agree with each other after extrapolating to ∆ mll = 0 within the uncertainties of the fit procedure, which are represented by the shaded areas and include the statistical and systematic uncertainties from the fit itself (as discussed in Sect. 8, as well as the relevant correlations. The effect of the background on the unfolded distributions can be summarised as follows: in the case of the electron channel, which has less background than the muons, the background in the average values of ∑ pT and Nch is below 1%. The absence of any isolation requirement applied to the muons leads to significantly higher background levels in certain regions, with corrections ranging from as high as 6 − 8% for the average values of ∑ pT in the toward region at high pZT , to about 1% for the average values of Nch . The background correction is done after unfolding to avoid resolution issues present at the detector level. 7.3 Combination of the electron and muon channels Before combining the electron and muon channels, the analysis must correct for a bias over a limited region of the phase space which affects the measurements in the electron channel when one of the electrons is close to a jet produced in association with the Z boson. This bias is observed at high pZT , mostly in the toward region and to a lesser extent in the transverse region, and affects the ∑ pT distribution for high values of ∑ pT , typically ∑ pT > 30 GeV. It arises from the imperfect modelling of the electron shower shape variables in the simulation, which leads to an underestimate of the electron identification efficiency for electrons close to jets. The bias on the observable can be as large as 50% for ∑ pT = 100 GeV. Since it is not reproduced precisely enough by the simulation of the electron shower, in the relevant narrow regions of phase space a tightened isolation criterion was applied to electrons to exclude the mismodelled event configurations. and the proper geometric correction was deduced from the muon channel unaffected by jet overlap. The combined results for electrons and muons in the affected bins are assigned a larger uncertainty, since the contribution of events from the electron-decay channel is significantly reduced leading to a larger overall uncertainty. The most significant effect is observed for the ∑ pT > 100 GeV in the toward and transverse region. As discussed in Sect. 2 and in Sect. 7.1, the electron and muon results are unfolded and then combined, both as Born-level lepton pairs and as dressed lepton pairs, and accounting for the uncorrelated and correlated terms in the systematic uncertainties between the channels (as described in Sect. 8). Combining the dressed electron and muon pairs induces < 0.1% additional systematic uncertainty on the UE observables compared to the Born level results. Figure 4 illustrates the excellent agreement between the fully unfolded and corrected UE observables for the electron and muon channels, once the specific correction procedure described above has been applied to the electron channel in the limited phase space regions where significant hadronic activity occurs close to one of the electrons. As shown for the specific region 20 < pZT < 50 GeV in Fig. 4, the differential distributions for ∑ pT and Nch agree within statistical uncertainties over most of the range of relevance, except for high values of ∑ pT , where the electron bias has been corrected as described above, and where the total uncertainty on the combined measurement has been enlarged as shown by the shaded error band in the ratio plot. The shape of the ∑ pT distribution in the region around 1 GeV reflects the pT threshold of 0.5 GeV applied in the track selection.. 8 Systematic Uncertainties The following sources of uncertainty have been assessed for the measured distributions after all corrections and unfolding. Table 3 summarises the typical sizes of the systematic uncertainties for the UE observables as a function of pZT . Lepton selection - systematic uncertainties due to the lepton selection efficiencies have been assessed using MC simulation. The data are first unfolded using the nominal MC samples, then with samples corresponding to a ±1σ variation of the efficiencies [43]. These uncertainties are assumed to be uncorrelated between the electron and muon channels. The resulting uncertainty is less than 1% for all observables over most of the kinematic range. Track reconstruction - the systematic uncertainty on the track reconstruction efficiency originating from uncertainties on the detector material description is estimated as in Ref. [44] for particles with |η| < 2.1 and as in Ref. [40] for |η| > 2.1. The typical value for |η| < 2.1 is ±1% while it is approximately 5% for |η| > 2.1. The effect of.
(10) 1 dNev Nev d ∑ p. T. 9. 1. ATLAS. s = 7 TeV, 4.6 fb-1. Toward region. 10-1. 10-2. 10-3. 20 GeV < pZT < 50 GeV. 10-4. ee data. ee/µµ. µµ data 10-5 1.2. 1. 10. 1. 10. 1 0.8. ∑ pT [GeV]. 1 dNev Nev dNch. (a). 1. ATLAS. s = 7 TeV, 4.6 fb-1. Toward region. 10-1. 10-2. 10-3. 20 GeV < pZT < 50 GeV. 10-4. ee data µµ data. ee/µµ. -5. 10 1.2. 5. 10. 15. 20. 25. 30. 35. 5. 10. 15. 20. 25. 30. 35. 1 0.8. Nch (b) Fig. 4 Unfolded and corrected distributions of charged particle ∑ pT (a) and Nch (b) for 20 < pZT < 50 GeV shown separately for the Z → e+ e− and Z → µ + µ − samples after all corrections have been applied. The bottom panels show the ratios between the electron and the muon distributions where the error bars are purely statistical and the shaded areas represent the total uncertainty, including systematic, on the combined result..
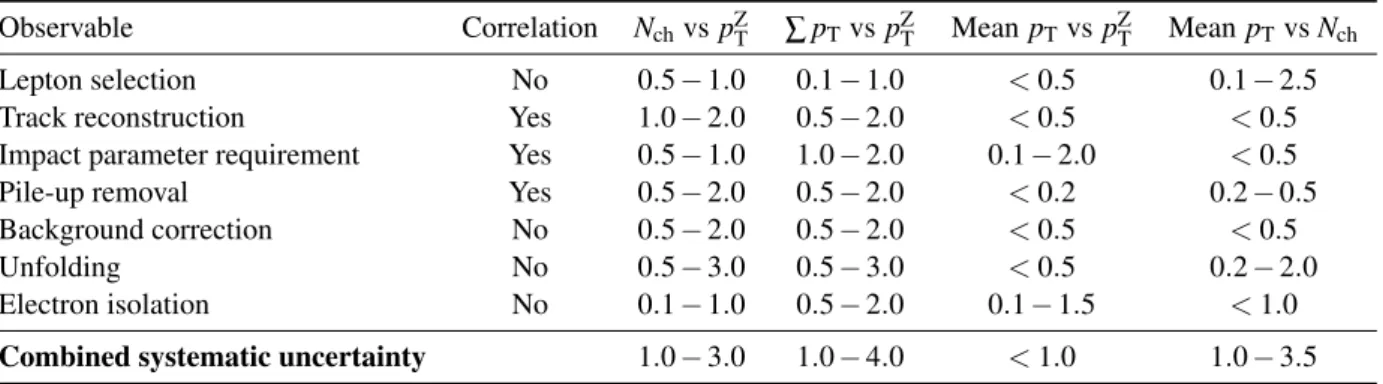
(11) 10. Table 3 Typical contributions to the systematic uncertainties (in %) on the unfolded and corrected distributions of interest in the toward and transverse regions for the profile distributions. The range of values in the columns 3 − 5 indicate the variations as a function of pZT , while those in the last column indicate the variations as a function of Nch . The column labelled Correlation indicates whether the errors are treated as correlated or not between the electron and muon channels.. Observable Lepton selection Track reconstruction Impact parameter requirement Pile-up removal Background correction Unfolding Electron isolation Combined systematic uncertainty. Correlation. Nch vs pZT. ∑ pT vs pZT. Mean pT vs pZT. Mean pT vs Nch. No Yes Yes Yes No No No. 0.5 − 1.0 1.0 − 2.0 0.5 − 1.0 0.5 − 2.0 0.5 − 2.0 0.5 − 3.0 0.1 − 1.0. 0.1 − 1.0 0.5 − 2.0 1.0 − 2.0 0.5 − 2.0 0.5 − 2.0 0.5 − 3.0 0.5 − 2.0. < 0.5 < 0.5 0.1 − 2.0 < 0.2 < 0.5 < 0.5 0.1 − 1.5. 0.1 − 2.5 < 0.5 < 0.5 0.2 − 0.5 < 0.5 0.2 − 2.0 < 1.0. 1.0 − 3.0. 1.0 − 4.0. < 1.0. 1.0 − 3.5. this uncertainty on the final results is less than 2%. This uncertainty is fully correlated between the electron and muon channels. Impact parameter requirement - the fraction of secondary particles (i.e. those originating from decays and interactions in the inner detector material) in data is reproduced by the MC simulation to an accuracy of ∼ 10 − 20%, obtained by comparing d0 distributions in MC and in the data corrected for pile-up. To assess the corresponding systematic uncertainty, the track impact parameter requirements on |d0 | and |z0 |sinθ are varied from the nominal values of 1.5 mm to 1.0 mm and 2.5 mm, resulting in fractions of secondaries varying between 0.5% to 4.0%, and the resulting distributions are unfolded using MC samples selected with the same impact parameter requirements. The maximum residual difference of 2% or less between these unfolded distributions and the nominal unfolded distribution is taken as the uncertainty arising from this requirement. This uncertainty is also fully correlated between the electron and muon channels. Pile-up correction - the pile-up correction uncertainty originates from the uncertainty in the pile-up density fitted along with the spatial distribution of tracks originating from pile-up, and the difference between the pile-up densities measured for Z-boson and for randomly triggered events. In addition to these, the stability of the correction method with respect to the instantaneous luminosity was estimated by performing the correction procedure independently on datasets with different average numbers of reconstructed vertices, as shown in Fig. 2. The total uncertainty due to the pile-up correction is taken to be the quadratic combination of the uncertainties from these sources, and it is at most 2% for the average underlying event observables. The overall uncertainty is fully correlated between the electron and muon channels.. Background correction - the uncertainty is evaluated by comparing the results of the linear fit to those obtained using a second-order polynomial. This uncertainty is at most 2% for the maximum background uncertainty on ∑ pT , which is the most strongly affected variable, and is assumed to be uncorrelated between the electron and muon channels. Any potential correlation arising from the common tt and diboson backgrounds is neglected because they become sizable only for pZT > 100 GeV, where the total uncertainty is dominated by the statistical uncertanty on the background. Unfolding - the uncertainty due to the model-dependence of the unfolding procedure is taken from the degree of nonclosure between the P YTHIA 8 initial particle-level distributions and the corresponding detector-level P YTHIA 8 distributions unfolded and corrected using the Sherpa sample, which was reweighted to agree with P YTHIA 8 at the detector level. This uncertainty varies between 0.5% and 3% for the profile distributions, and is assumed to be uncorrelated between the electron and muon channels. Bias due to implicit isolation - this uncertainty is estimated by varying the electron isolation requirement used to derive the correction discussed in Sect. 7.3. The uncertainty is assigned to the electron channel and does not exceed ∼ 1% for the profile distributions.. Other potential sources of systematic uncertainty have been found to be negligible. The total uncertainty in each measured bin is obtained by propagating the systematic component of the error matrix through the channel combination. For the differential distributions in Sect. 9.2, the unfolding model dependent uncertainty increases to about 5%, resulting in slightly larger overall systematic uncertainties..
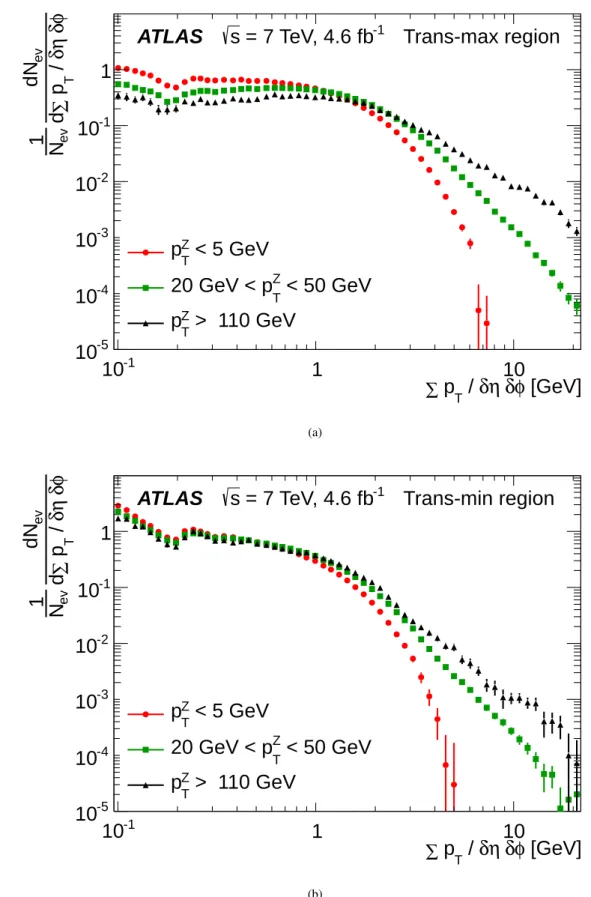
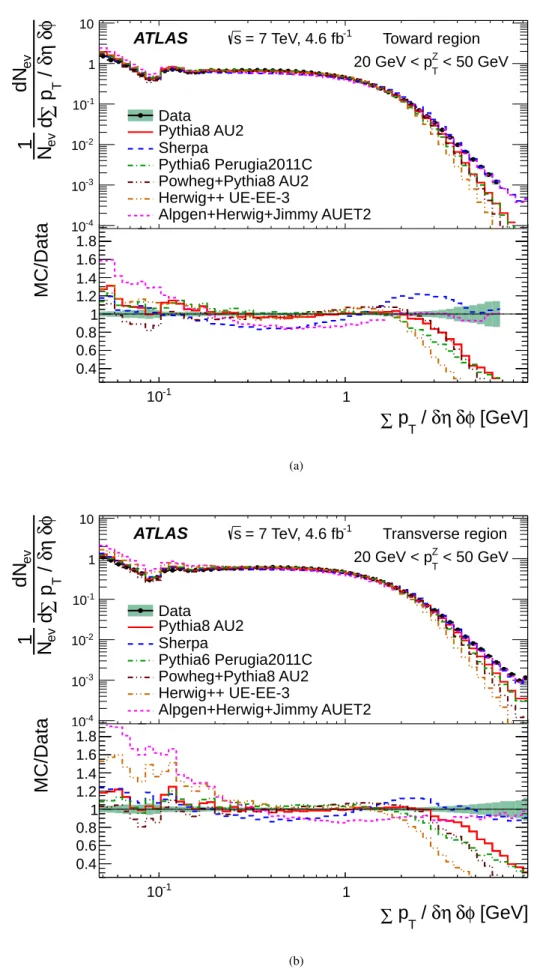
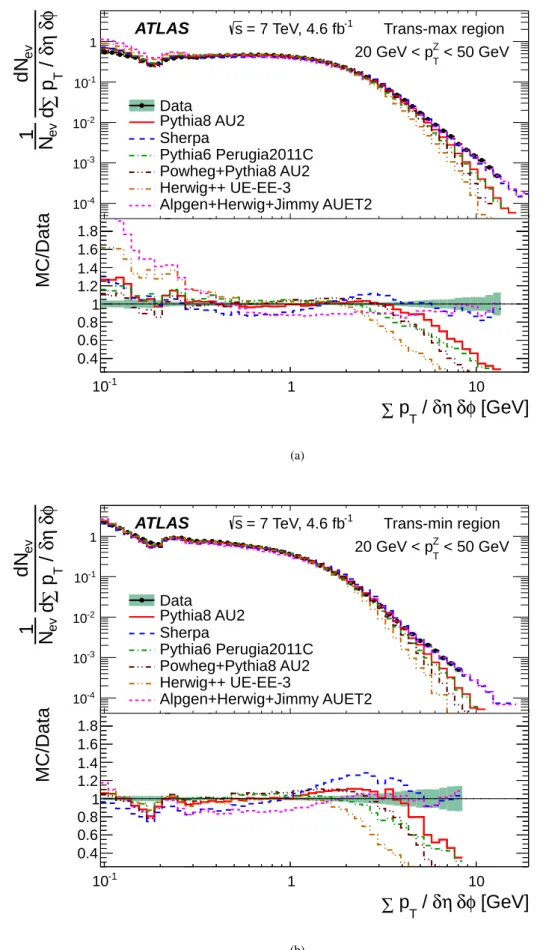
(12) 11. 9 Results 9.1 Overview of the results The results are shown in Sect. 9.2, first for the differential distributions of charged particle ∑ pT and Nch in intervals of pZT , and then for the same distributions for a representative pZT range compared to MC model predictions. The normalised quantities, Nch /δ η δ φ and ∑ pT /δ η δ φ , are obtained by dividing Nch or ∑ pT by the angular area in η–φ space. This allows for direct comparisons between the total transverse and trans-min/max quantities, and between the current result and experiments with different angular acceptances. The angular areas for the transverse, toward, and away region observables are δ φ δ η = (2 × π/3) × (2 × 2.5) = 10π/3, while for trans-max/min/diff, δ φ δ η = 5π/3. Since the away region is dominated by the jets balancing the pZT [43], the focus will be on the toward, transverse, trans-max and trans-min regions. In the transverse region, the extra jet activity is more likely to be assigned to the trans-max region. Assuming the same flat UE activity in trans-min and trans-max regions, the trans-diff region, the difference between the observables measured in trans-max and trans-min regions, is expected to be dominated by the hard scattering component. In Sect. 9.3 profile histograms are shown. Finally, in Sect. 9.4, the results are compared to previous measurements from ATLAS where distributions sensitive to the underlying event were measured as a function of the kinematics of either the leading charged particle [1], or the leading jet [5].. 9.2 Differential distributions The distributions of the charged-particle ∑ pT /δ η δ φ and Nch /δ η δ φ in intervals of pZT show the dependence of the event activity on the hard scale. The distributions of ∑ pT /δ η δ φ in three different pZT ranges are shown in Fig. 5 and in Fig. 6. At values below ∑ pT /δ η δ φ of 0.1 GeV, the distributions exhibit a decrease, which is independent of pZT . This is followed by a sharp increase at higher ∑ pT /δ η δ φ , which is an artifact of requiring at least two tracks with pT of at least 0.5 GeV in every event. Then a broad distribution can be seen extending to ∑ pT /δ η δ φ of about 1 GeV, followed by a steep decrease, the rate of which depends on the pZT interval. For lower pZT values, the decrease is faster. These features are fairly independent of the UE regions, with the exception of the trans-min region, in which the ∑ pT /δ η δ φ distribution is approximately independent of pZT up to ∑ pT /δ η δ φ of 1 GeV. If there were no hard scattering contributions in the trans-min region and the remaining underlying event activity were independent of the hard scattering scale then this pZT independence of the ∑ pT /δ η δ φ distribution would be expected [45].. pZT ,. In Fig. 7 and Fig. 8, for a selected interval of between 20 − 50 GeV, the ∑ pT /δ η δ φ distributions in all the UE regions are compared to various MC model predictions (as described in Tab. 2). For ∑ pT /δ η δ φ < 0.1 GeV, there is a large spread in the predictions of the MC models relative to the data, with P OWHEG providing the best description. The intermediate region with 0.1 < ∑ pT /δ η δ φ < 1 GeV, is well reproduced by most of the MC models. For the higher ∑ pT /δ η δ φ ranges, most of the MC models underestimate the number of events, with the exception of Sherpa and A LPGEN, which have previously been shown to provide good models of multi-jet produced in association with a Z-boson [43]. This observation may indicate that even the trans-min region is not free of additional jets coming from the hard scatter. The distributions of the charged particle multiplicity density in the four UE regions are shown in Fig. 9 and Fig. 10 for the same pZT intervals used in Fig. 5 and Fig. 6, respectively. The distributions in the transverse, toward and transmax regions exhibit similar features, with the exception of the largest multiplicities, which are suppressed in the transmin region, compared to the trans-max one. In the transmin region, as for the ∑ pT /δ η δ φ distribution, limited dependence on pZT is observed at low multiplicity. The suppression of large multiplicities in the trans-min region is more pronounced in the lower pZT intervals. The comparison of these multiplicity distributions to various MC models, in the same pZT interval, between 20 − 50 GeV, is shown in Fig. 11 and Fig. 12 for all the UE regions. In contrast to the ∑ pT /δ η δ φ distributions, none of the MC models, except P YTHIA 8, describes the data distributions, in particular for Nch /δ η δ φ > 2.. 9.3 Average distributions The evolution of the event activity in the four UE regions with the hard scale can be conveniently summarised by the average value of the UE observables as a function of pZT . In Fig. 13(a) the dependence of h∑ pT /δ η δ φ i on pZT is compared in different UE regions. The activity levels in the toward and transverse regions are both small compared to the activity in the away region. This difference increases with increasing pZT . The away region density is large due to the presence in most cases of a jet balancing the Z-boson in pT . The density in the transverse region is seen to be systematically higher than that in the toward region, which can be explained by the fact that for high pZT , additional radiated jets balancing pZT affect the transverse region more than the toward region [43]. The difference between the three regions disappears at low pZT due to the fact that the UE regions are not well defined with respect to the actual Zboson direction..
(13) 12. In Fig. 13(b), h∑ pT /δ η δ φ i is seen to rise much faster as a function of pZT in the trans-max region than in the trans-min region. The slowing down of the rise of h∑ pT /δ η δ φ i at high pZT in the most UE-sensitive toward and trans-min regions is consistent with an assumption [46] of a full overlap between the two interacting protons in impact parameter space at high hard scales. The comparison of the h∑ pT /δ η δ φ i distribution as a function of pZT with the predictions of various MC models is shown in Fig. 14 and Fig. 15 in the UE regions sensitive to the underlying event characteristics. For clarity of comparison, the statistically least significant pZT > 210 GeV bin is omitted. The variation in the range of predictions is quite wide, although less so than for the differential ∑ pT distributions. The best description of the transverse and trans-max regions is given by Sherpa, followed by P YTHIA 8, A LPGEN and P OWHEG. The observation that the multi-leg and NLO generator predictions are closer to the data than most of the pure parton shower generators suggests that these regions are affected by the additional jets coming from the hard interaction. Jet multiplicities in events with a Z-boson have been studied by the LHC experiments [43], and they are well described by Sherpa and A LPGEN. The discrepancy between the P YTHIA 8 AU2 tune and the P YTHIA 6 Perugia tune possibly indicates the effect of using LHC UE data for the former in addition to the shower model improvement. In the trans-min region, which is the most sensitive to the UE, none of the models fully describe the data. Apart from H ERWIG++, and Sherpa, which predicts a faster rise of ∑ pT than observed in data, the other generators model the data better in the trans-min region than they do in the transverse or trans-max regions. This possibly indicates that in the LO shower generators the underlying event is well modelled but perturbative jet activity is not. In Fig. 16, hNch /δ η δ φ i is shown as a function of pZT in the different UE regions. The profiles behave in a similar way to h∑ pT /δ η δ φ i. However, the trans-diff hNch /δ η δ φ i activity is lower than that for trans-min, while for h∑ pT /δ η δ φ i, it is the other way around. This indicates that the trans-diff region, which is a measure of extra activity in the trans-max region over the trans-min region, is populated by a few particles with high transverse momentum, as expected for the leading constituents of jets. In Fig. 17 and Fig. 18, in which various MC model predictions are compared to hNch /δ η δ φ i as a function of pZT , a different pattern from that of h∑ pT /δ η δ φ i is observed. The P YTHIA 6 Perugia 2011C tune and A LPGEN provide the closest predictions in all three regions. Sherpa, P YTHIA 8 and P OWHEG predict higher average multiplicities, with Sherpa being the farthest from the data. On the other hand, H ERWIG++ mostly underestimates the data. The h∑ pT /δ η δ φ i and hNch /δ η δ φ i distributions as functions of pZT in the trans-diff region are compared with. the MC model predictions in Fig. 19. While all MC models, except for H ERWIG++ predict the multiplicity fairly well, only Sherpa and A LPGEN predict the ∑ pT average values well in certain ranges. The better modelling of this region by MC models with additional jets coming from matrix element rather than from parton shower again confirms that the transdiff region is most sensitive to the additional radiated jets. The difficulty of describing the h∑ pT /δ η δ φ i and hNch /δ η δ φ i average values simultaneously in MC models is reflected in the comparison of data and MC model predictions for hpT i in Fig. 20. The hpT i as a function of pZT is reasonably described by A LPGEN and Sherpa for high pZT , while all the other models predict softer spectra. The correlation of hpT i with Nch , shown in Fig. 21, follows the pattern established by previous experiments, with a slow increase in mean pT with increasing Nch . This observable is sensitive to the colour reconnection model in the MC generators. No MC model is able to predict the full shape in either region. Overall the P YTHIA 8 prediction is the closest to the data, followed by P YTHIA 6 and P OWHEG, although for Nch < 5, all three have much softer distributions than the data. The other models do well in this low Nch region, but are then much lower than the data for high Nch . From all the distributions considered, it can be inferred that the jets radiated from the hard scatter will affect the underlying event observables and therefore these must be properly reproduced in order to obtain an accurate MC description of the UE. The UE region least affected by the presence of extra jets is the trans-min region.. 9.4 Comparison with other ATLAS measurements The results from this analysis are compared to the results obtained when the leading object is either a charged particle [1] or a hadronic jet [5]. The underlying event analysis with a leading charged particle was performed with the early 2010 data, while the analysis using events with jets utilises the full 2010 dataset. The differential Nch /δ η δ φ and ∑ pT /δ η δ φ distributions for leading jet and Z-boson events are compared in Fig. 22 and Fig. 23 for the trans-max and trans-min regions. While the Nch /δ η δ φ distributions are similar, a clear difference is observed in the high tails of the ∑ pT /δ η δ φ distribution, which are more populated in Z-boson events than in jet events. This difference was traced to the definition of the leading object. In the case of jets, the accompanying activity can never contain jets with a pT higher than that of the leading jet, whereas there is no such restriction for Z-boson events. As a test, the average ∑ pT was determined for Z-boson events after rejecting all events in which at the detector level there was a jet with pT higher than the pZT , with jets selected as in [5]. The average was found to be about 20 − 30% lower.
(14) 13. than for the standard selection, and the average values in jet and Z-boson events are in close agreement in this case. The hard scales used for the analyses are different and the choice of the main observable used to assess the evolution of the underlying event reflects this to a certain extent in the figures. Nevertheless, certain common qualitative features can be observed by comparing h∑ pT /δ η δ φ i and hNch /δ η δ φ i as functions of the leading object pT in the transverse region, and also separated into the trans-max/min regions as shown in Fig. 24 and Fig. 25. The measurements with a leading jet are complementary to the measurements with a leading track, and a smooth continuation at 20 GeV is observed (in Fig. 24), corresponding to the lowest jet pT for which the jet measurement could be performed and the highest leading track momentum included in the leading track analysis. Where the pT of the leading object is less than 50 GeV, a large difference is observed both for the Nch and ∑ pT average values between the jet and Z-boson measurements in Fig. 24; the increase of the associated activity as a function of the hard scale pT is very different in track/jets events from the Z-boson events. Although the Nch density is similar in the underlying event associated with a jet to that with a Z-boson for higher values of the hard scale (≥ 50 GeV), there are residual differences in the average ∑ pT densities. The activity in events with a Z-boson is systematically higher than that in events with jets. From the behaviour of the underlying event properties in the trans-max/min regions in Fig. 25, this difference originates mostly from the trans-max region, due to selection bias discussed previously in this section. The trans-min region is very similar between the two measurements, despite the different hard scales, indicating again that this region is least sensitive to the hard interaction and most sensitive to the MPI component..
(15) dNev 1 Nev d∑ p / δη δφ. 14. T. ATLAS. s = 7 TeV, 4.6 fb-1 Toward region. 1 10-1. 10-2 10-3 10-4. pZT < 5 GeV 20 GeV < pZ < 50 GeV T. pZT 10-5. > 110 GeV. 10-1. 1. 10 p / δ η δ φ [GeV] ∑ T. ATLAS. T. dNev 1 Nev d∑ p / δη δφ. (a). s = 7 TeV, 4.6 fb-1 Transverse region. 1 10-1. 10-2 10-3 10-4. pZT < 5 GeV 20 GeV < pZ < 50 GeV T. pZT 10-5. > 110 GeV. 10-1. 1. 10 p / δ η δ φ [GeV] ∑ T. (b) Fig. 5 Distributions of the scalar pT sum density of charged particles, ∑ pT /δ η δ φ , in three different Z-boson transverse momentum, pZT , intervals, in the toward (a) and transverse (b) regions. The error bars depict combined statistical and systematic uncertainties..
(16) dNev 1 Nev d∑ p / δη δφ. 15. T. ATLAS. s = 7 TeV, 4.6 fb-1 Trans-max region. 1 10-1. 10-2 10-3 10-4. pZT < 5 GeV 20 GeV < pZ < 50 GeV T. pZT. > 110 GeV. 10-5 -1 10. 1. 10 p / δ η δφ [GeV] ∑ T. ATLAS. T. dNev 1 Nev d∑ p / δη δφ. (a). s = 7 TeV, 4.6 fb-1 Trans-min region. 1 10-1. 10-2 10-3 10-4. pZT < 5 GeV 20 GeV < pZ < 50 GeV T. pZT 10-5 -1 10. > 110 GeV 1. 10 p / δ η δφ [GeV] ∑ T. (b) Fig. 6 Distributions of the scalar pT sum density of charged particles, ∑ pT /δ η δ φ , in three different Z-boson transverse momentum, pZT , intervals, in the trans-max (a) and trans-min (b) regions. The error bars depict combined statistical and systematic uncertainties..
(17) dNev 1 Nev d∑ p / δη δφ T. 16. 10. ATLAS 1 10-1 10-2 10-3. MC/Data. s = 7 TeV, 4.6 fb-1. 10-4. 1.8 1.6 1.4 1.2 1 0.8 0.6 0.4. Toward region 20 GeV < pZT < 50 GeV. Data Pythia8 AU2 Sherpa Pythia6 Perugia2011C Powheg+Pythia8 AU2 Herwig++ UE-EE-3 Alpgen+Herwig+Jimmy AUET2 10-1. 1. 10-1. 1. ∑ pT / δη δφ [GeV]. dNev 1 Nev d∑ p / δη δφ T. (a). 10. ATLAS 1 10-1 10-2 10-3. MC/Data. s = 7 TeV, 4.6 fb-1. 10-4. 1.8 1.6 1.4 1.2 1 0.8 0.6 0.4. Transverse region 20 GeV < pZT < 50 GeV. Data Pythia8 AU2 Sherpa Pythia6 Perugia2011C Powheg+Pythia8 AU2 Herwig++ UE-EE-3 Alpgen+Herwig+Jimmy AUET2 10-1. 1. 10-1. 1. ∑ pT / δη δφ [GeV]. (b) Fig. 7 Comparisons of data and MC predictions for the scalar pT sum density of charged particles, ∑ pT /δ η δ φ , for Z-boson transverse momentum, pZT , in the interval 20 − 50 GeV, in the the toward (a) and transverse (b) regions. The bottom panels in each plot show the ratio of MC predictions to data. The shaded bands represent the combined statistical and systematic uncertainties, while the error bars show the statistical uncertainties..
(18) dNev 1 Nev d∑ p / δη δφ T. 17. ATLAS. Trans-max region 20 GeV < pZT < 50 GeV. 10-1. Data Pythia8 AU2 Sherpa Pythia6 Perugia2011C Powheg+Pythia8 AU2 Herwig++ UE-EE-3 Alpgen+Herwig+Jimmy AUET2. 10-2 10-3 10-4. MC/Data. s = 7 TeV, 4.6 fb-1. 1. -1. 1.810 1.6 1.4 1.2 1 0.8 0.6 0.4. 1. 10-1. 10. 1. 10. ∑ p / δη δφ [GeV] T. dNev 1 Nev d∑ p / δη δφ T. (a). ATLAS 1. Trans-min region 20 GeV < pZT < 50 GeV. 10-1. Data Pythia8 AU2 Sherpa Pythia6 Perugia2011C Powheg+Pythia8 AU2 Herwig++ UE-EE-3 Alpgen+Herwig+Jimmy AUET2. 10-2 10-3 10-4. MC/Data. s = 7 TeV, 4.6 fb-1. -1. 1.810 1.6 1.4 1.2 1 0.8 0.6 0.4. 10-1. 1. 10. 1. 10. ∑ pT / δη δφ [GeV]. (b) Fig. 8 Comparisons of data and MC predictions for the scalar pT sum density of charged particles, ∑ pT /δ η δ φ , for Z-boson transverse momentum, pZT , in the interval 20 − 50 GeV, in the trans-max (a) and trans-min (b) regions. The bottom panels in each plot show the ratio of MC predictions to data. The shaded bands represent the combined statistical and systematic uncertainties, while the error bars show the statistical uncertainties..
(19) dNev 1 Nev dNch / δη δφ. 18. s = 7 TeV, 4.6 fb-1 Toward region. ATLAS 1 10-1 10-2 10-3 10-4. pZT < 5 GeV 20 GeV < pZ < 50 GeV T. pZT 10-5 0. > 110 GeV. 0.5. 1. 1.5. 2. 2.5. 3. 3.5. 4 4.5 Nch / δη δφ. dNev 1 Nev dNch / δη δφ. (a). s = 7 TeV, 4.6 fb-1 Transverse region. ATLAS 1 10-1 10-2 10-3 10-4. pZT < 5 GeV 20 GeV < pZ < 50 GeV T. pZT 10-5 0. 0.5. > 110 GeV 1. 1.5. 2. 2.5. 3. 3.5. 4 4.5 Nch / δη δφ. (b) Fig. 9 Distributions of charged particle multiplicity density, Nch /δ η δ φ , in three different Z-boson transverse momentum, pZT , intervals, in the toward (a) and transverse (b) regions. The error bars depict combined statistical and systematic uncertainties..
(20) dNev 1 Nev dNch / δη δφ. 19. s = 7 TeV, 4.6 fb-1 Trans-max region. ATLAS 1 10-1 10-2 10-3 10-4. pZT < 5 GeV 20 GeV < pZ < 50 GeV T. pZT 10-5 0. > 110 GeV. 0.5. 1. 1.5. 2. 2.5. 3. 3.5. 4 4.5 Nch / δη δφ. dNev 1 Nev dNch / δη δφ. (a). s = 7 TeV, 4.6 fb-1 Trans-min region. ATLAS 1 10-1 10-2 10-3 10-4. pZT < 5 GeV 20 GeV < pZ < 50 GeV T. pZT 10-5 0. 0.5. > 110 GeV 1. 1.5. 2. 2.5. 3. 3.5. 4 4.5 Nch / δη δφ. (b) Fig. 10 Distributions of charged particle multiplicity density, Nch /δ η δ φ , in three different Z-boson transverse momentum, pZT , intervals, in the trans-max (a) and trans-min (b) regions. The error bars depict combined statistical and systematic uncertainties..
(21) dNev 1 NevdNch / δη δφ. 20. 10. ATLAS 1 10-1 10-2. 10-4. 1.8 1.6 1.4 1.2 1 0.8 0.6 0.4. Toward region 20 GeV < pZT < 50 GeV. Data Pythia8 AU2 Sherpa Pythia6 Perugia2011C Powheg+Pythia8 AU2 Herwig++ UE-EE-3 Alpgen+Herwig+Jimmy AUET2. 10-3. MC/Data. s = 7 TeV, 4.6 fb-1. 0.5. 1. 1.5. 2. 2.5. 3. 3.5. 4. 4.5. 0.5. 1. 1.5. 2. 2.5. 3. 3.5. 4. 4.5. Nch / δη δφ. dNev 1 NevdNch / δη δφ. (a). 10. ATLAS 1 10-1 10-2. 10-4. 1.8 1.6 1.4 1.2 1 0.8 0.6 0.4. Transverse region 20 GeV < pZT < 50 GeV. Data Pythia8 AU2 Sherpa Pythia6 Perugia2011C Powheg+Pythia8 AU2 Herwig++ UE-EE-3 Alpgen+Herwig+Jimmy AUET2. 10-3. MC/Data. s = 7 TeV, 4.6 fb-1. 0.5. 1. 1.5. 2. 2.5. 3. 3.5. 4. 4.5. 0.5. 1. 1.5. 2. 2.5. 3. 3.5. 4. 4.5. Nch / δη δφ (b) Fig. 11 Comparisons of data and MC predictions for charged particle multiplicity density, Nch /δ η δ φ , for Z-boson transverse momentum, pZT , in the interval 20 − 50 GeV, in the toward (a) and transverse (b) regions. The bottom panels in each plot show the ratio of MC predictions to data. The shaded bands represent the combined statistical and systematic uncertainties, while the error bars show the statistical uncertainties..
(22) dNev 1 NevdNch / δη δφ. 21. ATLAS. Trans-max region 20 GeV < pZT < 50 GeV. 10-1. Data Pythia8 AU2 Sherpa Pythia6 Perugia2011C Powheg+Pythia8 AU2 Herwig++ UE-EE-3 Alpgen+Herwig+Jimmy AUET2. 10-2 10-3 10-4. MC/Data. s = 7 TeV, 4.6 fb-1. 1. 1.8 1.6 1.4 1.2 1 0.8 0.6 0.4. 0.5. 1. 1.5. 2. 2.5. 3. 3.5. 4. 4.5. 0.5. 1. 1.5. 2. 2.5. 3. 3.5. 4. 4.5. Nch / δη δφ. dNev 1 NevdNch / δη δφ. (a). ATLAS 1. Trans-min region 20 GeV < pZT < 50 GeV. 10-1. Data Pythia8 AU2 Sherpa Pythia6 Perugia2011C Powheg+Pythia8 AU2 Herwig++ UE-EE-3 Alpgen+Herwig+Jimmy AUET2. 10-2 10-3 10-4. MC/Data. s = 7 TeV, 4.6 fb-1. 1.8 1.6 1.4 1.2 1 0.8 0.6 0.4. 0.5. 1. 1.5. 2. 2.5. 3. 3.5. 4. 4.5. 0.5. 1. 1.5. 2. 2.5. 3. 3.5. 4. 4.5. Nch / δη δφ (b) Fig. 12 Comparisons of data and MC predictions for charged particle multiplicity density, Nch /δ η δ φ , for Z-boson transverse momentum, pZT , in the interval 20 − 50 GeV, in the trans-max (a) and trans-min (b) regions. The bottom panels in each plot show the ratio of MC predictions to data. The shaded bands represent the combined statistical and systematic uncertainties, while the error bars show the statistical uncertainties..
(23) T. <∑p / δη δφ> [GeV]. 22. 24 22 20 18 16 14 12 10 8 6 4 2 0. s = 7 TeV, 4.6 fb-1. ATLAS Transverse region Toward region Away region. 50 100 150 200 250 300 350 400 450 500. pZ [GeV] T. 5 4.5 4 3.5. T. <∑p / δη δφ> [GeV]. (a). s = 7 TeV, 4.6 fb-1. ATLAS Trans-max region Trans-min region Trans-diff region. 3. 2.5 2 1.5 1 0.5 0. 50 100 150 200 250 300 350 400 450 500. pZ [GeV] T. (b) Fig. 13 The average values of charged particle scalar ∑ pT density, h∑ pT /δ η δ φ i, as a function of Z-boson transverse momentum, pZT , in the transverse, toward and away regions (a), and in the trans-max, trans-min and trans-diff regions (b). The results are plotted at the center of each pZT bin. The error bars depict combined statistical and systematic uncertainties..
(24) MC/Data. <∑pT / δη δφ> [GeV]. 23. 2 1.8 1.6 1.4 1.2 1 0.8 0.6 0.4 0. 1.1 1.05. s = 7 TeV, 4.6 fb-1 Toward region. ATLAS. Data Pythia8 AU2 Powheg+Pythia8 AU2. Alpgen+Herwig+Jimmy AUET2 Sherpa Pythia6 Perugia2011C Herwig++ UE-EE-3. 20. 40. 60. 80. 100. 120. 140. 160. 180. 200. 20. 40. 60. 80. 100. 120. 140. 160. 180. 200. 1 0.95 0.9 0.85 0.8 0. pZ [GeV] T. <∑pT / δη δφ> [GeV]. (a). 2.5. s = 7 TeV, 4.6 fb-1 Transverse region. ATLAS. 2 1.5 1 Data Pythia8 AU2 Powheg+Pythia8 AU2. MC/Data. 0.5 0. 1.1 1.05. Alpgen+Herwig+Jimmy AUET2 Sherpa Pythia6 Perugia2011C Herwig++ UE-EE-3. 20. 40. 60. 80. 100. 120. 140. 160. 180. 200. 20. 40. 60. 80. 100. 120. 140. 160. 180. 200. 1 0.95 0.9 0.85 0.8 0. pZ [GeV] T. (b) Fig. 14 Comparison of data and MC predictions for charged particle scalar ∑ pT density average values, h∑ pT /δ η δ φ i, as a function of Z-boson transverse momentum, pZT , in the toward (a) and transverse (b) regions. The bottom panels in each plot show the ratio of MC predictions to data. The shaded bands represent the combined statistical and systematic uncertainties, while the error bars show the statistical uncertainties..
(25) MC/Data. <∑pT / δη δφ> [GeV]. 24. 4 3.5. s = 7 TeV, 4.6 fb-1 Trans-max region. ATLAS. 3 2.5 2 1.5 Data Pythia8 AU2 Powheg+Pythia8 AU2. 1 0.5 0 1.1 1.05 1 0.95 0.9 0.85 0.8 0. Alpgen+Herwig+Jimmy AUET2 Sherpa Pythia6 Perugia2011C Herwig++ UE-EE-3. 20. 40. 60. 80. 100. 120. 140. 160. 180. 200. 20. 40. 60. 80. 100. 120. 140. 160. 180. 200. pZ [GeV] T. MC/Data. <∑pT / δη δφ> [GeV]. (a). 1.4. s = 7 TeV, 4.6 fb-1 Trans-min region. ATLAS 1.2 1 0.8 0.6. Data Pythia8 AU2 Powheg+Pythia8 AU2. 0.4 0. 1.1 1.05. Alpgen+Herwig+Jimmy AUET2 Sherpa Pythia6 Perugia2011C Herwig++ UE-EE-3. 20. 40. 60. 80. 100. 120. 140. 160. 180. 200. 20. 40. 60. 80. 100. 120. 140. 160. 180. 200. 1 0.95 0.9 0.85 0.8 0. pZ [GeV] T. (b) Fig. 15 Comparison of data and MC predictions for charged particle scalar ∑ pT density average values, h∑ pT /δ η δ φ i, as a function of Z-boson transverse momentum, pZT , in the trans-max (a) and trans-min (b) regions. The shaded bands represent the combined statistical and systematic uncertainties, while the error bars show the statistical uncertainties..
(26) <Nch / δη δφ>. 25. 3. 2.5. s = 7 TeV, 4.6 fb-1. ATLAS Transverse region Toward region Away region. 2 1.5 1 0.5 0. 50 100 150 200 250 300 350 400 450 500. pZ [GeV] T. <Nch / δη δφ>. (a). 2.2 2 1.8 1.6. s = 7 TeV, 4.6 fb-1. ATLAS Trans-max region Trans-min region Trans-diff region. 1.4 1.2 1 0.8 0.6 0.4 0. 50 100 150 200 250 300 350 400 450 500. pZ [GeV] T. (b) Fig. 16 The average values of charged particle multiplicity density, hNch /δ η δ φ i , as a function of Z-boson transverse momentum, pZT , in the transverse, toward and away regions (a), and in the trans-max, trans-min and trans-diff regions (b). The results are plotted at the center of each pZT bin. The error bars depict combined statistical and systematic uncertainties..
(27) <Nch / δη δφ>. 26. 1.2. s = 7 TeV, 4.6 fb-1 Toward region. ATLAS. 1.1 1 0.9 0.8 0.7. Data Pythia8 AU2 Powheg+Pythia8 AU2. MC/Data. 0.6 0. 1.15. Alpgen+Herwig+Jimmy AUET2 Sherpa Pythia6 Perugia2011C Herwig++ UE-EE-3. 20. 40. 60. 80. 100. 120. 140. 160. 180. 200. 20. 40. 60. 80. 100. 120. 140. 160. 180. 200. 1.1 1.05 1 0.95 0.9 0.85 0. pZ [GeV] T. MC/Data. <Nch / δη δφ>. (a). 1.4 1.3 1.2 1.1 1 0.9 0.8 0.7 0.6 0. 1.15. s = 7 TeV, 4.6 fb-1 Transverse region. ATLAS. Data Pythia8 AU2 Powheg+Pythia8 AU2. Alpgen+Herwig+Jimmy AUET2 Sherpa Pythia6 Perugia2011C Herwig++ UE-EE-3. 20. 40. 60. 80. 100. 120. 140. 160. 180. 200. 20. 40. 60. 80. 100. 120. 140. 160. 180. 200. 1.1 1.05 1 0.95 0.9 0.85 0. pZ [GeV] T. (b) Fig. 17 Comparison of data and MC predictions for charged particle multiplicity density average values, hNch /δ η δ φ i , as a function of Z-boson transverse momentum, pZT , in the toward (a) and transverse (b) regions. The bottom panels in each plot show the ratio of MC predictions to data. The shaded bands represent the combined statistical and systematic uncertainties, while the error bars show the statistical uncertainties..
(28) <Nch / δη δφ>. 27. 1.8. s = 7 TeV, 4.6 fb-1 Trans-max region. ATLAS. 1.6 1.4 1.2 1 Data Pythia8 AU2 Powheg+Pythia8 AU2. MC/Data. 0.8 0.6 0 1.15 1.1 1.05 1 0.95 0.9 0.85 0. Alpgen+Herwig+Jimmy AUET2 Sherpa Pythia6 Perugia2011C Herwig++ UE-EE-3. 20. 40. 60. 80. 100. 120. 140. 160. 180. 200. 20. 40. 60. 80. 100. 120. 140. 160. 180. 200. pZ [GeV] T. <Nch / δη δφ>. (a). 1.1 1. s = 7 TeV, 4.6 fb-1 Trans-min region. ATLAS. 0.9 0.8 0.7 0.6. Data Pythia8 AU2 Powheg+Pythia8 AU2. MC/Data. 0.5 0. 1.15. Alpgen+Herwig+Jimmy AUET2 Sherpa Pythia6 Perugia2011C Herwig++ UE-EE-3. 20. 40. 60. 80. 100. 120. 140. 160. 180. 200. 20. 40. 60. 80. 100. 120. 140. 160. 180. 200. 1.1 1.05 1 0.95 0.9 0.85 0. pZ [GeV] T. (b) Fig. 18 Comparison of data and MC predictions for charged particle multiplicity density average values, hNch /δ η δ φ i , as a function of Z-boson transverse momentum, pZT , in the trans-max (a) and trans-min (b) regions. The bottom panels in each plot show the ratio of MC predictions to data. The shaded bands represent the combined statistical and systematic uncertainties, while the error bars show the statistical uncertainties..
(29) MC/Data. <∑pT / δη δφ> [GeV]. 28. 2.5. s = 7 TeV, 4.6 fb-1 Trans-diff region. ATLAS. 2 1.5 1 Data Pythia8 AU2 Powheg+Pythia8 AU2. 0.5 0. 1.1 1.05. Alpgen+Herwig+Jimmy AUET2 Sherpa Pythia6 Perugia2011C Herwig++ UE-EE-3. 20. 40. 60. 80. 100. 120. 140. 160. 180. 200. 20. 40. 60. 80. 100. 120. 140. 160. 180. 200. 1 0.95 0.9 0.85 0.8 0. pZ [GeV] T. <Nch / δη δφ>. (a). 1 0.9. s = 7 TeV, 4.6 fb-1 Trans-diff region. ATLAS. 0.8 0.7 0.6 0.5 0.4 Data Pythia8 AU2 Powheg+Pythia8 AU2. MC/Data. 0.3 0.2 0. 1.15. Alpgen+Herwig+Jimmy AUET2 Sherpa Pythia6 Perugia2011C Herwig++ UE-EE-3. 20. 40. 60. 80. 100. 120. 140. 160. 180. 200. 20. 40. 60. 80. 100. 120. 140. 160. 180. 200. 1.1 1.05 1 0.95 0.9 0.85 0. pZ [GeV] T. (b) Fig. 19 Comparison of data and MC predictions for charged particle scalar ∑ pT density average values, h∑ pT /δ η δ φ i (a), and multiplicity average values, hNch /δ η δ φ i (b) as a function of Z-boson transverse momentum, pZT , in the trans-diff region. The shaded bands represent the combined statistical and systematic uncertainties, while the error bars show the statistical uncertainties..
(30) <mean pT> [GeV]. 29. 1.5. s = 7 TeV, 4.6 fb-1 Toward region. ATLAS. 1.4 1.3 1.2 1.1 1 Data Pythia8 AU2 Powheg+Pythia8 AU2. MC/Data. 0.9 0.8 1.050. Alpgen+Herwig+Jimmy AUET2 Sherpa Pythia6 Perugia2011C Herwig++ UE-EE-3. 20. 40. 60. 80. 100. 120. 140. 160. 180. 200. 20. 40. 60. 80. 100. 120. 140. 160. 180. 200. 1 0.95 0.9 0.85 0. pZ [GeV] T. <mean pT> [GeV]. (a). 1.8. s = 7 TeV, 4.6 fb-1 Transverse region. ATLAS 1.6 1.4 1.2 1. Data Pythia8 AU2 Powheg+Pythia8 AU2. MC/Data. 0.8 1.050. Alpgen+Herwig+Jimmy AUET2 Sherpa Pythia6 Perugia2011C Herwig++ UE-EE-3. 20. 40. 60. 80. 100. 120. 140. 160. 180. 200. 20. 40. 60. 80. 100. 120. 140. 160. 180. 200. 1 0.95 0.9 0.85 0. pZ [GeV] T. (b) Fig. 20 Comparison of data and MC predictions for charged particle mean pT as a function of Z-boson transverse momentum, pZT , in the toward (a) and transverse (b) regions. The bottom panels in each plot show the ratio of MC predictions to data. The shaded bands represent the combined statistical and systematic uncertainties, while the error bars show the statistical uncertainties..
(31) MC/Data. <mean pT> [GeV]. 30. 1.4. s = 7 TeV, 4.6 fb-1 Toward region. ATLAS. 1.3 1.2 1.1 1 0.9 1.05. Data Pythia8 AU2 Powheg+Pythia8 AU2. Alpgen+Herwig+Jimmy AUET2 Sherpa Pythia6 Perugia2011C Herwig++ UE-EE-3. 5. 10. 15. 20. 25. 30. 35. 40. 45. 50. 5. 10. 15. 20. 25. 30. 35. 40. 45. 50. 1 0.95 0.9 0.85. Nch. MC/Data. <mean pT> [GeV]. (a). 1.6 1.5 1.4 1.3 1.2 1.1 1 0.9 0.8 1.05. s = 7 TeV, 4.6 fb-1 Transverse region. ATLAS. Data Pythia8 AU2 Powheg+Pythia8 AU2. Alpgen+Herwig+Jimmy AUET2 Sherpa Pythia6 Perugia2011C Herwig++ UE-EE-3. 5. 10. 15. 20. 25. 30. 35. 40. 45. 50. 5. 10. 15. 20. 25. 30. 35. 40. 45. 50. 1 0.95 0.9 0.85. Nch (b) Fig. 21 Comparison of data and MC predictions for charged particle mean pT as a function of charged particle multiplicity, Nch , in the toward (a) and transverse (b) regions. The bottom panel in each plot shows the ratio of MC predictions to data. The shaded bands represent the combined statistical and systematic uncertainties, while the error bars show the statistical uncertainties..
(32) dNev 1 NevdNch / δη δφ. 31. 10 ATLAS. s = 7 TeV. Trans-max region. Data 2011: Z events (4.6 fb-1) Data 2010: Jet events (137 pb-1). 1. Z, leadjet. 20 GeV < pT. < 60 GeV. 10-1 10-2 10-3. Z events Jet events. 10-4 0. 1. 2. 3. 4. 5. 6. Nch / δη δφ. dNev 1 NevdNch / δη δφ. (a). 10 ATLAS. s = 7 TeV. Trans-min region. Data 2011: Z events (4.6 fb-1) Data 2010: Jet events (137 pb-1). 1. Z, leadjet. 20 GeV < pT. < 60 GeV. 10-1 10-2 10-3. Z events Jet events. 10-4 0. 1. 2. 3. 4. 5. 6. Nch / δη δφ (b) Fig. 22 Distributions of charged particle multiplicity density, Nch /δ η δ φ , compared between jet and Z-boson events, respectively in Z-boson leadjet transverse momentum, pZT and leading jet transverse momentum , pT interval between 20 − 60 GeV, in the trans-max (a) and trans-min (b) regions. The error bars in each case show the combined statistical and systematic uncertainties..
Figure

+7

Documento similar
In conclusion, we have presented the first measurement of two event-shape variables, the central transverse thrust and the central thrust minor, using a data sample of
The parametrisation of the interpolating functions φ k (m b ) describing the dependence of the differential b-jet shapes with the b-quark mass is done using second-order polynomials
130 Faculty of Mathematics and Physics, Charles University in Prague, Praha, Czechia 131 State Research Center Institute for High Energy Physics (Protvino), NRC KI, Russia 132
33 (a) Institute of High Energy Physics, Chinese Academy of Sciences, Beijing; (b) Department of Modern Physics, University of Science and Technology of China, Anhui; (c) Department
Institute of High Energy Physics, Chinese Academy of Sciences, Beijing; (b) Department of Modern Physics, University of Science and Technology of China, Anhui; (c) Department
6 High Energy Physics Division, Argonne National Laboratory, Argonne, IL, United States of America 7 Department of Physics, University of Arizona, Tucson, AZ, United States of
The impact of contamination due to pair produced top quarks contaminating the signal or control regions has been explicitly evaluated and is observed to be less than 5% (10%) for
6 High Energy Physics Division, Argonne National Laboratory, Argonne, IL, United States of America 7 Department of Physics, University of Arizona, Tucson, AZ, United States of
