Application of strategies of advanced control under the active disturbance rejection control, to produce lipids from microalgae
40
0
0
Texto completo
(2) APPLICATION OF STRATEGIES OF ADVANCED CONTROL UNDER THE ACTIVE DISTURBANCE REJECTION CONTROL, TO PRODUCE LIPIDS FROM MICROALGAE. Eng. Claudia Lorena Garzón-Castro M.Sc. Thesis Advisors: Dr. John Alexander Cortés Romero Dr. Edisson Tello Camacho. BIOSCIENCE PhD PROGRAM UNIVERSIDAD DE LA SABANA Chía, Colombia 2017.
(3) To my beloved son Daniel Camilo. To my family for their understanding and support during these four years. In memory of my best friend, Ruth Gisela Reina Hernández, you left us very soon. To you.
(4) Acknowledgments It is with great pleasure that I sincerely thank all the people who contributed to the realization of this doctoral thesis. First, I would like to thank my directors, Dr. John Alexander Cortés Romero and Dr. Edisson Tello Camacho, for their constant direction, contribution, and willingness, but especially for their support and friendship during these years. I’d like to thank Universidad de La Sabana, especially the DIN for financing the development of the ING-140-2013 “Aplicación de técnicas de control proporcional integral generalizado al crecimiento de la microalga Scenedesmus obliquus” project. Additionally, I would like to thank COLCIENCIAS for the “Doctorado Nacional-617” and the Canadian Government ELAP (Emerging Leaders in the Americas Program) Scholarship given to me. I would also like to thank the directors of the University and the Faculty for the support provided, especially Mg. Luz Ángela Vanegas, PhD Leonor Botero, M.Sc Elizabeth Cabra, PhD Carlos Jiménez, Eng. Luis Fernando López and Adm. Adriana Cortés, for their support and management during my doctoral studies. To MBA Marcela Ordoñez, for her friendship, caring, laughter, advice and prayers at the precise moments. Thanks to my coworkers, especially Mg. Luis Miguel Beltrán, MBA Germán Ortiz, M.Sc Erlide Prieto and PhD Martha Cobo, for sharing their happiness on every step I took. I want to thank my students from the INFOSEED research group, to whom I had the opportunity of accompanying in the process to obtaining the degree of Engineer, and from whom I learned a lot: Eng. Diana Ximena Hurtado V., Eng. Diego Andrés Porras M. and Eng. Nicolás Fernando Ramírez P. Thanks for your contributions to the implementation of the prototypes that we had in the laboratory, I know that each one of you gave and continues giving the best. To my friend, Eng. Diego Russy, for his interest in the evolution of this research and his engineering advices. I thank at Dalhousie University, principally at PhD Gianfranco Mazzanti for his support during and after my doctoral stay, but especially for his contribution in the different academic discussions we held, it was the most enriching for me. To John Zambrano, Andrés Carrera, Yaneth Tután, Laura Gómez, Leidy Garnica, Edilma Cruz, Gladys Moncada, Berly Guzmán, Ester Quintero, Martha Guerrero, Pilar Gómez, Antonio Cuervo, Jorge Rodríguez, María Sanabria, Sandra Zambrano, Alejandra Nieto, Lucila Rodríguez and Ricardo Vargas, for their collaboration and the love they did their work. To my colleagues in the Doctorate in Biosciences, especially M.Sc Stephania Aragón for their friendship. As well to my colleagues at the National University, especially M.Sc Efredy.
(5) Delgado and M.Sc Andrés Beltrán for listening to my ideas and being aware of the evolution of this research. To Darida Gutiérrez, for taking care of my greatest treasure as if he were hers. Last but not least, I want to thank God and dedicate this work to my family whom I love infinitely. Hermencia and Gustavo, because I had the fortune of having them as my guide and parents, they are my strength, my joy, but more than anything else they give me the most perfect and unconditional love. To my sisters, Rocio del Pilar and Luz Adriana, to my brother, Gustavo Ernesto, because they were always there encouraging me to go ahead and supporting me unconditionally. To my brothers-in-law, Manuel and Igal, my sister-in-law María Angélica, my godparents, Alfredo and Alcira, and my aunt Isabel, for their interest in this work and in my well-being. To my son, Daniel Camilo, who is the engine, the force and the thrust of my life. To each one of you thanks for your love and great dose of patience. In general, I want to thank all those who had me in their hearts and for their acts of support were always present to give me the necessary strength to continue this wonderful work. Truly, thank you all, this was another magnificent and enriching experience..
(6) Abstract In this research, advanced control strategies were designed under the Active Disturbance Rejection Control (ADRC) approach to increase the biomass production in microalgae cultures. For the above, from a control frame of reference, the development was envisaged into two stages, control and optimization. The first stage resulted in three different controllers designs: two ADRC strategies assisted by observer and a Model-Free Control (MFC). In each case, the aim was to guarantee the tracking of the reference signal. In the second stage, the design of two optimization strategies were achieves to increase the biomass production, offline and on-line. Comparing, at a simulation level, these strategies with other existing proposals, the following was found: 1) the ADRC strategies assisted by observer had a few dependence on the model, letting us to work with an approximate model that only required knowing of the system order and the input gain; 2) the off-line optimization, despite maximizing the biomass production, required knowing the model and 3) the proposal that combines MFC with on-line optimization, may act on any microalgae culture since it does not need a model. All the proposals are robust front to disturbances and variation of parameters allowing to increase the biomass production when an optimization strategy is used.. Keywords: Active Disturbance Rejection Control, Model-Free Control, optimization, nonlinear system, microalgae culture, biomass production.
(7) Resumen En esta investigación se diseñaron estrategias de control avanzado bajo el enfoque del rechazo activo de perturbaciones (ADRC, Active Disturbance Rejection Control) para incrementar la producción de biomasa en cultivos de microalgas. Para lo anterior, desde el punto de vista del control, esta investigación se planeó en dos etapas: control y optimización. La primera etapa resultó en tres diseños diferentes de controladores: dos estrategias ADRC asistida por observador y un control libre de modelo (MFC, Model-Free Control). En cada caso, el objetivo fue garantizar el seguimiento de la señal de referencia. En la segunda etapa, se realizaron dos diseños de estrategias de optimización con el fin de incrementar la producción de biomasa, una fuera de línea y una en línea. Al comparar, a nivel de simulación, estas estrategias con otras propuestas ya existentes, se encontró que: 1) las estrategias ADRC asistidas por observador tienen poca dependencia del modelo, permitiendo trabajar con un modelo aproximado que solo requiere conocer el orden del sistema y la ganancia de entrada; 2) la optimización fuera de línea aunque logra maximizar la producción de biomasa requiere conocer el modelo y 3) la propuesta que combina MFC con la optimización en línea, puede actuar sobre cualquier cultivo de microalgas ya que no necesita de un modelo. Todas las propuestas son robustas frente a perturbaciones permitiendo incrementar la producción de biomasa cuando se hace uso de una estrategia de optimización.. Palabras clave: Control de rechazo activo de perturbaciones, control libre de modelo, optimización, sistema no lineal, cultivo de microalgas, producción de biomasa.
(8) Table of contents List of figures ........................................................................................................................ xi List of tables ........................................................................................................................ xiii INTRODUCTION ................................................................................................ 1 References ........................................................................................................................... 2 OBJECTIVES ....................................................................................................... 4 2.1 General Objective ......................................................................................................... 4 2.2 Specific Objectives ....................................................................................................... 4 2.3 Objectives-articles relationship................................................................................... 4 2.4 Status of written articles .............................................................................................. 6 2.5 Individual’s contributions ............................................................................................ 7 RESULTS ........................................................................................................... 10 3.1 Active Disturbance Rejection Control for Growth of Microalgae in a Batch Culture ...................................................................................................................... 10 Abstract ............................................................... …………………………………..10 Graphic abstract ........................................................................................................ 10 Highlights.................................................................................................................. 11 Abbreviations ............................................................................................................ 11 3.1.1Introduction…………………..………………………………………………………………………………………12 3.1.2Bioprocess model…..…………………………………………………………………………..…………………13 3.1.2.1.Radiative Model ………………………………………...……………………………………………..13 3.1.2.2 Model of photosynthetic growth……………………….……………….……………………..14 3.1.2.3 Online estimate of biomass concentration………………………………………………..15 3.1.3 Structure of observer based control………………………………………………………….…………15 3.1.3.1Approach to the control problem……….…………….………………..………………………16 3.1.3.2Control design…………………………………………………………………………………………….…16 3.1.3.3Proposed control……………………..……………………..……………………………………………..17 3.1.3.4GPI observer…………………………..………………………………..…………………………………..18 3.1.3.5 Obtaining optimal growth rate…………………………………………………………………..18 3.1.4 Results…………………………………………………………………………………………………………………..19 3.1.4.1 Behavior under normal conditions……………………………………………………………19 3.1.4.2 Behavior with variation of parameters……………………………………………………..21 3.1.5 Conclusions…………………………………………………………………………………………………………..22 References ................................................................................................................. 23 3.2 Performance of an active disturbance rejection control on a simulated continuous microalgae photobioreactor .............................................................................................. 26 Abstract ..................................................................................................................... 26 Graphic abstract ........................................................................................................ 26 Highlights.................................................................................................................. 27.
(9) viii. Table of contents. Abbreviations ............................................................................................................ 27 3.2.1Introduction………………………………………………..……………………………………………………..….27 3.2.2 Material and methods…………………………………………………………………………………………..29 3.2.2.1 Photobioreactor…………………………………………………………………………………………..29 3.2.2.2 Growth and illumination Model………………………………………………………………..30 3.2.2.3Selection of a reference cell number and light intensity and their relation with productivity ......................................................................................................... 32 3.2.3 Preliminaries…………………………………………………………………………………………………………33 3.2.3.1 GPI observer………………………………………………………………………..…………………….34 3.2.3.2Control law used by the controller………………………………………………….………….36 3.2.4 Structure of the control………………………………………………………………………………………..36 3.2.4.1 Problem statement………………..……………………………………………………………………37 3.2.4.2 Design of the ADRC structure………………………………………………………………….37 3.2.5 Numerical Simulations: results and discussions………………………………………………..39 3.2.5.1 . Nominal case……………………………………………………………………………………………..39 3.2.5.2 . Disturbance rejection cases……………………………………………………….……………..40 3.2.5.3 . Variation of parameters……………………………………………………………….……………43 3.2.5.4 . Response of the control input to the growth rate…………………..……………….46 3.2.6 Conclusions…………………………………………………………………………………………………………..48 References ................................................................................................................. 48 3.3 Optimal decision curve of light intensity to maximize the biomass concentration in a batch culture ................................................................................................................ 53 Abstract ............................................................................................................................... 53 Graphic abstract ................................................................................................................. 53 Highlights............................................................................................................................ 53 Abbreviations ..................................................................................................................... 54 3.3.1 Introduction………………………………………………………………………………..…………………………54 3.3.2 Material and methods………………………………………..…………………………………………………56 3.3.2.1 Culture medium and conditions………………………………………………………………..56 3.3.2.2 Photobioreactor………………………………………………………………………………………….56 3.3.2.3Radiative Model……………………………………………………………………….…………………57 3.3.2.4 Modeling of Photosynthetic Growth…………………………………………….………….57 3.3.2.5 Problem statement……………………………………………………………………………………..58 3.3.2.6 Justification of the chosen solution…………………………………………………………..58 3.3.2.7 Proposed algorithm…………………………………………………………………………………….59 3.3.3. Results and discussions………….….……………………………………………………………………….63 3.3.3.1 Optimization of the Light-to-Microalga Ratio…………………………..……………63 3.3.3.2 .Simulations results…………………………………………………………………………………….64 3.3.4. Conclusions……………………………………………………………………………….………………………..69 References ................................................................................................................. 69 3.4 Performance of Model Free Control and heuristic optimization for growth of microalgae in a batch culture .................................................................................... 73 Abstract ..................................................................................................................... 73 Graphic abstract ........................................................................................................ 73.
(10) ix. Table of contents. Highlights.................................................................................................................. 73 Abbreviations ............................................................................................................ 74 3.4.2 Introduction……………..………………………………………………………………..…………………………74 3.4.2 System description….………………………………………………………………..…………………………76 3.4.2.1 Photobioreactor…………………………………………..………………………………..……………76 3.4.2.2 Radiative model……………………………………………….…………………………..……………77 3.4.2.3 Modeling of photosynthetic growth..…………….…………………………..…………… 77 3.4.2.4 .Cell counting….…….………………………………………….…………………………..……………78 3.4.3. Hierarchical control architecture…………………..……………………………………………..……78 3.4.3.1 . Problem formulation……………………………………….…………………………..……………79 3.4.3.2Optimization layer: reference generation .…….…………………………..…………… 79 3.4.3.3 Control layer: Model Free Control ………………….………………………..……………81 3.4.3.4 GPI Observer ………………….………………………….……………..………………………..……82 3.4.4. Results and discussion……………………………………………………………..…………………………83 3.4.4.1 Tracking of the reference value……………………….…………………………..……………84 3.4.4.2 Nominal case……………………………..…………………….…………………………..……………84 3.4.4.3 Disturbance rejection………………..…………………….…………………………..……………86 3.4.4.4 . Variation of parameters…………..…………………….…………………………..……………88 3.4.5. Conclusion………………………………………………………………………………..…………………………89 References ................................................................................................................. 89 3.5 A comparison of lipid extraction methods for the microalgae Acutodesmus obliquus..................................................................................................................... 93 Abstract ..................................................................................................................... 93 Graphic abstract ........................................................................................................ 93 Highlights ................................................................................................................. 93 Abbreviations ............................................................................................................ 94 3.5.1 Introduction……………………………...……………………………………………….………………………..94 3.5.2. Methodology…………………………….………………………………………………..……………………..95 3.5.2.1 Microorganism and crop medium……………………………….………………………..….95 3.5.2.2 System generalities…………….…………………………..……..…………………………………..95 3.5.2.3Experimental conditions……….…………………………………………………………………….96 3.5.2.4 Analytical determinations………………………………………………………………………….96 3.5.2.5 Extraction Method………………………………………………………………………………………97 3.5.2.6 Lipid identification…….……………….………………………………………………………………97 3.5.2.7 Statistical analysis……………………..……………………………………………………………….98 3.5.3 Results and discussion……………….……………………………………………….……………………….98 3.5.3.1 Experimental conditions……………………………………………………………………………98 3.5.3.2 .Red Nile method for detecting lipid vacuoles…………………………………………99 3.5.3.3 Extraction methods………………………………………………………………………………….100 3.5.3.4 Lipid characterization………………………………………………………………………………102 3.5.4 Conclusions…………………………………………..…………………………………………………………….104 References ............................................................................................................... 105.
(11) x. Table of contents. 3.6 Use the combined strategy of wavelenghts and light intensities in a batch culture of Acutodesmus obliquus ................................................................................................ 108 Abstract ................................................................................................................... 108 Graphic abstract ...................................................................................................... 108 Highlights ............................................................................................................... 108 Abbreviations .......................................................................................................... 109 3.6.3Introduction……………..……..………….……………………………………………….………………………109 3.6.3 Methodology…………..……..………….……………………………………………….………………………110 3.6.2.1 Microorganism and broth medium…………………………………..……….…………….110 3.6.2.2 System generalities………………………………..……………………….………………………..111 3.6.2.3 Experimental conditions………………………………..……………………….…………….….112 3.6.2.4 Analytical determinations……………………………..……………………….…………….….112 3.6.2.5 Extraction Method……………………………………………………………………………………112 3.5.2.6 Lipid identification…….……………….……………………………………………………………112 3.6.3Results and discussion……………….……………………………………………….………………………113 3.6.3.1 . Experimental conditions…………………………………………………………………………113 3.6.3.2 Obtaining cells concentration……………………..…………………………………………113 3.6.3.3 Lipids production………………….……………………..…………………………………………114 3.6.3.4Characterization and production of esters………………………………………….……115 3.6.4Conclusions……………….…………………….………………………………………….………………………119 References ............................................................................................................... 120. CONCLUSION AND FUTURE WORK ........................................................ 125 5.1 Conclusion ................................................................................................................. 125 5.2 Future work ............................................................................................................... 125.
(12) List of figures Figure 2.1. Structure of the document and published papers ................................................. 6 Figure 3.1.1. General diagram of the control proposal ......................................................... 16 Figure 3.1.2. Determination of μopt ....................................................................................... 19 Figure 3.1.3. Signal tracking reference (μopt) ....................................................................... 20 Figure 3.1.4. Control signal behavior (q0(t)) ........................................................................ 20 Figure 3.1.5. Biomass concentration (CX) obtained in 150 h ............................................... 20 Figure 3.1.6. Behavior of reference signal versus changes in KI.......................................... 21 Figure 3.1.7. Biomass concentration (CX) versus changes in KI .......................................... 22 Figure 3.1.8. Biomass of reference signal versus changes in KII ......................................... 22 Figure 3.1.9. Biomass concentration (CX) versus changes in KII.......................................... 22 Figure 3.2.1. Schematic representation of a generic bubble column photobioreactor ......... 30 Figure 3.2.2. Dilution rate, DSS(t), and productivity, P(t), as function of CX*(t) and Iin at the steady state .................................................................................................................... 33 Figure 3.2.3. Conceptual diagram of the ADRC structure and signals flow ........................ 37 Figure 3.2.4. Temporal evolution of the cell number of microalgae (CX(t)), the dilution rate (D(t)) and the specific growth rate (μ(t)) under nominal conditions. ............................ 40 Figure 3.2.5. Conceptual diagram of the signals flow when the disturbance is present ...... 41 Figure 3.2.6. Temporal evolution of the cell number of microalgae (CX(t)), the dilution rate (D(t)) and the specific growth rate (μ(t)) with disturbances. Left column (a,b,c), sharp disturbance. Right column (c,d,e), smooth disturbance ................................................ 42 Figure 3.2.7. Temporal evolution of the cell number of microalgae (CX(t)), the dilution rate (D(t)) and the specific growth rate (μ(t)) whit variations in CX*(t). .............................. 42 Figure 3.2.8. Temporal evolution of the cell number of microalgae (CX(t)), the dilution rate (D(t)) and the specific growth rate (μ(t)) whit variations in μmax. The left column corresponds to the step-wise increase in the maximum growth rate. The right column to the positive and negative 30% variation of the nominal value. .................................... 44 Figure 3.2.9. Temporal evolution of: dilution rate (D(t)), the specific growth rate (μ(t)) and the cell number of microalgae (CX(t)) with variations in Iin. The left column corresponds to the step-wise increase in light intensity. The right column to the positive and negative 30% variation of the nominal value. ........................................................ 44 Figure 3.2.10. Plots of D(t) as a function of μ(t). Stages have been labelled with roman numerals. The arrows indicate the direction of time. .................................................... 47 Figure 3.2.11. Plots of D(t) as a function of μ(t) during step variations of μmax and Iin. Stages have been labelled with roman numerals. The arrows indicate the direction of time. .. 47 Figure 3.3.1. Schematic representation of PBR.................................................................... 57 Figure 3.3.2. Variation of μp(q0) with values of CX constant ................................................ 60 Figure 3.3.3. Behavior of q0MAX(CX) and q0*(CX).................................................................. 61 Figure 3.3.4. Behavior of μMAX(CX) ...................................................................................... 61 Figure 3.3.5. Optimal decision curve for intensity of q0* ..................................................... 62 Figure 3.3.6. Flowchart of the proposed algorithm .............................................................. 62 Figure 3.3.7. System block diagram ..................................................................................... 62 Figure 3.3.8. Comparison of constant light, a light-to-microalgae ratio and optimal decision curve in nominal conditions .......................................................................................... 65.
(13) xii. List of figures. Figure 3.3.9. Comparison of constant light, a light-to-microalgae ratio and optimal decision curve with perturbations ................................................................................................ 67 Figure 3.3.10. Comparison of constant light, a light-to-microalgae ratio and optimal decision curve with variation of parameters ................................................................................ 68 Figure 3.4.1. Schematic representation of a generic flat rectangular PBR ........................... 77 Figure 3.4.2. Conceptual diagram of the hierarchical control architecture and signals flow. ....................................................................................................................................... 79 Figure 3.4.3. Temporal evolution of reference signal. Left figure (a), reference signal in the first stage. Right figure (b), reference signal in the second stage ................................. 80 Figure 3.4.4. Flowchart of the heuristic optimization proposed ........................................... 81 Figure 3.4.5. Optimal generated reference, μ*(t) .................................................................. 81 Figure 3.4.6. Temporal evolution of the specific growth rate (μ(t)), the light intesity (q0(t)) according to tracking of the reference value ................................................................. 84 Figure 3.4.7. Comparison of model free control, optimal decision curve and constant light under nominal conditions .............................................................................................. 85 Figure 3.4.8. Comparison of model free control, optimal decision curve and constant light with disturbances. Left column (a,b,c), positive disturbance. Right column (c,d,e), negative disturbance ...................................................................................................... 87 Figure 3.4.9. Comparison of model free control, optimal decision curve and constant light with variation of parameters .......................................................................................... 88 Figure 3.5.1. Components of the system: A) PLC, B) boards, C) sensors and actuators, D) Human-Machine Interface (HMI) and E) production system ....................................... 95 Figure 3.5.2. Number of living cells produced during the 15 days experiment with different nitrogen concentrations ................................................................................................. 99 Figure 3.5.3. A. obliquus cell stained with Nile red during growth. The yellow dots are lipids. (A) Inoculum (1st day). (B) Time 1 (3rd day of cultivation). (C) Time 2 (7th day of cultivation). (D) Time 3 (9th day of cultivation). (E) Time 4 (11th day of cultivation). (F) Time 5 (15th day of cultivation).............................................................................. 99 Figure 3.5.4. Cell concentration (blue bar). Protein concentration in milligrams per milliliter (-). Lipid vacuoles (-) produced during 15 days of experimentation. ......................... 100 Figure 3.5.5. Lipid extraction efficiency according to method .......................................... 101 Figure 3.5.6. Box and whiskers diagram for the means of lipid weight of each treatments ..................................................................................................................................... 102 Figure 3.5.7. FTIR spectrum of the different extraction methods. Ultrasonic (Green Line), Classical (Orange Line), Microwave (Blue Line), Soxhlet (Black Line). .................. 103 Figure 3.6.1. Components of the system: A) PLC, B) boards, C) sensors and actuators, D) Human-Machine Interface (HMI) and E) production system. .................................... 111 Figure 3.6.2. Cell concentration according to intensity and color of the light ................... 114 Figure 3.6.3. Lipids production according to intensity and color of the light .................... 114 Figure 3.6.4. Cell concentration and lipids production according to intensity and color of the light.............................................................................................................................. 115 Figure 3.6.5. Methyl esters production with violet light at different intensities ............... 116 Figure 3.6.6. Methyl esters production with yellow light at different intensities .............. 116 Figure 3.6.7. Methyl esters production with green light at different intensities ................ 117 Figure 3.6.8. Methyl esters production with red light at different intensities ................... 118.
(14) List of tables Table 2.1. Status of written articles ........................................................................................ 6 Table 2.2. Individual’s contribution ....................................................................................... 7 Table 3.1.1. Model parameters ............................................................................................. 15 Table 3.1.2. Comparison NMPC and ADRC strategies ....................................................... 21 Table 3.2.1. Model parameters ............................................................................................. 21 Table 3.2.2. Values of D(t) = μ(t) and TIC as time → ∞, for the different values of Iin. ..... 46 Table 3.3.1. Model parameters ............................................................................................. 63 Table 3.3.2. Results with a constant light, a light-to-microalgae ratio and optimal decision curve in nominal conditions .......................................................................................... 66 Table 3.3.3 Results with a constant light, a light-to-microalgae ratio and optimal decision curve with perturbations ................................................................................................ 67 Table 3.3.4. Results with a constant light, a light-to-microalgae ratio and optimal decision curve with variation of μ0 .............................................................................................. 68 Table 3.4.1. Model parameters ............................................................................................. 84 Table 3.4.2. Results with a constant light, optimal decision curve and model free control under nominal conditions .............................................................................................. 86 Table 3.4.3. Results with a constant light, optimal decision curve and model free control with perturbations .................................................................................................................. 87 Table 3.4.4. Results with a constant light, optimal decision curve and model free control with variation of parameters .................................................................................................. 89 Table 3.5.1. Statistical probability for comparisons of treatments ..................................... 100 Table 3.5.2. Biomass and lipids extracted from different types of extractions .................. 101 Table 3.5.3. Relative amounts of acids obtained with the different extraction methods.... 104 Table 3.6.1. Methyl esters in major percentage giving to intensity and color.................... 104 Table A.1. Physical variables that affecting the growth of microalgae.............................. 126 Table A.2. Some control strategies used for microalgae cultures………………………….127 Table A.3. Some optimization methods applied in cultures of microalgae………………..128.
(15) INTRODUCTION Control Engineering plays a fundamental role in modern technological systems. This has been motivated by the fact that many real-world control problems involve nonlinear effect (Goodwin, Graebe, & Salgado, 2000), which require control systems to deal with changes in the operating conditions of the plant. Some examples of nonlinear systems are: braking systems in sport motorcycles (Formentin, De Filippi, Tanelli, & Savaresi, 2010), helicopter system (Boubakir, Labiod, Boudjema, & Plestan, 2014), in the medical area in the regulation of glycemia of Type-1 Diabetes (MohammadRidha & Moog, 2015), and in general biological processes as the based-on microalgae (Bernard, 2011). Microalgae are unicellular organisms that have become a new natural resource with great potential and of high interest for the industry as for the research centers (Ben-Amotz, 2008; Bernard, 2011). The processes based on microalgae imply new challenges in both modeling and control, owed to their non-linear and time-varying behavior mainly due to the attenuation of light given by cell growth (Abdollahi & Dubljevic, 2012; Bernard, 2011). The determination of the process variables that help increase biomass and metabolite production is a more elaborate control problem and has not been fully explored (Vonshak & Torzillo, 2004). It is possible to establish that the composition of the biomass, the total specific growth rate and the formation of metabolites as the lipids, depend strongly of the culture conditions as: temperature, pH-CO2, stirring, light/dark cycles and the most important: light intensity. See Table A.1. Therefore, to increase production it is possible handle the problem with a control strategy, where the variable to be maximized is the reference signal. An appropriate optimization of the reference signal and an adequate control of the process will guarantee an increase of the biomass production. There are many proposals that involve the use of different strategies of advanced control used in microalgae cultures, see Table A.2. In most of these cases, it is necessary the knowledge of a precise model that can lead to an inadequate management of uncertainties. Additionally, those proposals imply greater complexity in the tuning and implementation of the controller. Therefore, the admission of a certain level of uncertainty in the system parameters cannot be guaranteed, and in this case, the performance of the control will not be satisfactory (Fliess & Join, 2013; Gao, 2006; Mandonski, Gao, Lakomy, 2015). In terms of optimization, all proposals have high dependence of the information given by the model, some examples are shown in the Table A.3. This poses the following question: Is it possible to guarantee the increase of lipid production in microalgae by the application of advanced control strategies based on the active disturbance rejection? To answer this question, the physical variables that affect the microalgae were studied; the most relevant was chosen: the intensity of the light. Subsequently, different existing models were reviewed, one was chosen for batch cultures and another for continuous cultures. With these models, different control designs were made using strategies based on the disturbance rejection. Additionally, several optimization forms were proposed, always looking for a minimum dependence on the model..
(16) 2. Introduction. As a results of this thesis, two Active Disturbance Rejection Control (ADRC), an off-line optimization and Model-Free Control (MFC) with on-line optimization strategies to the microalgae bioprocess, were proposed. Compared to other control strategies, ADRC is less dependent of the information given by the model, and it allows working with an approximate model that only requires the knowledge of the order of the system and its input gain. While using MFC and heuristic optimization, the need of any mathematical model disappears. Other advantages of ADRC and MFC are a straightforward design, an effective linear approach, and high robustness. These advantages allow working with highly uncertain system models. This thesis is organized in six chapters. The first chapter offers a brief presentation of the state of the art and the research question. Chapter 2 presents the objectives of the study and its relationship with each of the written articles, also, the contribution of each author. Chapter 3 contains the results obtained during the development of this research, presented as articles. Next in the chapter 4, a discussion of results is presented. Then, conclusion and future work are outlined in Chapter 5. Finally, the annexes are in Chapter 6.. References Abdollahi, J., & Dubljevic, S. (2012). Lipid production optimization and optimal control of heterotrophic microalgae fed-batch bioreactor. Chemical Engineering Science, 84, 619– 627. https://doi.org/10.1016/j.ces.2012.09.005 Ben-Amotz, A. (2008). Bio-fuel production by marine microalgae conversion of electric power plant wastes to bio-diesel and bio-ethanol. Journal of Biotechnology, 136S, S523. https://doi.org/10.1016/j.jbiotec.2008.07.1228 Bernard, O. (2011). Hurdles and challenges for modelling and control of microalgae for CO 2 mitigation and biofuel production. Journal of Process Control, 21(10), 1378–1389. https://doi.org/10.1016/j.jprocont.2011.07.012 Boubakir, A., Labiod, S., Boudjema, F., & Plestan, F. (2014). Model-free controller with an observer applied in real-time to a 3-DOF helicopter. Turkish Journal of Electrical Engineering & Computer Sciences, 22, 1564–1581. https://doi.org/10.3906/elk-120454 Formentin, S., De Filippi, P., Tanelli, M., & Savaresi, S. M. (2010). Model-free control for active braking systems in sport motorcycles. In IFAC (Ed.), 8th IFAC Proceedings Volumes (IFAC-PapersOnline) (pp. 873–878). Italy: IFAC. https://doi.org/10.3182/20100901-3-IT-2016.00094 Fliess, M., & Join, C. (2013). Model-free control. International Journal of Control, 86(12), 2228–2252. https://doi.org/10.1080/00207179.2013.810345 Gao, Z. (2006). Active disturbance rejection control: A paradigm shift in feedback control system design. In Proceedings of the 2006 American Control Conference (pp. 2399– 2404). Minneapolis, Minnesota, USA: IEEE Goodwin, G. C., Graebe, S. F., & Salgado, M. E. (2000). The excitement of control engineering. In Control system design (pp. 5–20). Valparaíso (Chile): Pearson Education. Mandonski, R.; Zhiqiang, Gao; Lakomy, K. (2015). Towards a turnkey solution of industrial control under the active disturbance rejection paradigm. In 54th Annual Conference of.
(17) 3. Introduction. the Society of Instrument and Control Engineers of Japan (SICE) (pp. 616–621). Hangzhou: IEEE. https://doi.org/10.1109/SICE.2015.7285478 MohammadRidha, T., & Moog, C. H. (2015). Model Free Control for Type-1 Diabetes: A Fasting-Phase Study. IFAC-PapersOnLine, 48(20), 76–81. https://doi.org/10.1016/j.ifacol.2015.10.118 Vonshak, A., & Torzillo, G. (2004). Environmental stress physiology. In Amos Richmond (Ed.), Handbook of microalgal culture: Biotechnology and Applied Phycology (pp. 57– 82). United Kingdom: Blackwell. https://doi.org/10.1002/978047099528.
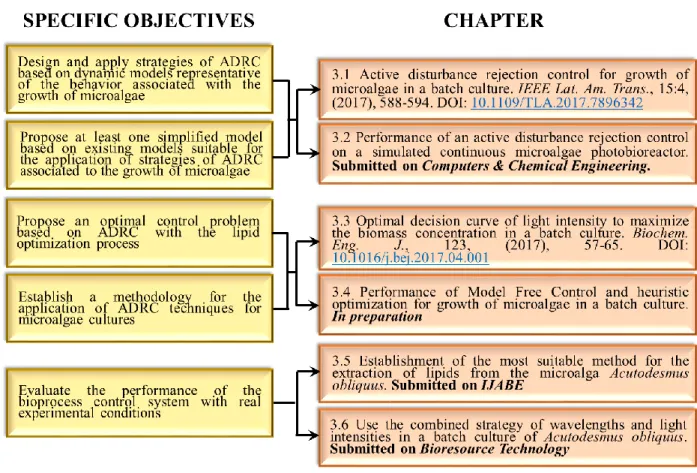
(18) OBJECTIVES 2.1. General Objective. Design and apply strategies of advanced control under the approach of Active Disturbance Rejection Control to increase lipid production in microalgae cultures.. 2.2. Specific Objectives. • Design and apply strategies of Active Disturbance Rejection Control based on dynamic models representative of the behavior associated with the growth of microalgae • Propose at least one simplified model based on existing models suitable for the application of strategies of Active Disturbance Rejection Control associated to the growth of microalgae • Propose an optimal control problem based on Active Disturbance Rejection Control with the lipid optimization process • Establish a methodology for the application of Active Disturbance Rejection Control techniques for microalgae cultures • Evaluate the performance of the bioprocess control system with real experimental conditions. 2.3. Objectives-articles relationship. The objectives of this thesis, its relationship with each of the sections of chapter 3 and the published papers derived from this work are presented in Fig 2.1. The first article, offers a proposal to control the intensity of light applied to a batch culture, using the strategy of Active Disturbance Rejection Control (ADRC) with the goal of increasing biomass concentration (CX). Additionally, the total specific growth rate (μ(t)) was established as reference. The optimal reference signal, μopt, was obtained from the one Haldane type model. In the second article, an ADRC approaches the dilution rate (𝐷) in a continuous culture of microalgae Chlorella vulgaris, to attain reference biomass (𝐶𝑋∗ ) was proposed. Hence, the plant model was solved under steady state conditions to find the values of productivity (P(t)) for different light intensities. The reference was chosen as the practically achievable value that allowed the highest productivity..
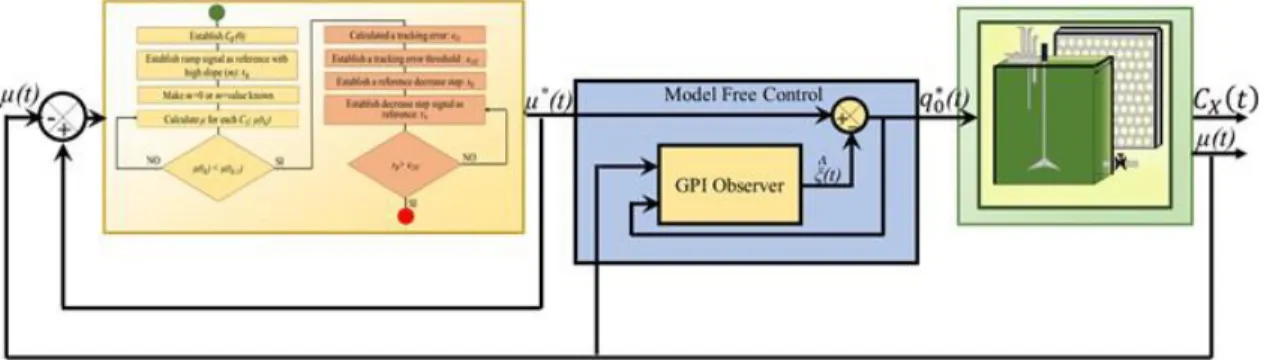
(19) 5. Objectives. These two articles are the result of the work done to achieve the first two specific objectives. The articles are presented in 3.1 and 3.2 sections. The third article presents a method to find an optimal decision curve to manage the incident light intensity (q0(t)) that is applied to a batch microalgae cultivation to maximize CX. This is an off-line optimization strategy, in other words an optimal value is determined a priori. Next, the fourth article shows the application of Model Free Control (MFC) strategy and a heuristic optimization on-line proposal to optimally control of growth of the microalga Chlamydomonas reinhardtii in a batch culture. The control signal was the incident light intensity. In both cases, the total specific growth rate (μ(t)) was established as reference. These two articles are the result of the work done to achieve the third and fourth specific objectives. The articles are presented in 3.3 and 3.4 sections. Numerical simulations evaluated the performance of four proposals. The simulations showed that the proposals are robust towards parametric uncertainties, un-modeled dynamics, and disturbances. In the fifth article, the optimal medium for the growth of A. obliquus was determined. In addition, four extraction methods were compared: classical, microwave assisted (MW), Soxhlet, and ultrasound assisted (US). The above to establish of the most suitable method for the extraction of lipids from the microalga Acutodesmus obliquus (Scenedesmus obliquus UTEX 393), was presented. Finally, A. obliquus was cultivated under illumination with LEDs emitting λ = 620-750 nm (red), λ = 570-590 nm (yellow), λ = 495-570 nm (green), and λ = 380-450 nm (violet) light. Additionally, each these cultures were illuminated at different light intensities (I1=40 µE·m2 -1 ·s , I2=65 µE·m-2·s-1 and I3=90 µE·m-2·s-1). The effect both wavelength and light intensity, on the growth as well the production of essential fatty acids, in cultures of Acutodesmus obliquus (Scenedesmus obliquus) were present in the sixth article. These two articles are the result of the work done to achieve the fifth specific objective. The articles are presented in 3.5 and 3.6 sections..
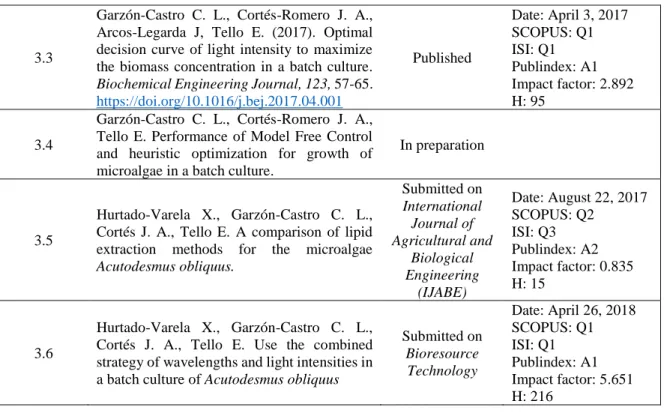
(20) 6. Objectives. Figure 2.1. Structure of the document and published papers. 2.4. Status of written articles. As result of the present work, in the Table 2.1 is the information of the state of each or the research articles that have been written. Each article corresponds to a section of the results chapter of this document.. SECTION. Table 2.1. Status of written articles PUBLICATION PAPER INFORMATION STATUS. 3.1. Garzón C. L., Cortés J. A., Tello E. (2017). Active Disturbance Rejection Control for growth of microalgae in a batch culture. IEEE Latin America Transactions, 15 (4), 588-594. https://doi.org/10.1109/TLA.2017.7896342. Published. 3.2. Garzón-Castro C. L., Delgado-Aguilera E., Cortés-Romero J. A., Tello E. & Mazzanti G. Performance of an Active Disturbance Rejection Control on a simulated continuous microalgae photobioreactor.. Submitted on Computers & Chemical Engineering. PUBLICATION DETAILS Date: April 12, 2017 SCOPUS: Q2 ISI: Q4 Publindex: B Impact factor: 0.631 H: 15 Date: October 5, 2017 SCOPUS: Q1 ISI: Q1 Publindex: A1 Impact factor: 3.024 H: 113.
(21) 7. Objectives. 3.3. 3.4. Garzón-Castro C. L., Cortés-Romero J. A., Arcos-Legarda J, Tello E. (2017). Optimal decision curve of light intensity to maximize the biomass concentration in a batch culture. Biochemical Engineering Journal, 123, 57-65. https://doi.org/10.1016/j.bej.2017.04.001 Garzón-Castro C. L., Cortés-Romero J. A., Tello E. Performance of Model Free Control and heuristic optimization for growth of microalgae in a batch culture.. 3.5. Hurtado-Varela X., Garzón-Castro C. L., Cortés J. A., Tello E. A comparison of lipid extraction methods for the microalgae Acutodesmus obliquus.. 3.6. Hurtado-Varela X., Garzón-Castro C. L., Cortés J. A., Tello E. Use the combined strategy of wavelengths and light intensities in a batch culture of Acutodesmus obliquus. Published. Date: April 3, 2017 SCOPUS: Q1 ISI: Q1 Publindex: A1 Impact factor: 2.892 H: 95. In preparation Submitted on International Journal of Agricultural and Biological Engineering (IJABE) Submitted on Bioresource Technology. Date: August 22, 2017 SCOPUS: Q2 ISI: Q3 Publindex: A2 Impact factor: 0.835 H: 15 Date: April 26, 2018 SCOPUS: Q1 ISI: Q1 Publindex: A1 Impact factor: 5.651 H: 216. In addition, the following work was presented in scientific congress: • •. 2.5. Hurtado X., Garzón-Castro C. L., Cortés-Romero J. A., & Tello, E. (2017). Establishment of the most suitable method for the extraction of lipids from the microalga Acutodesmus obliquus. In: Algal Biofuels. Miami, USA, June 18-21, 2017. Garzón-Castro C., Cortés-Romero J. & Tello E. (2018). Optimización en línea y fuera de línea aplicada al crecimiento de microalgas. In: Jornada de Actualización en Biotecnología Algal. Bogotá, Colombia, February 1-2, 2018.. Individual’s contributions. The information corresponding to the contribution made by each one of the authors in the written articles can be consulted in Table 2.2. SECTION. 3.1. Table 2.2. Individual’s contribution PAPER INFORMATION CONTRIBUTION All authors made substantial contributions to conception and design of project. These contributions Garzón C. L., Cortés J. A., Tello E. were materialized in the publication of this article. (2017). Active Disturbance Rejection Garzón participated in the design of the control Control for growth of microalgae in a proposal; carried out the simulations, made the batch culture. IEEE Latin America analysis of them; and wrote the manuscript. Transactions, 15 (4), 588-594. Cortés participated in the design of the control https://doi.org/10.1109/TLA.2017.78 proposal and helped revise the manuscript. 96342 Tello helped to revise the manuscript. All authors read and approved the final manuscript..
(22) 8. Objectives. 3.2. Garzón-Castro C. L., DelgadoAguilera E., Cortés-Romero J. A., Tello E. & Mazzanti G. Performance of an Active Disturbance Rejection Control on a simulated continuous microalgae photobioreactor.. 3.3. Garzón-Castro C. L., Cortés-Romero J. A., Arcos-Legarda J, Tello E. (2017). Optimal decision curve of light intensity to maximize the biomass concentration in a batch culture. Biochemical Engineering Journal, 123, 57-65. https://doi.org/10.1016/j.bej.2017.04 .001. 3.4. Garzón-Castro C. L., Cortés-Romero J. A., Tello E. Performance of Model Free Control and heuristic optimization for growth of microalgae in a batch culture.. 3.5. Hurtado-Varela X., Garzón-Castro C. L., Cortés J. A., Tello E. A comparison of lipid extraction methods for the microalgae Acutodesmus obliquus.. Garzón-Castro, Cortés-Romero and Tello made substantial contributions to conception and design of project. These contributions were materialized the writing of this manuscript. Garzón-Castro did the design of the control proposal; carried out the simulations, made the analysis of them; and wrote the manuscript. Delgado-Aguilera participated in the review of design of the control proposal and help to draft the manuscript. Cortés-Romero and Tello-Camacho helped to revise the manuscript. Mazzanti participated both in the review of mathematical model of the bioprocess and in the analysis of simulations. Additionally, he helped in the writing of the manuscript. All authors read and approved the final manuscript. Garzón-Castro, Cortés-Romero and Tello made substantial contributions to conception and design of project. These contributions were materialized in the publication of this article. Garzón-Castro participated both in the design of the optimization proposal as in carried out the simulations. Additionally, she made the analysis of the simulations and wrote the manuscript. Cortés-Romero participated both in the design of the optimization proposal as in carried out the simulations. He also helps to revise the manuscript. Arcos-Legarda replicated the optimization with which the proposed design was compared, and he helped to revise the manuscript. Tello-Camacho helped to revise the manuscript. All authors read and approved the final manuscript All authors made substantial contributions to conception and design of project. These contributions were materialized the writing of this manuscript. Garzón-Castro participated both in the design of the proposal as in carried out the simulations. Additionally, she made the analysis of the simulations and wrote the manuscript. Cortés-Romero participated both in the design of the optimization proposal as in carried out the simulations. He also helps to revise the manuscript. Tello-Camacho helped to revise the manuscript. All authors read and approved the final manuscript Garzón-Castro, Cortés-Romero and Tello made substantial contributions to conception and design of project. These contributions were materialized the writing of this manuscript. Hurtado-Varela carried out all experiments and participated both in the analysis of the data as in the writing of the manuscript. Garzón-Castro chosen the nitrogen amount in the culture medium. Additionally, she participated both.
(23) 9. Objectives. 3.6. Hurtado-Varela X., Garzón-Castro C. L., Cortés J. A., Tello E. Use the combined strategy of wavelengths and light intensities in a batch culture of Acutodesmus obliquus. in the analysis of the some of the data as in writing of the manuscript. Cortés-Romero helped to revise the manuscript. Tello-Camacho chose what extraction methods should be compared. Additionally, he participated both in the analysis of the data as in the writing of the manuscript. All authors read and approved the final manuscript Garzón-Castro, Cortés-Romero and Tello made substantial contributions to conception and design of project. These contributions were materialized the writing of this manuscript. Hurtado-Varela participated in design of the experiments. She carried out all experiments and participated in the writing of the manuscript. Garzón-Castro participated in design of the experiments. Additionally, she participated both in the analysis of the data as in writing of the manuscript. Cortés-Romero helped to revise the manuscript. Tello-Camacho participated both in the analysis of the data as in the writing of the manuscript. All authors read and approved the final manuscript.
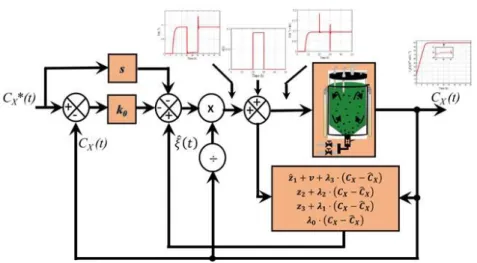
(24) RESULTS 3.1. Active Disturbance Rejection Control for Growth of Microalgae in a Batch Culture. Abstract. The processes based on microalgae pose new challenges on modelling as well as control, due to the complex nonlinear dynamics and variants during the course of time. The microalgae can be cultivated in closed systems called photobioreactors (PBR), through which it is possible to control the conditions of the culture, with the purpose of increasing the production of biomass or metabolites. The optimization of the conditions of growth in relation to light is essential for the increase of biomass. In this paper, a proposal is presented to control the intensity of light applied to a batch PBR, using the strategy of active disturbance rejection control (ADRC) with the goal of increasing biomass. Under this paradigm: 1) a substantial simplification of the design of the laws of control is obtained, 2) the complexity of the system is reduced to a linear disrupted system, 3) the high uncertainty of the internal dynamics are worked liked equivalent disturbances at the entrance, 4) the internal and external disturbances that affect the behavior of the system are worked in a unified manner and 5) the estimation of the unified disturbances is done in line, by a linear observer of extended state, in schemes of control based on the observer. The proposal of control is illustrated and evaluated at a simulation level. In the analysis, the performance of the strategy was studied against the variation of parameters. The simulations show the excellent performance against the different perturbations considered, highlighting the strength of the strategy.. Keywords: Active Disturbance Rejection Control, Nonlinear System, Robust Control, Bioprocess, Batch Culture, Microalgae.. Graphic abstract. Link: https://ieeexplore.ieee.org/document/7896342/.
(25) 25. Results: Active Disturbance Rejection Control for growth of microalgae in a batch culture.
(26) 3.2. Performance of an active disturbance rejection control on a simulated continuous microalgae photobioreactor. Abstract. Microalgae are used for the industrial production of high value compounds. The aim in continuous bioreactors is to obtain the highest biomass production. It is necessary to guarantee that the bioprocesses attain and maintain the optimal reference biomass CX*(t), despite endogenous and exogenous disturbances. This paper describes the numerical simulation of the application of Active Disturbance Rejection Control (ADRC) to control the dilution rate (D(t)) in a continuous culture of the microalga Chlorella vulgaris. To reduce the bioprocess to a “SISO” system, the authors chose the dilution rate, D(t), to be the only control signal. The control proposal was illustrated and evaluated through a numerical simulation using MATLAB/Simulink™ environment. The performance of the ADRC was tested by the application of external perturbations and variation of parameters over a nominal case. At nominal conditions, D(t) was always maintained within the physical limits imposed by the bioprocess. Step and smooth type signals, at 96.4%·|𝐷𝑚𝑎𝑥 (𝑡)|, were imposed as external perturbation on the control signal input, D(t). The controller response kept the output signal CX(t) within an insignificant 0.0043%·|𝐶𝑋𝑚𝑎𝑥 (𝑡)|. The algal culture had a strongly asymmetric response to variations of the ideal maximum growth rate, μmax(t) ± 30%·|μmax(t)|, and of the nominal light intensity, Iin(t) ± 30%·|Iin(t)|. Nonetheless, the controller promptly returned the output signal to its reference value, CX(t)*. The numerical test of the control proposal, in summary, showed that the ADRC strategy ensures excellent reference tracking capability and robustness towards parametric uncertainties, un-modeled dynamics, and external disturbances.. Keywords: active disturbance rejection control, nonlinear system, robust control, growth of microalgae, continuous culture.. Graphic abstract.
(27) 52. Results: Performance of an ADRC on a simulated continuous microalgae PBR.
Figure

+7


Documento similar
No obstante, como esta enfermedad afecta a cada persona de manera diferente, no todas las opciones de cuidado y tratamiento pueden ser apropiadas para cada individuo.. La forma
The Dwellers in the Garden of Allah 109... The Dwellers in the Garden of Allah
Díaz Soto has raised the point about banning religious garb in the ―public space.‖ He states, ―for example, in most Spanish public Universities, there is a Catholic chapel
teriza por dos factores, que vienen a determinar la especial responsabilidad que incumbe al Tribunal de Justicia en esta materia: de un lado, la inexistencia, en el
ABSTRACT Transformation of the Specialized Knowledge of Future Primary Teachers on Fraction Division
From the phenomenology associated with contexts (C.1), for the statement of task T 1.1 , the future teachers use their knowledge of situations of the personal
In the preparation of this report, the Venice Commission has relied on the comments of its rapporteurs; its recently adopted Report on Respect for Democracy, Human Rights and the Rule
The draft amendments do not operate any more a distinction between different states of emergency; they repeal articles 120, 121and 122 and make it possible for the President to
H I is the incident wave height, T z is the mean wave period, Ir is the Iribarren number or surf similarity parameter, h is the water depth at the toe of the structure, Ru is the
