A Study of Two Dwarf Irregular Galaxies with Asymmetrical Star Formation Distributions
13
0
0
Texto completo
(2) The Astrophysical Journal, 855:7 (13pp), 2018 March 1. Hunter et al. Table 1 The Galaxy Sample. Galaxy. Other Namesa. DDO 187 NGC 3738. UGC 9128 UGC 6565. D (Mpc). Referencesb. MV (mag). c RD (kpc). d log SFR FUV D (M☉ yr−1 kpc−2). 12+log (O/H). Referencese. 2.2 4.9. 1 2. −12.7±0.014 −17.1±0.001. 0.18±0.01 0.78±0.01. −1.98±0.01 −1.53±0.01. 7.75±0.05 8.04±0.06. 3 3. Notes. a Selected alternate identifications obtained from NED. b Reference for the distance to the galaxy. c RD is the disk scale length measured from V-band images. From Hunter & Elmegreen (2006) revised to the distance adopted here. d SFR FUV is the integrated star formation rate determined from GALEX FUV fluxes (Hunter et al. 2010, with an update of the GALEX FUV photometry to the D GR4/GR5 pipeline reduction), normalized to the area pRD2 , where RD is the disk scale length. e Reference for the oxygen abundance of the galaxy. References. 1—Dalcanton et al. (2009), 2—Karachentsev et al. (2003), 3—Berg et al. (2012).. those regions. Our observations are described in Section 3, including a comparison of the galactic characteristics on the high-SFR side and the lower-SFR side of the galaxies, ages of compact star clusters, and gas kinematics. In Section 4 we summarize the pertinent observations, draw a comparison of DDO 187 and NGC 3738 with IC 10, a dIrr with a tidal tail, and with tadpole galaxies, and speculate on a plausible overall picture of what has happened in these systems. Section 5 is a reprise of the highlights.. higher sensitivity but poorer spatial resolution compared to other weighting schemes. For DDO 187, the channel separation was 1.3 km s−1, the naturally weighted beam FWHM was 12 4×11 0, and the single channel rms was 0.54 Jy beam−1. For NGC 3738, the channel separation was 2.6 km s−1, the beam FWHM was 13 0×7 8, and the single channel rms was 0.46 Jy beam−1. Σgas is the H I surface density multiplied by 1.34 to account for helium (Trimble 1975). We also used the intensity-weighted velocity field (moment 1) and velocity dispersion (moment 2) maps. The H I maps are shown in Figures 1 and 2. In addition, we used B and V images obtained with the Hall 1.1 m telescope at Lowell Observatory to determine the stellar mass density on a pixel by pixel basis. We used the B−V color to determine the mass-to-light ratio using an empirical relationship determined from spectral energy distribution (SED) fitting to LITTLE THINGS annular surface photometry (Herrmann et al. 2016), and, with the V-band luminosity LV, determined the stellar mass in each pixel. According to Zhang et al. (2017), B and V are the best passbands to use for estimating stellar masses from a single color for dwarf galaxies. Adequate near-infrared images are not available from WISE or Spitzer. From Zhang et al. (2017) we can expect that these stellar masses are good to a factor of two, and we adopt an uncertainty of 0.3 dex in the stellar mass surface densities. Together, the gas and stellar mass maps were used to produce maps of the hydrostatic mid-plane pressure from. 2. The Data 2.1. Galaxy Sample Some basic properties of DDO 187 and NGC 3738 are given in Table 1. DDO 187 and NGC 3738 are part of the LITTLE THINGS24 (Local Irregulars That Trace Luminosity Extremes, The H I Nearby Galaxy Survey; Hunter et al. 2012) sample. LITTLE THINGS is a multi-wavelength survey of 37 dIrr galaxies and 4 Blue Compact Dwarfs (BCD) aimed at understanding what drives star formation in tiny systems. The LITTLE THINGS galaxies were chosen to be nearby (10.3 Mpc), contain gas so they could be forming stars, and cover a large range in dwarf galactic properties. NGC 3738 is also part of the Hubble Space Telescope (HST) Legacy Extragalactic UV Survey (LEGUS, Calzetti et al. 2015). LEGUS is an HST Cycle 21 Treasury survey aimed at exploring star formation from scales of individual stars to kiloparsec-sized structures with multi-band imaging on 50 galaxies within 12 Mpc. The galaxies span the range of starforming disk galaxies, including dIrrs.. P = 2.934 ´ 10-55 ´ Sgas ´ (Sgas + (sg s*) ´ S*) [g (s2 cm)] ,. where Σ is a surface density and σ is a velocity dispersion (Elmegreen 1989). The stellar velocity dispersion, σ*, was estimated using log s* = -0.15MB - 1.27 from Swaters (1999), where MB is the integrated B-band absolute magnitude of the galaxy. Σgas is determined from H I+He, since the molecular content has not been mapped in these galaxies. CO has been detected in NGC 3738 at a surface density of 2.7 M☉ pc−2 in a single pointing (Young et al. 1995; R. C. Kennicutt 2017, private communication), but generally H I dominates the apparent gas mass density. Also, the emphasis here is on the material that is available to become molecular on a larger spatial scale. We therefore have maps of the pressure, gas kinematics, atomic gas mass surface density, and stellar mass surface density with which. 2.2. Galactic Environments To characterize the galactic environments within DDO 187 and NGC 3738 we used LITTLE THINGS data. The LITTLE THINGS data sets include H I-line maps obtained with the Karl G. Jansky Very Large Array (VLA25), and we used the naturally weighted maps here. In natural-weighting the visibilities have the same weights, resulting in somewhat 24. Funded in part by the National Science Foundation through grants AST0707563, AST-0707426, AST-0707468, and AST-0707835 to US-based LITTLE THINGS team members and with generous technical and logistical support from the National Radio Astronomy Observatory. 25 The National Radio Astronomy Observatory is a facility of the National Science Foundation operated under cooperative agreement by Associated Universities, Inc.. 2.
(3) The Astrophysical Journal, 855:7 (13pp), 2018 March 1. Hunter et al.. Figure 1. DDO 187 images: Top left: GALEX FUV-band image. The color bar are in units of counts s−1, which can be converted to erg s−1 cm−2 Å−1 by multiplying by 1.4×10⁻¹⁵. The bright half of the galaxy to the southwest is referred to as the HSF half and the fainter half of the galaxy to the northeast is referred to as the LSF half. The black line marks the dividing line between the two halves. The blue contour denotes the 23.6 mag arcsec−2 isophote on the V-band image and was chosen to encompass the part of the optical galaxy considered here. The red circles added together are used to determine the characteristics of the HSF half and the green circles added together are used to determine the characteristics of the LSF half. The white “x” marks the optical center of the galaxy (Hunter & Elmegreen 2006). The small yellow circles mark the location of compact star clusters. Top right: stellar mass surface density map. The color bar is in units of M☉ pc−2. Middel left: Pressure map. The color bar is in units of g s−2 cm−1. Middle right: integrated H I map. The color bar is in units of Jy beam−1 m s−1; multiply by 8.13×10¹⁸ to obtain column density in units of atoms cm−2. Bottom left: H I intensity-weighted velocity field. The color bar is in units of m s−1. Bottom right: H I intensity-weighted velocity dispersion map. The color bar is in units of m s−1.. 3.
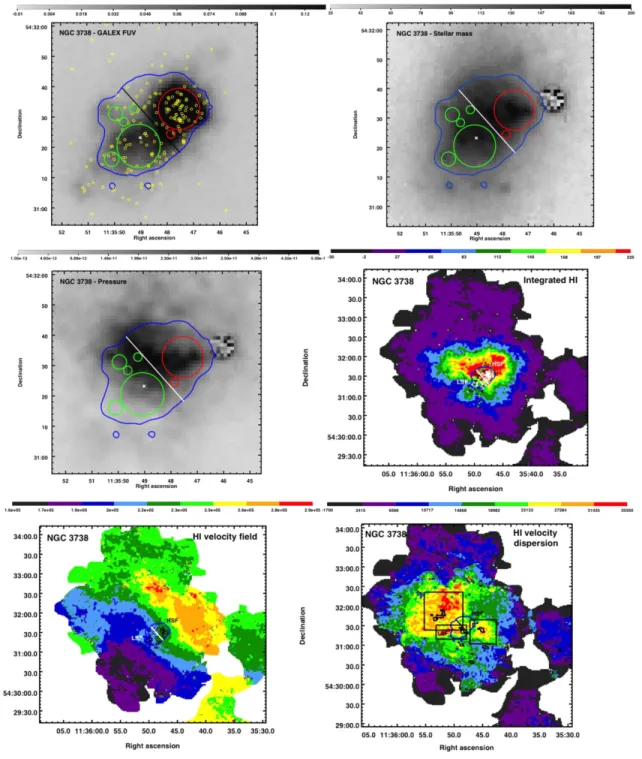
(4) The Astrophysical Journal, 855:7 (13pp), 2018 March 1. Hunter et al.. Figure 2. NGC 3738 images, Top left: GALEX FUV-band image. The color bar is in units of counts s−1, which can be converted to erg s−1 cm−2 Å−1 by multiplying by 1.4×10⁻¹⁵. The bright half of the galaxy to the northwest is referred to as the HSF half and the fainter half of the galaxy to the southeast is referred to as the LSF half. The black line marks the dividing line between the two halves. The blue contour denotes the 20.6 mag arcsec−2 isophote on the V-band image and was chosen to encompass the part of the optical galaxy considered here. The red circles added together are used to determine the characteristics of the HSF half and the green circles added together are used to determine the characteristics of the LSF half. The white “x” marks the optical center of the galaxy (Hunter & Elmegreen 2006). The small yellow circles mark the location of compact star clusters. Top right: stellar mass surface density map. The color bar is in units of M☉ pc−2. Middel left: pressure map. The color bar is in units of g s−2 cm−1. Middle right: integrated H I map. The small circles mark the location of compact star clusters; white denotes clusters with ages less than or equal to 30 Myr, black circles are for clusters with ages between 30 and 100 Myr, and green circles are clusters with ages greater than 100 Myr. The color bar is in units of Jy beam−1 m s−1; multiply by 1.09×10¹⁹ to obtain column density in units of atoms cm−2. Bottom left: H I intensity-weighted velocity field. The black dots are compact star clusters. The color bar is in units of m s−1. Bottom right: H I intensity-weighted velocity dispersion map. The small black contours are the integrated H I with strong non-circular motions from Oh et al. (2015). “Strong” here means that the intensity of the H I in this velocity component is stronger than the signal in the gas undergoing ordered rotation. The peculiar velocity maps were made from the robust-weighted data cube and have a beam size of 6 26×5 51. The column densities of the gas engaged in non-circular motions are of the order of 1021 atoms cm−2. The black boxes outline grids of velocity profiles discussed in Section 3.4. The color bar is in units of m s−1.. We estimate the uncertainties in ΣH I from the H I data cube channel rms given by Hunter et al. (2012) and assume the number of channels contributing to each pixel in the integrated. to characterize the environment in which recent star formation has taken place. The stellar mass density and pressure maps are shown in Figures 1 and 2. 4.
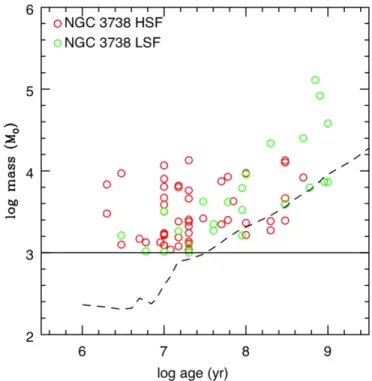
(5) The Astrophysical Journal, 855:7 (13pp), 2018 March 1. Hunter et al. Table 2 The Clusters in DDO 187. ID. R.A. (h m s). Decl. (° ′ ″). CIa. V. B−V. U−B. V−I. 1 2 3 4 5 6. 14 14 14 14 14 14. 23 23 23 23 23 23. 1.5 1.3 1.5 1.5 1.4 1.4. 21.83±0.04 22.47±0.06 22.25±0.04 21.92±0.03 21.33±0.02 22.20±0.03. 1.05±0.08 1.33±0.14 0.71±0.05 0.51±0.04 0.73±0.03 0.65±0.05. −0.61±0.12 −0.65±0.20 −1.40±0.04 −1.23±0.04 −1.35±0.03 −1.51±0.04. 0.19±0.06 0.64±0.08 −0.46±0.11 −0.24±0.07 −0.65±0.06 −0.32±0.09. 15 15 15 15 15 15. 56.17 55.67 57.09 55.03 54.95 57.21. 03 03 03 03 03 02. 25.5 21.5 03.5 02.7 00.1 58.1. Note. a CI is determined by taking the difference between the magnitude in an aperture with a 3-pixel radius and that of an aperture with a 1-pixel radius in the F606W filter. Table 3 SED Fits to the Clusters in DDO 187 ID. Chi-square. log Age (year). Za. AV. log Mass (M☉). 1 2 3 4 5 6. 1.9 2.0 2.0 0.1 2.0 2.0. 8.80.2 0.1 8.70.3 0.1 6.50.4 0.1 6.90.4 0.3 6.50.1 0.1 6.50.2 0.1. 0.005 0.006 0.005 0.002 0.005 0.005. 0.0b 0.0b 0.90.6 0.6 0.30.4 0.3 1.10.5 0.4 0.70.5 0.6. 3.60.2 0.1 3.30.2 0.1 2.2 0.3 0.5 2.40.4 0.6 2.70.3 0.3 2.2 0.3 0.4. Notes. a Metallicity Z is a free parameter. The oxygen abundance given in Table 1 corresponds to a Z of about 0.001. b These extinction values AV were set to 0 in order to better constrain the other parameters.. moment zero map is a typical FWHM divided by the channel width. Then, knowing the number of pixels summed for each region, we derive the uncertainty in the H I flux. For NGC 3738 the uncertainties are 4% and 5% of the flux in the HSF and LSF regions, respectively. For DDO 187, the uncertainties are 12% and 19%. The uncertainty in the pressure is determined from the fact that the pressure is dominated by S2H I .. Figure 3. Mass vs. age for the 75 star clusters in the two regions of NGC 3738 studied here. Clusters were eliminated on the basis of class (0 and 4) and the number of filters with observations (<4 filters). The horizontal solid black line marks the cluster mass cut (mass <1000 M☉). The slanted dashed line marks the catalog limits for visual inspection of the clusters defined as MF606W=−6 for NGC 3738, a conservative estimate of the completeness limit (Adamo et al. 2017). The concern for incompleteness is at ages older than 35 Myr and extends to higher mass with increasing age.. 2.3. Star Clusters The LEGUS team identified compact star clusters in the LEGUS sample of galaxies (Adamo et al. 2017; D. O. Cook et al. 2018, in preparation), including NGC 3738, and we use the LEGUS catalog to examine the star clusters in each half of the galaxy. The clusters are compact and centrally concentrated sources (class 1 or 2 objects), which could be gravitationally bound systems, or those with asymmetric profiles and multiple peaks on top of diffuse underlying wings (class 3) (Adamo et al. 2017). We did not include objects whose authenticity as a cluster was not verified because of their faintness (Class 0) or that are likely non-cluster contaminants (Class 4; see Grasha et al. 2015, for more details). The catalog contains the concentration index (CI), defined as the magnitude in the F606W filter within an aperture of radius 1 pixel minus the magnitude measured within an aperture with a 3-pixel radius, which is 2.8 pc at NGC 3738. The catalog also contains the ages and masses of the clusters determined from SED fitting to multiple HST passbands. Several internal reddening curves were used, and here we adopted the catalogs in which the photometry was fit for internal extinction using the curve of Calzetti et al. (2000). See Adamo et al. (2017) for details. In order to use only the clusters in the catalog whose properties were determined with confidence and whose. numbers were fairly complete, we eliminated clusters with imaging in less than 4 filters, with masses less than 1000 M☉, and with undetermined ages. This left 182 clusters. Of these, 75 are in the region we examine here. The LEGUS team carried out tests on the incompleteness of the cluster catalog of NGC 628 at 9.9 Mpc (Adamo et al. 2017) and M51 at 7.7 Mpc (Messa et al. 2017) by counting the recovery of synthetic sources. The completeness in the F555W image of NGC 628 is 90% at about 25.0 mag and that in the image of M51 is 90% at about 23.7 mag. The LEGUS cluster catalogs also used an absolute magnitude limit of −6 for visual inspection of the clusters (Adamo et al. 2017). In NGC 628 and M51 the magnitude cut is brighter than the 90% completeness limit. The completeness limits in other galaxies are expected to be similar. In Figure 3 we plot the mass versus age for the 75 clusters in our regions, along with a line that shows this magnitude limit projected on the mass-age plane. This represents a conservative estimate of the completeness of the cluster catalog. The concern 5.
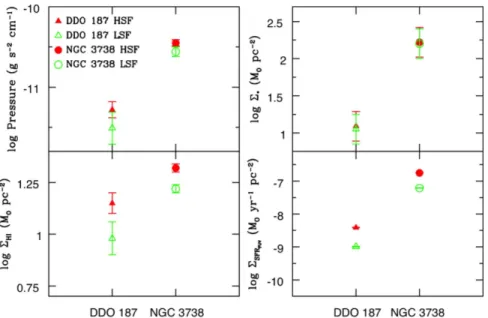
(6) The Astrophysical Journal, 855:7 (13pp), 2018 March 1. Hunter et al.. Figure 4. Pressure, H I mass surface density ΣH I, stellar mass surface density Σ*, and SFR determined from the FUV per unit area ΣFUV plotted for the HSF and LSF regions in DDO 187 and NGC 3738.. Table 4 Galactic Propertiesa Galaxy. Region. Area (kpc2). Effective Radius (pc). log SH I (M☉ pc−2). log Pressure (g s−2 cm−1). log S* (M☉ pc−2). log SFRFUVb (M☉ yr−1 kpc−2). DDO 187. HSF LSF HSF/LSF HSF LSF HSF/LSF. 0.113 0.108 L 0.086 0.117 L. 190 185 L 165 193 L. 1.15±0.05 0.98±0.08 1.5±0.3 1.32±0.02 1.22±0.02 1.3±0.08. −11.28±0.1 −11.51±0.2 1.7±0.6 −10.45±0.04 −10.56±0.06 1.3±0.2. 1.09±0.2 1.05±0.2 1.1±0.7 2.22±0.2 2.20±0.2 1.0±0.7. −2.41±0.005 −2.99±0.011 3.8±0.11 −0.75±0.003 −1.21±0.006 2.9±0.03. NGC 3738. Notes. a The third line for each galaxy is the ratio of the property in the HSF region to that in the LSF region. b log SFRFUV is the SFR in each region derived from the FUV luminosity in that region divided by the area of the region given in column 3. See Hunter et al. (2010) for the formula used for determining the SFR from the FUV luminosity.. (Kroupa 2001), and the Calzetti et al. (2000) extinction curve, in order to treat the DDO 187 clusters similarly to the way the LEGUS team fit the clusters of NGC 3738. The photometry and SED fitting for the 6 clusters in DDO 187 are given in Tables 2 and 3.. for incompleteness is at ages older than 35 Myr and increases in mass with age, but the completeness in both the HSF and LSF regions is similar. See Hunter et al. (2018) for further discussion of the properties of these clusters, as well as OB associations and OB stars in NGC 3738. DDO 187 is not part of the LEGUS sample. However, there are two HST images of this galaxy in the F606W and F814W filters in the archives. We used the HST images and the LEGUS pipeline to identify and verify candidate star clusters in DDO 187. Thirty-five candidate clusters were classified by eye, and six are classes 1, 2, or 3. The positions of these six clusters are marked in Figure 1. The CI parameter was measured on the F606W filter. We also have UBVI ground-based images of DDO 187 obtained under excellent seeing with Lowell Observatory’s 4.3 m Discovery Channel Telescope (DCT) and the Large Monolithic Imager, and we found it more useful to use these multi-wavelength data to determine the ages and masses of the clusters (Zhang et al. 2012). On the DCT images the seeing was 0 65, 1 2, 0 65, 0 94, for UBVI, respectively. We used Starburst99 models (Leitherer et al. 1999) with the Geneva high mass-loss stellar evolutionary tracks (Meynet et al. 1994), a Kroupa stellar initial mass function from 0.1 to 100 M☉. 2.4. Dividing the Galaxies into Halves This study was motivated by the distribution of UV light, and hence young regions, in DDO 187 and NGC 3738, and we wish to compare the two halves of the galaxies. In Figures 1 and 2 we show how we have divided each galaxy in half: the high starforming half and the low star-forming half. The images in the upper left are the GALEX FUV-band image, which we use in order to maximize the contrast for young stars. The white or black line marks the separation between the two halves, determined by eye. The bright half of each galaxy (SW for DDO 187 and NW for NGC 3738) is referred to as the high star formation (HSF) half and the fainter half (NE for DDO 187 and SE for NGC 3738) is referred to as the low star formation (LSF) half. We filled the regions with circles that together mostly cover the area under study. The purpose of the circles is to measure the photometric properties of each half of the galaxy. The photometry on images in the different filters and maps of 6.
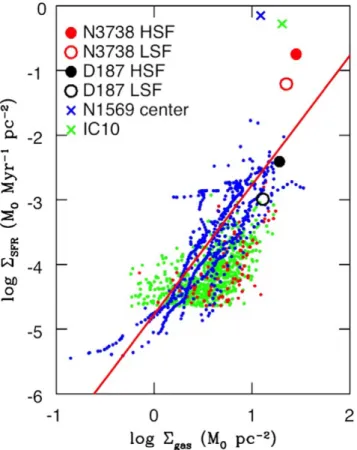
(7) The Astrophysical Journal, 855:7 (13pp), 2018 March 1. Hunter et al.. Figure 5. Kennicutt–Schmidt relation of SFR surface density vs. gas surface density for azimuthally averaged annuli and sub-kiloparsec-sized regions within galaxies. The plot is adopted from Figure 1 of Elmegreen (2015), with the SFRs for the LSF and HSF regions of NGC 3738 and DDO 187 added. The H I has been corrected for the addition of He and heavy elements but not molecules. The small green points are THINGS spirals from Bigiel et al. (2010), the red points are THINGS dwarfs from Bigiel et al. (2010), and the blue points are LITTLE THINGS dwarfs from Elmegreen & Hunter (2015). The red slanted line is the theoretical prediction from Elmegreen (2015). The SFR in the HSF region in NGC 3738 is about 13 times higher than the SFR predicted by its gas density. For comparison, we plot the central 208 pc radius of the starburst dIrr NGC 1569 and the big starforming complex (radius of 196 pc) in IC 10, both of which lie a bit further from the Kennicutt–Schmidt relation along the SFR axis than the HSF region in NGC 3738. The SFRs are determined from GALEX FUV fluxes and thus integrate over the past 100 Myr for all galaxies, including comparison surveys, except IC 10. The SFR of the region in IC 10 is derived from Hα and integrates over the past 10 Myr.. Figure 6. Star clusters in the HSF and LSF regions of NGC 3738 and the HSF side of DDO 187. Clusters were identified and their properties were measured in LEGUS HST images (Calzetti et al. 2015; Adamo et al. 2017) for NGC 3738 and in archive HST images for DDO 187. In NGC 3738 cluster CI, masses, and E(B − V ) are similar in both halves of the galaxy, but the bulk of the clusters in the HSF region are younger than those in the LSF region. DDO 187 only has 6 clusters and they are all on the HSF side of the galaxy.. different environmental properties (pressure, H I surface density, stellar mass surface density) within the circles taken together in each half define the properties in that half of the galaxy. The red circles outline regions in the HSF half, and green circles outline regions in the LSF half. The combined areas of the circles in each half of each galaxy are given in Table 4. The total area in all the circles representing the properties in DDO 187 is 2.1 times the area within one disk scale length. The total area in all the circles in NGC 3738, which is much more centrally concentrated than DDO 187, is 0.1 times the area within one disk scale length.. regions of DDO 187 and NGC 3738 are given in Table 4 and shown pictorially in Figure 4. The stellar mass density is about the same in the HSF and in the LSF regions, but the pressures and H I mass surface densities are higher in the HSF region than in the LSF in both galaxies: pressure is 30%–70% higher and gas density is 30%–50% higher, with DDO 187 having the more extreme difference between the HSF and LSF regions of the two galaxies. We also give the SFR determined from the GALEX FUV flux in Table 4. The FUV averages over the past 100 Myr. We find that the SFR per unit area is higher in the HSF regions than in the LSF regions by a factor of ∼3–4. These results suggest that either or both of the pressure and H I mass surface density are important for enhancing the SFR in the HSF regions of these galaxies.. 3. Results 3.1. Galactic Properties The physical properties (pressures, stellar mass surface densities, and H I mass surface densities) in the HSF and LSF. 7.
(8) The Astrophysical Journal, 855:7 (13pp), 2018 March 1. Hunter et al.. Figure 7. Velocity profiles at a grid of points over the northeast high-velocity dispersion area in DDO 187. The grid is centered at at an R.A., decl. of 14h15m57 36, 23d 4m 0 9 (see Figure 1). A 52 5×52 5 box is covered by a 5×5 grid, where each point averages over 10 5, approximately the beam size of the H I data cube. The grid number is noted in the upper left of each panel, where position 1, 1 is in the northeast (top left) part of the grid and position 5, 5 is in the southwest (bottom right) part of the grid.. IC 2163 and NGC 2207 by Elmegreen et al. (2016a), primarily a result of high compressive turbulence broadening the density probability density function of the H I. The HSF region of NGC 3738 does not have high turbulence itself, but the velocity field does have peculiar motions overall. However, the DDO 187 and NGC 3738 regions are not arbitrary regions within the galaxies; the HSF regions were chosen for being extreme areas of star formation. In addition, the DDO 187 and NGC 3738 regions are not as large as the areas in the comparison objects in the figure, which are azimuthal averages in annuli or cells of 400–750 pc. Larger regions include a more heterogeneous star formation history. For comparison, we also plot in Figure 5 the central 208 pc radius of the dIrr starburst NGC 1569 and the big star-forming complex in IC 10 with a radius of 196 pc (Hunter et al. 2010, 2012; Zhang et al. 2012), as examples of other intense starforming complexes. The SFR for NGC 1569 is determined from the FUV and hence averages over the past 100 Myr. For IC 10 the SFR is from Hα and thus averages over the past 10 Myr. Both SFRs are corrected for reddening. These regions are comparable in size to the HSF region in NGC 3738. However, in terms of the SFR, the center of NGC 1569 and the region in IC 10 are a bit more extreme and fall further from the Kennicutt–Schmidt relation. Thus, the HSF region of NGC. 3.2. SFR and Gas Density Empirically, there is a relationship between gas density and SFR density in galaxies; this is known as the Kennicutt– Schmidt relation. Originally, it was noticed for galaxy-wide integrated SFRs and gas densities (Kennicutt 1989, 1998), but it has also been studied in sub-kiloparsec-sized regions within galaxies (Bigiel et al. 2008, 2010; Ficut-Vicus 2016). In the inner parts of spiral galaxies SSFR ~ S1.4 gas , and in the outer disks of spirals and in dIrr galaxies, the relationship steepens. In Figure 5 we use the quantities in Table 4 to place the LSF and HSF halves of NGC 3738 and DDO 187 on a plot of SFR density against gas surface density ΣSFR versus Σgas. The plot is from Figure 1 of Elmegreen (2015). The other points on the plot are regions within THINGS spirals and dwarfs from Bigiel et al. (2010) and LITTLE THINGS dwarfs from Elmegreen & Hunter (2015). The red line is the theoretical prediction of Elmegreen (2015), included as a model that is applicable to dIrrs (see also Ostriker et al. 2010; Krumholz 2012). We see that the SFRFUV in the HSF region in NGC 3738 is about 13 times higher than predicted by its gas density. The LSF region is high too. On the other hand, both of the DDO 187 regions fall within the scatter of points around the theoretical line. Falling far from the Kennicutt–Schmidt relation in primarily atomic gas is also seen in the interacting galaxies 8.
(9) The Astrophysical Journal, 855:7 (13pp), 2018 March 1. Hunter et al.. have been missed. In addition, the bias would not likely be in the sense of missing high mass compact clusters in the HSF region. Thus, we conclude that incompleteness effects are not likely to operate in the directions necessary to reverse these differences between the HSF and LSF sides. DDO 187 only has 6 clusters and all are found on the HSF side of the galaxy. They are compact; 4 are younger than 10 Myr and 2 are over 100 Myr in age; masses are 100–104 M☉; and reddenings are less than E(B − V ) of 0.3. 3.4. Gas Kinematics In Figures 1 and 2 we show the integrated H I maps of DDO 187 and NGC 3738, the intensity-weighted H I velocity fields, and the intensity-weighted velocity dispersion maps. We see that both DDO 187 and NGC 3738 show overall rotation but with significant peculiar features as well. In NGC 3738, the central region of the galaxy is located at a bend in a backward, S-shaped iso-velocity contour. The velocity dispersion maps reveal a peculiarity common to the two galaxies. A large region of high-velocity dispersion is located just off the regions under discussion here. In DDO 187 the region is comparable in size to our region and is located to the north of the LSF region with dispersions of the order of 14–20 km s−1. In NGC 3738 the high-velocity dispersion region has dispersions of 24–35 km s−1, is located to the east and north of the optical center of the galaxy, and is much larger than our target region. A typical non-starburst dIrr would have a peak velocity dispersion of the order of 10 km s−1, so these regions in DDO 187 and NGC 3738 have higher velocity dispersions. In both systems there is also a smaller region of high-velocity dispersion on the opposite side of the galaxy. There is no direct relationship between these high-velocity dispersion regions and the HSF regions of the galaxies. The high-velocity dispersion gas is unlikely to be due to energy injected by supernova remnants, since none have been found in NGC 3738 (Labrie & Pritchet 2006). To examine the nature of the velocity dispersions further, we plot velocity profiles at points in a rectangular grid in the highvelocity dispersion regions. In each galaxy there are two or three of these areas, and we sum each point in the grid over a region approximately the size of the H I data cube beam. For DDO 187, one region is to the northeast and one is to the southwest of the galaxy center and the grid boxes are outlined in Figure 1. The profiles for DDO 187 are shown in Figures 7 and 8. Although the spectra are noisy, in both regions we see complex profiles. Some profiles could be fit with a single fat Gaussian, and others would require multiple Gaussians. So it is not simple turbulence (wide FWHM of the profiles) that is producing these high-velocity dispersion regions in the moment 2 map of DDO 187, but also complex motions of the gas. The velocity profile grids of the two major high-velocity dispersion areas and one in between in NGC 3738 are shown in Figures 9–11, and outlined with boxes on the velocity dispersion map in Figure 2. As with DDO 187, we see some profiles that are broad and some that are multiple Gaussians. In fact, Oh et al. (2015) isolate H I gas that is not engaged in ordered rotation in NGC 3738, and the integrated H I of the strong non-circular motion gas in NGC 3738 is shown as black contours on Figure 2. “Strong” refers to an H I component that has a higher intensity than the gas engaged in ordered motion at that position in the galaxy. The map shows that gas with peculiar motions is located in the high-velocity dispersion. Figure 8. Velocity profiles at a grid of points over the southwest high-velocity dispersion area in DDO 187. The grid is centered at an R.A., decl. of 14h15m55 63, 23d 2m 48 9 (see Figure 1). A 31 5×31 5 box is covered by a 3×3 grid, where each point averages over 10 5, approximately the beam size of the H I data cube. The grid number is noted in the upper left of each panel, where the position 1, 1 is in the northeast (top left) part of the grid and the position 3, 3 is in the southwest (bottom right) part of the grid.. 3738 is not unusual in its placement on the Kennicutt–Schmidt relation for a region of intense star formation. 3.3. Star Clusters The properties of the compact star clusters identified from HST images in NGC 3738 are shown for the two halves of the galaxy in Figure 6. The cluster CI have similar distributions in the HSF and LSF parts of NGC 3738. The cluster masses are nearly similar too, except the LSF region has a tail of higher cluster masses that are missing in the HSF region. In addition, the cluster extinction E(B − V ), one of the fit parameters to the photometry, covers the same range in both regions. On the other hand, the ages are skewed to younger ages in the HSF region. The bulk of the clusters in the HSF half have ages of 10–20 Myr, with the median age being 20 Myr. The two age peaks in the LSF region are at 60 and 600 Myr, with a median age of 100 Myr. The HSF half also contains about twice as many clusters as the LSF half: 51 in the HSF half and 24 in the LSF half. We have performed the Anderson-Darling nonparametric 2-sample test (Anderson & Darling 1952; Scholz & Stephens 1987) on the properties of the clusters, yielding 51 clusters in the HSF region and 24 clusters in the LSF region. The resulting p-values for CI, age, and mass are 0.025, 0.002, and 0.15, respectively. This implies that the CI values and age are not drawn from the same distribution, but the mass may be. Because the HSF half is more crowded with clusters and OB stars and the background surface brightness is higher, the incompleteness of the cluster catalog could be higher on the HSF side. This would bias the catalog against fainter, more diffuse, and older clusters in that region. However, this should not affect the disparity in age distributions of clusters in the two regions, since young clusters in the LSF region are unlikely to 9.
(10) The Astrophysical Journal, 855:7 (13pp), 2018 March 1. Hunter et al.. Figure 9. Velocity profiles at a grid of points over the northeast high-velocity dispersion area in NGC 3738. The grid is centered at at an R.A., decl. of 11h35m51 90, 54d31m 51 4, and outlined in Figure 2. A 60″×60″ box is covered by a 5×5 grid, where each point averages over 12″, approximately the beam size of the H I data cube. The grid number is noted in the upper left of each panel, where position 1, 1 is in the northeast (top left) part of the grid and position 5, 5 is in the southwest (bottom right) part of the grid.. regions. The contour in the northeast region appears in the lower left quadrant of the grid in Figure 9 and the contour in the southwest region is the center part of the grid in Figure 10.. have similarities. Our examination of the HSF and LSF halves of the regions of DDO 187 and NGC 3738 shows that (1) the SFR on the HSF side has been 3–4 times higher than that on the LSF side over the past 100 Myr; (2) the pressure and gas density are higher on the HSF sides by 30%–70%; (3) the H I velocity fields exhibit significant deviations from ordered rotation; and (4) there are large areas of high-velocity dispersion and complex motions of the gas in the outer galaxies, including a gas component with peculiar motions in the high-velocity dispersion region of NGC 3738. We also find that the HSF region in NGC 3738 has an SFR that is 13 times higher than the rate predicted by its gas density from the Kennicutt–Schmidt relationship, which is similar to other intense star-forming complexes in starburst dwarfs. The compact star clusters in NGC 3738 are generally younger on the HSF side—20 Myr median age versus 100 Myr, and the six clusters in DDO 187 are all located on the HSF side of the galaxy. The size of the HSF region in NGC 3738 is comparable to the gas scale-height, estimated to be 340 pc at a radius of 0.7 kpc (Elmegreen & Hunter 2015). This could suggest that the HSF region represents the limit of what one might expect for a star-forming complex in this galaxy, and therefore, perhaps is not remarkable at all. However, there are other. 4. Discussion We initiated the study of DDO 187 and NGC 3738 because of the similar and unusual morphology of the star formation activity in these galaxies. The areas whose star-forming properties we have examined were chosen from the optical and FUV appearance. The V-band isophote used as a boundary in DDO 187 has a radius of about 220 pc and in NGC 3738 a radius of about 330 pc (Hunter & Elmegreen 2006). These scales are larger, by factors of 5–6, than typical OB associations that generally have radii of 50 pc (for example, Bresolin et al. 1998), but are comparable to some star-forming complexes in dIrrs. Nevertheless, they represent a significant portion of the optical component of the inner galaxy. In DDO 187 and NGC 3738 we noticed a stark division of these regions into a high-SFR half and a low SFR half, and undertook an examination of the properties within the galaxies that might influence this star formation distribution. Although the SFR in the HSF region of NGC 3738 is 46±0.6 times higher than that in DDO 187, the two galaxies 10.
(11) The Astrophysical Journal, 855:7 (13pp), 2018 March 1. Hunter et al.. There is a third galaxy in the LITTLE THINGS sample that bears some resemblance to NGC 3738 and DDO 187: IC 10. In the U-band the galaxy is dominated by a large UV-bright region near the center of the stellar component of the galaxy with two stellar wind-blown bubbles from an older generation of stars to the northwest. The H Iis highly peculiar: the velocity field is chaotic, the velocity dispersion is >20 km s−1 over much of the gas, and there is a large fan of material extending to the south of the optical galaxy. Unlike DDO 187 and NGC 3738, however, IC 10 has been found to have an extended H I tail topped with a higher column density blob of gas, suggesting that IC 10 is an advanced merger or interaction (Nidever et al. 2013; Ashley et al. 2014). The star formation in DDO 187 and NGC 3738 is more sedate than that in IC 10, and if DDO 187 and NGC 3738 are also the results of mergers, they must be further advanced and/or the parameters of the interaction, such as the mass ratios, must have resulted in a gentler interaction. DDO 187 does potentially have two ultra-faint dIrrs nearby that were identified originally as high-velocity clouds (Adams et al. 2016). One of these objects, AGC 249525, has an optical counterpart with a red giant branch that suggests a distance of 1.64±0.45 Mpc and a baryonic mass of the order of 106 M☉ (Janesh et al. 2017). It also has a “head-tail” structure possibly indicative of a past interaction or ram-pressure-stripping. At 1.64 Mpc its distance from DDO 187 would be 680 kpc. Thus, AGC 249525 is not close enough to have interacted recently. In order to compare the properties of the region in IC 10 with those in NGC 3738 and DDO 187, we plot pressure against the SFR per unit area in Figure 12. The center of NGC 1569 is included in this comparison. Both NGC 1569 and IC 10 are starbursts, with the likely explanation being a gravitational interaction with another galaxy. The region over which we measured the properties in IC 10 has a radius of 196 pc. There is no GALEX FUV image for IC 10, so the SFR is determined from the Hα image using the relationship given in Hunter et al. (2010) that is based on that given by Kennicutt (1998). We see that the SFR per unit area ΣSFR increases with pressure, and the HSF region in NGC 3738 is similar in properties to the region in IC 10. The center of NGC 1569 is the most extreme in this plot, having a higher pressure and ΣSFR. There is also a similarity between the star formation distributions found in DDO 187 and NGC 3738 and those seen in “tadpole” galaxies in the sense that these systems are dominated by a giant star-forming region. In the case of tadpole galaxies the giant star-forming regions are located at the end of an elongated distribution of stars, the head of the tadpole (Elmegreen & Elmegreen 2010; Elmegreen et al. 2012). The head of the tadpole galaxies found in the Hubble Deep Field has higher masses of stars by factors of 100–1000 than we find in the HSF regions of DDO 187 or NGC 3738. However, local tadpoles have been found that are comparable to DDO 187 and NGC 3738, and this morphology is relatively common among extremely metal-poor galaxies (Morales-Luis et al. 2011). Furthermore, at least one tadpole head has been found to have a much higher SFR for its probable gas density (Elmegreen et al. 2016b), similar to the HSF region in NGC 3738, as shown in Figure 5. Measurements of the oxygen abundance in several tadpoles revealed that the heads are more metal-poor than the bodies (Sánchez Almeida et al. 2014; Elmegreen et al. 2016b), and this characteristic of the tadpoles suggests the possibility that the star-forming head is the result of infall of metal-poor. Figure 10. Velocity profiles at a grid of points over the southwest high-velocity dispersion area in NGC 3738. The grid is centered at at an R.A., decl. of 11h35m45 00, 54d31m 21 4, and outlined in Figure 2. A 36″×36″ box is covered by a 3×3 grid, where each point averages over 12″, approximately the beam size of the H I data cube. The grid number is noted in the upper left of each panel, where position 1, 1 is in the northeast (top left) part of the grid and position 3, 3 is in the southwest (bottom right) part of the grid.. characteristics of the galaxy that suggest that more is going on. NGC 3738 and two other LITTLE THINGS BCDs are the subject of a study by Ashley et al. (2017) in which they examine the H I distribution and kinematics from the VLA data and look for faint, low-column-density extended gas at 21 cm with the highly sensitive Green Bank Telescope26 (GBT). In spite of the kinematic and morphological peculiarities in the H I, NGC 3738 shows no evidence of extended tails that would be the hallmark of an interaction with another galaxy. On the other hand, NGC 3738 does have a kinematically distinct cloud located southwest of the galaxy center (see Figures 21 and 23 in Ashley et al. 2017) and clumps of low surface density H I in the extended gas (Hunter et al. 2012). Ashley et al. (2017) suggested three possibilities for the state that NGC 3738 is in: (1) an advanced merger, (2) ram-pressurestripping, or (3) an outflow created by the starburst. Ashley et al. (2017) argue that for ram-pressure-stripping by the Canes Venatici I intergroup medium to be the explanation, NGC 3738 would have to be moving through it face-on to create the azimuthally symmetrical depletion of extended gas. An outflow due to the starburst could puff up the stellar and gaseous components of the galaxy, according to El-Badry et al. (2016), and perhaps account for the large size of the stellar disk relative to the H I and for the scattered, low-column-density clouds to the southwest and north of the main galaxy (see Figure 2 here and Figure 72 in Hunter et al. 2012). An advanced merger, on the other hand, could also account for the central concentration of gas, as gas is funneled toward the center in a merger, and the peculiar cloud to the southwest of the center, as well as the scattered faint clouds. 26. A facility of the Green Bank Observatory, which is a facility of the National Science Foundation and is operated by Associated Universities, Inc.. 11.
(12) The Astrophysical Journal, 855:7 (13pp), 2018 March 1. Hunter et al.. Figure 11. Velocity profiles at a grid of points over the central high-velocity dispersion area in NGC 3738. The grid is centered at at an R.A., decl. of 11h35m50 66, +54d31m18 5, and outlined in Figure 2. A 48″×24″ box is covered by a 4×2 grid, where each point averages over 12″, approximately the beam size of the H I data cube. The grid number is noted in the upper left of each panel, where position 1, 1 is in the northeast (top left) part of the grid and position 4, 2 is in the southwest (bottom right) part of the grid.. two dIrrs. Unfortunately, causal connections are speculative at this stage, but the star formation pattern does suggest some large-scale influence on conditions for star formation in these galaxies. 5. Summary In the dIrr galaxies DDO 187 and NGC 3738 we find that the current star formation is taking place in a large region occupying half of the inner optical galaxy. We have examined the properties of the high-SFR halves of the galaxies for comparison with the lower-SFR halves in order to determine what might have influenced this star formation pattern. DDO 187 is not as extreme as NGC 3738, but there are similarities. We find the following: 1. The SFR averaged over the past 100 Myr on the HSF side is a factor of a few times higher than that on the LSF side in both galaxies. 2. The compact star clusters on the HSF side of NGC 3738 have a median age of 20 Myr, which is younger than the median age on the LSF side. 3. The pressure and gas density are higher on the HSF sides by 30%–70%, implying that the pressures and/or H I mass surface densities are important for enhancing the SFR in the HSF regions of these galaxies. 4. The SFR averaged over the past 100 Myr on the HSF side of NGC 3738 is higher by a factor of 13 than the rate predicted by its gas density from the Kennicutt–Schmidt relationship, which is similar to other star-forming complexes in starburst dIrrs. 5. The H I velocity fields exhibit significant deviations from ordered rotation. 6. There are large regions of high-velocity dispersion and complex kinematics in the gas beyond the central regions of the galaxies.. Figure 12. Pressure vs. SFR surface density in the HSF and LSF regions of DDO 187 and NGC 3738, the large star-forming region of IC 10, and the center of NGC 1569. NGC 1569 and IC 10 are both starbursts likely triggered by an external disturbance. The SFR uncertainties for NGC 3738 and DDO 187 are smaller than the symbols.. gas (Ceverino et al. 2016; Elmegreen et al. 2016b). On the other hand, the oxygen abundances of DDO 187 and NGC 3738 are fairly high (see Table 1), which would be inconsistent with the accretion of metal-poor gas from the cosmic web. For DDO 187 and NGC 3738 we can draw the following picture: the higher pressure and gas densities in the HSF regions have enabled star formation in those regions today. Those characteristics in turn resulted from the general chaos in the velocity field, and for NGC 3738, the impact of a “rogue” gas cloud just outside the central region identified by Ashley et al. (2017) could also have played a role. In NGC 3738, the LSF half of the galaxy had a higher SFR than the HSF side over 100 Myr ago and the massive stars formed in that event could also have created higher density gas in the surroundings (for example, Dopita et al. 1985; Efremov & Elmegreen 1998b), with more spectacular results in terms of high Σgas toward the center of the galaxy where the HSF region is located today than toward the outer disk. The larger-scale conditions in these galaxies in turn could have resulted from the merger of. There are many similarities between DDO 187 and NGC 3738 and the dIrr IC 10, a dwarf with a tidal tail that is likely the product of a merger or interaction of two dwarfs. We conclude that the higher pressure and gas density in the HSF regions of DDO 187 and NGC 3738 could have enabled the current star formation there. These conditions in turn are likely 12.
(13) The Astrophysical Journal, 855:7 (13pp), 2018 March 1. Hunter et al.. the result of large-scale processes affecting the internal environments of the galaxies.. Adams, E. A. K., Oosterloo, T. A., Cannon, J. M., Giovanelli, R., & Haynes, M. P. 2016, A&A, 596, A117 Anderson, T. W., & Darling, D. A. 1952, Annals Math. Stat., 23, 193 Ashley, T., Elmegreen, B. G., Johnson, M., et al. 2014, AJ, 148, 130 Ashley, T., Simpson, C. E., Elmegreen, B. G., Johnsons, M., & Pokhrel, N. R. 2017, AJ, 153, 132 Berg, D. A., Skillman, E. D., Marble, A. R., et al. 2012, ApJ, 754, 98 Bigiel, F., Leroy, A., Walter, F., et al. 2008, AJ, 136, 2846 Bigiel, F., Leroy, A., Walter, F., et al. 2010, AJ, 140, 1194 Bresolin, F., Kennicutt, R. C., Jr., Ferrarese, L., et al. 1998, AJ, 116, 119 Calzetti, D., Armus, L., Bohlin, R. C., et al. 2000, ApJ, 533, 682 Calzetti, D., Lee, J. C., Sabbi, E., et al. 2015, AJ, 149, 51 Ceverino, D., Sánchez Almeida, J., Muñoz-Tuñón, C., et al. 2016, MNRAS, 457, 2605 da Silva, R. L., Fumagalli, M., & Krumholz, M. R. 2014, MNRAS, 444, 3275 Dalcanton, J. J., Williams, B. F., Seth, A. C., et al. 2009, ApJS, 183, 67 Dopita, M. A., Mathewson, D. S., & Ford, V. L. 1985, ApJ, 297, 599 Efremov, Y. N., & Elmegreen, B. G. 1998a, MNRAS, 299, 588 Efremov, Y. N., & Elmegreen, B. G. 1998b, MNRAS, 299, 643 El-Badry, K., Wetzel, A., Geha, M., et al. 2016, ApJ, 820, 131 Elmegreen, B. 2015, ApJL, 814, L30 Elmegreen, B., & Hunter, D. 2015, ApJ, 805, 145 Elmegreen, B., Kaufman, M., Bournaud, F., et al. 2016a, ApJ, 823, 26 Elmegreen, B. G. 1989, ApJ, 338, 178 Elmegreen, B. G., & Elmegreen, D. M. 2010, ApJ, 722, 1895 Elmegreen, D. M., & Elmegreen, B. G. 1980, AJ, 85, 1325 Elmegreen, D. M., Elmegreen, B. G., Sánchez Almeida, J., et al. 2012, ApJ, 750, 95 Elmegreen, D. M., Elmegreen, B. G., Sánchez Almeida, J., et al. 2016b, ApJ, 825, 145 Ficut-Vicus, D. 2016, PhD Dissertation, Univ. Hertfordshire Fumagalli, M., da Silva, R. L., Krumholz, M., & Bigiel, F. 2011, ApJL, 741, L26 Grasha, K., Calzetti, D., Adamo, A., et al. 2015, ApJ, 815, 93 Herrmann, K. A., Hunter, D. A., Zhang, H.-X., & Elmgreen, B. G. 2016, AJ, 152, 177 Hunter, D. A., Adamo, A., Elmegreen, B. G., et al. 2018, ApJ, submitted Hunter, D. A., & Elmegreen, B. G. 2006, ApJS, 162, 49 Hunter, D. A., Elmegreen, B. G., & Ludka, B. C. 2010, AJ, 139, 447 Hunter, D. A., Ficut-Vicas, D., Ashley, T., et al. 2012, AJ, 144, 134 Janesh, W., Rhode, K. L., Salzer, J. J., et al. 2017, ApJL, 837, L16 Karachentsev, I. D., Sharina, M. E., Dolphin, A. E., et al. 2003, A&A, 398, 467 Kennicutt, R. C., Jr. 1989, ApJ, 344, 685 Kennicutt, R. C., Jr. 1998, ApJ, 498, 541 Kroupa, P. 2001, MNRAS, 322, 231 Krumholz, M. R. 2012, ApJ, 759, 9 Labrie, K., & Pritchet, C. J. 2006, ApJS, 166, 188 Leitherer, C., Schaerer, D., Goldader, J. D., et al. 1999, ApJS, 123, 3 Messa, M., Adamo, A., Östlin, G., et al. 2017, MNRAS, 473, 996 Meynet, G., Maeder, A., Schaller, G., Schaerer, D., & Charbonnel, C. 1994, A&AS, 103, 97 Morales-Luis, A. B., Sánchez Almeida, J., Aguerri, J. A. L., & Muñoz-Tuñón, C. 2011, ApJ, 743, 77 Nidever, D. L., Ashley, T., Slater, C. T., et al. 2013, ApJL, 779, L15 Oh, S.-H., Hunter, D., Brinks, E., et al. 2015, AJ, 149, 180 Ostriker, E. C., McKee, C. F., & Leroy, A. K. 2010, ApJ, 721, 975 Sánchez Almeida, J., Morales-Luis, A. B., Muñoz-Tuñón, C., et al. 2014, ApJ, 783, 45 Scholz, F. W., & Stephens, M. A. 1987, J. Am. Stat. Assoc., 82, 918 Swaters, R. A. 1999, PhD Dissertation, Rijksuniversiteit Groningen Trimble, V. 1975, RvMP, 47, 877 Young, J. S., Xie, S., Tacconi, L., et al. 1995, ApJS, 98, 219 Zhang, H.-X., Hunter, D. A., Elmegreen, B. G., Gao, Y., & Schruba, A. 2012, AJ, 143, 47 Zhang, H.-X., Puzia, T. H., & Weisz, D. R. 2017, ApJS, 233, 13. Some of the results presented here are based on observations made with the NASA/ESA Hubble Space Telescope under the LEGUS survey. Support for Program number 13364 was provided by NASA through a grant from the Space Telescope Science Institute, which is operated by the Association of Universities for Research in Astronomy, Incorporated, under NASA contract NAS5-26555. A.A. acknowledges the support of the Swedish Research Council (Vetenskapsrdet) and the Swedish National Space Board (SNSB). M.F. acknowledges support by the UK Science and Technology Facilities Council (grant number ST/P000541/1). S.G. appreciates funding from the National Science Foundation grant AST-1461200 to Northern Arizona University for Research Experiences for Undergraduates summer internships and Drs. Kathy Eastwood and David Trilling for running the NAU REU program in 2016. S.G. also appreciates the support of the 2016 CAMPARE Scholar program and Dr. Alexander Rudolph for directing that program. Facilities: VLA, HST(ACS, UVIS), Lowell Observatory. ORCID iDs Deidre A. Hunter https://orcid.org/0000-0002-3322-9798 Angela Adamo https://orcid.org/0000-0002-8192-8091 David O. Cook https://orcid.org/0000-0002-6877-7655 Se-Heon Oh https://orcid.org/0000-0002-5648-9920 Bruce G. Elmegreen https://orcid.org/0000-00021723-6330 Hwihyun Kim https://orcid.org/0000-0003-4770-688X Lauren Kahre https://orcid.org/0000-0002-2037-3096 Michele Fumagalli https://orcid.org/0000-0001-6676-3842 Elena Sacchi https://orcid.org/0000-0001-5618-0109 Monica Tosi https://orcid.org/0000-0002-0986-4759 Daniel A. Dale https://orcid.org/0000-0002-5782-9093 Michele Cignoni https://orcid.org/0000-0001-6291-6813 Eva K. Grebel https://orcid.org/0000-0002-1891-3794 Dimitrios A. Gouliermis https://orcid.org/0000-00022763-0075 Elena Sabbi https://orcid.org/0000-0003-2954-7643 Kathryn Grasha https://orcid.org/0000-0002-3247-5321 John S. Gallagher, III https://orcid.org/0000-00018608-0408 Daniela Calzetti https://orcid.org/0000-0002-5189-8004 Janice C. Lee https://orcid.org/0000-0002-2278-9407 References Adamo, A., Kruijssen, J. M. D., Bastian, N., Silva-Villa, E., & Ryon, J. 2015, MNRAS, 452, 246 Adamo, A., Ryon, J. E., Messa, M., et al. 2017, ApJ, 841, 131. 13.
(14)
Figure


+7


Documento similar
On the other hand at Alalakh Level VII and at Mari, which are the sites in the Semitic world with the closest affinities to Minoan Crete, the language used was Old Babylonian,
1. S., III, 52, 1-3: Examinadas estas cosas por nosotros, sería apropiado a los lugares antes citados tratar lo contado en la historia sobre las Amazonas que había antiguamente
The main goal of this work is to extend the Hamilton-Jacobi theory to different geometric frameworks (reduction, Poisson, almost-Poisson, presymplectic...) and obtain new ways,
The paper is structured as follows: In the next section, we briefly characterize the production technology and present the definition of the ML index as the geometric mean of
In the previous sections we have shown how astronomical alignments and solar hierophanies – with a common interest in the solstices − were substantiated in the
Díaz Soto has raised the point about banning religious garb in the ―public space.‖ He states, ―for example, in most Spanish public Universities, there is a Catholic chapel
teriza por dos factores, que vienen a determinar la especial responsabilidad que incumbe al Tribunal de Justicia en esta materia: de un lado, la inexistencia, en el
We explore the impact of cosmic reionization on nearby isolated dwarf galaxies using a com- pilation of star formation histories estimated from deep HST data and a cosmological
