Discovery of a very bright strongly lensed galaxy candidate at z approximate to 7 6
8
0
0
Texto completo
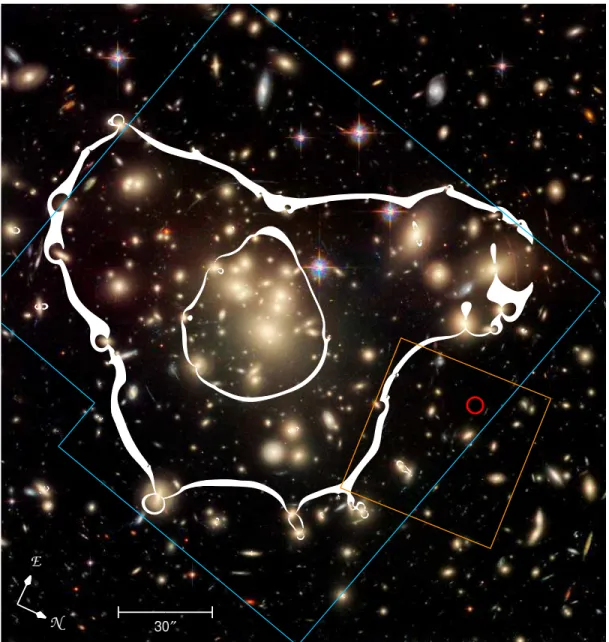
(2) 2. BRADLEY ET AL.. Fig. 1.— ACS color image (3.4′ × 3.4′ ) of Abell 1689. The regions surveyed by our followup NICMOS J110 and H160 images are illustrated by the blue and orange outlines, respectively. A1689-zD1 is located at J2000 coordinates α = 13h 11m 29.96s , δ = −1◦ 19′ 18.7′′ and is denoted by the red circle. The white contours represent the z = 7.6 critical curves (µ ≥ 200).. increase both the flux and size of background sources. These gains make it possible to detect faint high-redshift galaxies (Kneib et al. 1996; Pelló et al. 1999; Ellis et al. 2001; Hu et al. 2002; Kneib et al. 2004; Egami et al. 2005; Frye et al. 2007) without requiring a huge investment of observing time, such as that dedicated to the Hubble Ultra Deep Field (Beckwith et al. 2006). The key to making the subsequent analyses viable is having detailed cluster magnification maps that constrain the “optics” of the “cosmic telescope”. Our team has been among the first to overcome this difficulty by using multiband HST ACS data to perform detailed studies of massive rich galaxy clusters, including Abell 1689 (Broadhurst et al. 2005; Zekser et al. 2006, Coe et al. 2008, in preparation) and CL0024+17 (Jee et al. 2007), to a precision useful for studying the properties of the background galaxy population. In this paper, we present the discovery of a bright strongly lensed Lyman break galaxy (LBG) candidate. at z ∼ 7.6 in the field of the massive cluster Abell 1689. We adopt a cosmology with Ωm = 0.3, ΩΛ = 0.7, and H0 = 70 km s−1 Mpc−1 . This provides an angular scale of 5.0 kpc arcsec−1 at z = 7.6. All magnitudes are given in the AB photometric system (Oke 1974). 2. OBSERVATIONS AND PHOTOMETRY 2.1. HST ACS and NICMOS Data. Abell 1689 is a well-studied and massive galaxy cluster at z = 0.183. With an unequaled Einstein radius of ∼50′′ , it is the strongest gravitational lens known (Broadhurst et al. 2005). We observed the central 3.4′ × 3.4′ of Abell 1689 with a single pointing of the ACS Wide Field Camera (WFC) in 2002 June (see Fig. 1). The observations consisted of 20 orbits divided among four broadband filters: F475W (g475 ; 9500 s), F625W (r625 ; 9500 s), F775W (i775 ; 11800 s), and F850LP (z850 ; 16600 s). In 2005 May, we followed up our ACS observations with 18 orbits of Near Infrared Camera and Multi-.
(3) STRONGLY LENSED LYMAN BREAK GALAXY CANDIDATE. 3. TABLE 1 Photometry Summary Measurement. g475. r625. i775. z850. J110. H160. [3.6 µm]. [4.5 µm]. [5.8 µm]. [8.0 µm]. A1689-zD1 Observed Magnitude A1689-zD1 Intrinsic Magnitude Companion Magnitudea. > 28.3 > 30.7 27.4 (0.1). > 27.8 > 30.2 26.4 (0.1). > 27.8 > 30.2 26.1 (0.1). > 27.5 > 29.9 25.9 (0.1). 25.3 (0.1) 27.7 (0.1) 25.0 (0.1). 24.7 (0.1) 27.1 (0.1) 24.3 (0.1). 24.2 (0.3) 26.6 (0.3) 25.0 (0.3). 23.9 (0.3) 26.3 (0.3) 24.3 (0.3). > 23.9 > 26.3 > 23.9. > 23.4 > 25.8 > 23.4. Note. — Errors (1 σ) are given in parenthesis. Intrinsic values were calculated assuming a cluster magnification of µ = 9.3 (see § 3). The [5.8 µm] and [8.0 µm] magnitudes are 1 and 2 σ upper limits, respectively. Because Abell 1689 lies in the plane of the ecliptic, the zodiacal light background is high and increases in the [5.8 µm] and [8.0 µm] bands, limiting our ability to detect the object in these two bands. a We include the photometry of this nearby source because it overlaps A1689-zD1 in the IRAC images and may therefore contaminate mildly our flux measurement of A1689-zD1.. Fig. 2.— Cutout images (P.A. = 115◦ ) from the HST ACS (g475 , r625 , i775 , z850 , and “Det” – “detection”), HST NICMOS (J110 and H160 ), and Spitzer IRAC (3.6, 4.5, 5.8, and 8.0 µm) data centered on A1689-zD1. The source is undetected (< 1 σ) in the ACS data, including the 20-orbit combined “detection” image, and also not formally detected at 5.8 and 8.0 µm. The fluctuations that are present in the 5.8 and 8.0 µm images near the position of A1689-zD1 are consistent with being noise. The cutout images are 5′′ × 5′′ , corresponding to 25 kpc on a side at z = 7.6.. Object Spectrometer (NICMOS)/NIC3 F110W (J110 ) imaging to search for z850 -dropout candidates. The observations cover the central 2.5′ × 2.5′ high-magnification region of the cluster with a 9-pointing 3 × 3 mosaic (5376 s per NIC3 field). The bright LBG candidate, which we refer to as A1689zD1, was discovered by comparing the ACS/WFC z850 and NICMOS/NIC3 J110 data. The galaxy has an observed magnitude of 25.3±0.1 in the NICMOS J110 band and a strong z850 − J110 break of > 2.2 mag (see Table 1). With a magnification of µ ≈ 9.3, A1689-zD1 is strongly lensed by the foreground cluster and is ∼1.3 mag brighter (as observed) than the brightest-known z850 dropout (z ∼ 7−8) galaxy (Bouwens & Illingworth 2006; Bouwens et al. 2008). A1689-zD1 is completely undetected (< 1 σ) in the ACS g475 , r625 , i775 , and z850 data as well as in the 20orbit ACS rms-weighted “detection” image constructed by co-adding all of the ACS images (see Fig. 2). The 1 σ detection limits for this galaxy are 28.3, 27.8, 27.8, and 27.5 in the g475 , r625 , i775 , and z850 bands, respectively. To verify that A1689-zD1 was not a low-redshift reddened interloper, we acquired a single-orbit NIC3 F160W (H160 ) image of the source in 2007 June. Combining these data with the earlier NICMOS J110 data, we measure a J110 − H160 color of 0.6 ± 0.2. This is exactly what one would expect for an LBG at z ∼ 7.4 − 7.7 (see, e.g., Fig. 1 in the Supplementary Information of Bouwens & Illingworth 2006), but much bluer than a reddened object at lower redshift. Note that the strong z850 − J110 break and the blue color redward of the break are precisely the two criteria used to define highredshift LBGs. Together this information provides compelling evidence that our source is a star-forming galaxy at z ∼ 7.4 − 7.7. A1689-zD1 is not detected in the individual J110 and H160 dither exposures (∼640 sec, 4 dithers per orbit), but there also does not appear to be any artifacts (e.g., cosmic rays) at the object position. Given the similar morphology in both the J110 and H160 images, which were taken about two years apart, and also that A1689zD1 was located at different detector positions in the J110 and H160 images, we are confident that A1689-zD1 is not. a spurious detection. We present in Figure 3 the observed and intrinsic (lenscorrected) H160 magnitudes of A1689-zD1 relative to other z ∼ 7 − 8 galaxy candidates (Bouwens et al. 2008). While the observed (uncorrected) brightness of A1689zD1 is ∼1.3 mag brighter than the brightest z ∼ 7 − 8 candidate, its intrinsic (lens-corrected) magnitude is very similar to that of other z850 -dropout galaxies. 2.2. Spitzer IRAC Data Further evidence supporting the interpretation of A1689-zD1 as a z ∼ 7.6 LBG comes from archival Spitzer IRAC data (GO 20439, PI: Egami). In 2006, ultradeep IRAC imaging was obtained for Abell 1689 in the 3.6, 4.5, 5.8, and 8.0 µm bands (11.1 hours per band). Our LBG candidate is detected as a point-source in the IRAC 3.6 and 4.5 µm bands. The large size of the IRAC point-spread function (PSF; FWHM ∼ 2′′ ) poses a difficulty in that neighboring objects may significantly contaminate the photometry. In our case, we find that A1689-zD1 is blended with a nearby foreground object, which is separated by ∼ 1.5′′ . As seen in Figure 2, the foreground galaxy is rather blue and we estimate its photometric redshift (Benı́tez 2000) is ∼ 2.2. To correct for the contamination of nearby objects, we convolved the NICMOS H160 detections of A1689-zD1 and its neighbors with the IRAC PSF for a given band. The H160 PSF-convolved objects were then simultaneously fitted to the IRAC data, allowing the relative flux scalings as free parameters. The fitted neighbors, which contributed ∼ 32% to the original flux, were then subtracted from the IRAC data, leaving the LBG source. We estimate that the neighbor subtraction induces an additional ∼0.2 mag of uncertainty to the IRAC photometry. To minimize background noise and to further limit flux contamination from nearby objects, we performed the Spitzer IRAC photometry using a 2.5′′ diameter aperture. Assuming a stellar profile to correct the fluxes for light falling outside the aperture, we applied aperture corrections of 0.56 and 0.60 mag to the [3.6 µm] and [4.5 µm] bands, respectively. We measure observed magnitudes of 24.2 and 23.9 in the [3.6 µm] and [4.5 µm].
(4) 4. BRADLEY ET AL.. Observed Fν (µJy). 1.00. Z = 0.02 (Solar Metallicity). 0.10. SSP z=7.4 1.6 × 10⁹ Msun 45 Myr τ90 z=7.5 2.7 × 10⁹ Msun 136 Myr CSF z=7.6 3.6 × 10⁹ Msun 320 Myr. 0.01. Fig. 3.— Histogram of H160 magnitudes for z850 -dropout (z ∼ 7−8) galaxies (Bouwens et al. 2008). We denote both the observed (uncorrected) and intrinsic (lens-corrected) magnitudes of A1689zD1. While the observed brightness of A1689-zD1 is ∼ 1.3 mag brighter than the brightest z ∼ 7 − 8 candidate, its intrinsic (lenscorrected) magnitude is very similar to that of other z850 -dropout galaxies.. bands, respectively. The [5.8 µm] and [8.0 µm] upper limits are 23.9 (1 σ) and 23.4 (2 σ), respectively. The broadband photometry of A1689-zD1 is summarized in Table 1 and the HST /ACS, HST /NICMOS, and Spitzer IRAC cutout images are shown in Figure 2. 3. SOURCE MAGNIFICATION. It is valuable to calculate the intrinsic properties of A1689-zD1 by using strong lensing models available for Abell 1689 (e.g, Broadhurst et al. 2005, Coe et al. 2008, in preparation). For an improved version of the Broadhurst et al. (2005) strong lensing model and a redshift of z ∼ 7.6 (see § 4), we estimate a magnification µ of ∼ 9.3, which appears to be roughly consistent with other models in the literature (Halkola et al. 2006; Limousin et al. 2007, Coe et al. 2008, in preparation). The improved Broadhurst lensing model is based on 42 sets of multiple images (12 more than Broadhurst et al. 2005), with several new counterimages close to the cluster center. Based on the mean slope of the radial mass profile, which is the most influential model parameter, we estimate that the 1 σ error on the magnification is at least 15%. The error is derived from the allowed range in radial slope parameters that are consistent with the data. However, comparison with other Abell 1689 models, e.g., Coe et al. 2008 (in preparation; µ = 7.3 for A1689-zD1), suggests that a more realistic value of the systematic uncertainty in our magnification value is ∼25%. When corrected for the cluster magnification of 9.3, the intrinsic magnitudes of A1689-zD1 are 27.7, 27.1, 26.6, and 26.3 in the J110 , H160 , [3.6 µm], and [4.5 µm] bands, respectively. 4. STELLAR POPULATION MODELS. To constrain the stellar populations of A1689-zD1, we fit the stellar population models of Bruzual & Charlot (2003) to the multiband photometry. We used a Salpeter (1955) initial mass function (IMF) with mass cutoffs of 0.1 and 100 M⊙ and explored models with both solar (Z = 0.02) and subsolar (Z = 0.0004 = Z⊙ /50) metallicities. The effect of dust reddening is included in the models using the Calzetti et al. (2000) obscuration law. We correct for Lyman-series line-blanketing and photoelectric absorption following the prescription of Madau (1995). In the stellar population model fits, we constrain. Observed Fν (µJy). 1.00. Z = 0.0004 (Subsolar Metallicity). 0.10. SSP z=7.6 2.1 × 10⁹ Msun 72 Myr τ90 z=7.7 2.8 × 10⁹ Msun 157 Myr CSF z=7.6 3.9 × 10⁹ Msun 320 Myr. 0.01 1•104. 2•104 3•104 4•104 Observed Wavelength (Å). 5•104. Fig. 4.— Best-fit stellar population models to the broadband photometry of our z ∼ 7.6 candidate. Solar metallicity models are shown in the top panel, with the subsolar (Z = Z⊙ /50) models in the bottom panel. The vertical bars denote the 1 σ flux uncertainties and the horizontal bars represent the width of the filter bandpass. The optical ACS non-detections are shown as 1 σ upper limits.. the stellar age to be less than the age of the universe at the fit redshift (e.g., 0.7 Gyr at z ∼ 7.5). We considered several star-formation histories (SFH) including a simple (single-burst) stellar population (SSP), an exponentially declining star-formation rate (SFR; τ models) with e-folding times between 10 and 100 Myr, and constant SFR (CSF) models with SFRs up to 30 M⊙ yr−1 . The best-fit stellar population models are shown in Figure 4 and the parameters are given in Table 2. For both solar and subsolar metallicities, we find acceptable fits for the models. The best-fit redshifts are in the range from 7.4 < z < 7.7 with an 1 σ error of 0.3 − 0.4 and a median value of 7.6. A crosscheck of the redshift was also performed using the Bayesian photometric redshift (BPZ) code of Benı́tez (2000) and showed that A1689zD1 is certainly z > 7, with the probably concentrated at 7 < z < 8 and a spectral type between a Kinney et al. (1996) SB2 and SB3. To examine the possibility that this source could be a highly-reddened galaxy at low redshift, we re-fit the stellar population models by restricting the redshift to be z ≤ 4. The best-fit τ90 low-redshift solution is at a redshift of z = 1.6 with AV = 1.0, but the fit is particularly poor (χν = 25). As seen in Figure 5, the low-redshift models do not agree with the upper limits on the i775 and z850 fluxes and do not reproduce the strong z850 − J110 break, even with ≥ 1.0 mag of extinction. In Figure 6, we plot the χ2ν values of the best-fitting τ90 solar-metallicity models as a function of redshift and reddening. We find that the low-redshift solutions (1.5 . z . 2.0) all provide a much poorer fit to the data than the high-redshift (z > 6.5) solutions. To further make the point, we looked at a single observational parameter, the z850 − J110 color. In Figure 7, we plot the z850 − J110 color as a function of redshift for a range of reddened (0 ≤ AV ≤ 5) 100 Myr SSP solar metallicity models. The low-redshift models, even with extremely large values of the reddening, are.
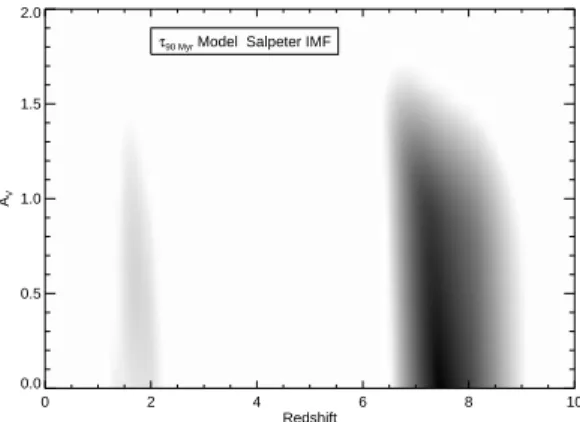
(5) STRONGLY LENSED LYMAN BREAK GALAXY CANDIDATE. 5. TABLE 2 Best-fit Stellar Population Model Results. SFHa. zphot. zform b. SSP τ90 CSF. 7.4 ± 0.3 7.5 ± 0.3 7.6 ± 0.4. 7.8 9.7 63.4. Massc (109 M⊙ ). Aged (Myr). SFR (M⊙ yr−1 ). AV. χ2ν. 0.0 ± 0.2 0.0 ± 0.2 0.1 ± 0.2. 1.4 1.2 0.9. 0.0 ± 0.2 0.0 ± 0.2 0.3 ± 0.2. 1.1 0.7 0.6. Solar Metallicity (Z = 0.02) 1.6 ± 0.7 2.7 ± 0.4 3.6 ± 1.4. 45 136 320. 0 3.2 6.9. Subsolar Metallicity (Z = 0.0004) SSP τ90 CSF. 7.6 ± 0.4 7.7 ± 0.3 7.6 ± 0.4. 8.3 10.5 63.4. 2.1 ± 0.9 2.8 ± 1.1 3.9 ± 1.6. 72 157 320. 0 2.4 7.6. a Star-formation history (SFH): simple (single-burst) stellar population (SSP), exponentially declining SFR (τ models) where the subscript represents the e-folding time in Myr, or constant SFR (CSF) models. b Formation redshift calculated from the fitted redshift and (unweighted) stellar age. c Best-fit stellar mass, corrected by the magnification at the fitted z phot redshift. d SFR-weighted mean stellar age (cf. Förster Schreiber et al. 2004).. unable to reproduce the strong z850 − J110 break of 2.2 mag observed for A1689-zD1.. Observed Fν (µJy). 1.00. Z = 0.02 (Solar Metallicity) 0.10. SSP z=1.7 0.9 × 10⁹ Msun 202 Myr AV = 1.3 τ90 z=1.6 0.7 × 10⁹ Msun 421 Myr AV = 1.0 τ90 z=7.5 2.7 × 10⁹ Msun 133 Myr AV = 0.0. 0.01 1•104. 2•104 3•104 Observed Wavelength (Å). 4•104. 5•104. Fig. 5.— Fits to the observed photometry with stellar population models at z < 4 (red, green) and z > 4 (blue). Note that the low-redshift SSP (χν = 27) and τ90 (χν = 25) solutions do not agree with the i775 and z850 upper limits and cannot reproduce the strong z850 − J110 break, even with ≥ 1.0 mag of extinction. Also note that because the break in the SED occurs well within the J110 band, the measured flux at 1.1 µm should be appreciably below the continuum level. We find that the z ∼ 7.5 fit is quite reasonable (χν = 1.1).. 5. SOURCE-PLANE DEPROJECTION 5.1. Morphology The detailed Abell 1689 cluster deflection map (see § 3) allows us to deproject the NICMOS J110 and H160 images of A1689-zD1 to the source plane at z ∼ 7.6. The substantial magnification of the source provides us with a unique opportunity to examine the morphology of a z ∼ 7.6 galaxy at very high resolution. The deprojected images of A1689-zD1 in the J110 and H160 bands are presented in Figure 8. The galaxy shows an extended morphology in both the image and source planes, spanning ∼ 0.4′′ (2.0 kpc) in the source plane. The remarkable consistency of the morphology in both the J110 and H160 bands as well as the > 8 σ detection in each band provides strong evidence that the source is real and not a spurious detection. In both images, A1689-zD1 appears to be comprised of at least two bright, marginally resolved knots connected by a lower-luminosity region. The brighter knot is lo2.0 τ90 Myr Model Salpeter IMF. For our preferred high-redshift solutions, we find stellar masses of (1.6 − 3.6) × 109 M⊙ for the solar metallicity models and slightly higher masses of (2.1−3.9) × 109 M⊙ for the subsolar metallicity models. In a similar fashion, the subsolar metallicity models generally produce slightly older ages (72 − 320 Myr) than the solar metallicity models (45 − 320 Myr). These stellar mass and age estimates are in the range of those previously estimated by Labbé et al. (2006) for a HUDF-selected z850 -dropout (z ∼ 7) sample. The derived instantaneous SFRs show modest star formation with rates up to 7.6 M⊙ yr−1 . Most of the models require little reddening, with AV ≤ 0.3, which is in agreement with results for z ∼ 6 LBGs (Yan et al. 2005; Dow-Hygelund et al. 2005; Eyles et al. 2006). While we assumed a Salpeter IMF, fitting models using a Chabrier (2003) IMF yields ∼ 1.5 times lower stellar masses and roughly similar ages.. AV. 1.5. 1.0. 0.5. 0.0 0. 2. 4. 6. 8. 10. Redshift. Fig. 6.— Likelihood plot showing the χ2ν values of the bestfitting τ90 solar-metallicity models as a function of redshift and reddening. Black corresponds to the lowest χ2ν value (1.1), the gray contours at z ∼ 1.3 − 2.2 correspond to 25 ≤ χ2ν < 30, and white to χ2ν ≥ 30. The grayscale colors are displayed with a square-root stretch to compress the dynamic range of χ2ν values. Clearly, the best low-redshift solutions (1.5 . z . 2.0) provide a much poorer fit (χ2ν ≥ 25) to the data than the high-redshift (z > 6.5) solutions..
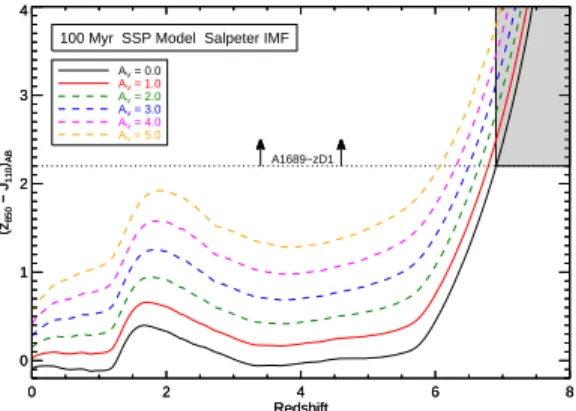
(6) 6. BRADLEY ET AL. varies as (1 + z)−1.1±0.3 (Bouwens et al. 2006, see also Ferguson et al. 2004; Bouwens et al. 2004a). A1689-zD1 has a delensed H160 magnitude of 27.1, which corresponds to ∼ 0.3L∗z=3 (Steidel et al. 1999). Scaling the mean sizes (∼1.3 kpc) of ∼ 0.3L∗z=3 LBGs at z ∼ 3.8 (Bouwens et al. 2004a), we would expect a mean halflight radius at z ∼ 7.6 of 0.7 ± 0.1 kpc. While this is slightly smaller than the half-light radius of A1689-zD1, there is at least a ±20% dispersion in galaxy sizes about the mean size at any given redshift.. 4 100 Myr SSP Model Salpeter IMF. (z850 − J110)AB. 3. AV = 0.0 AV = 1.0 AV = 2.0 AV = 3.0 AV = 4.0 AV = 5.0 A1689−zD1. 2. 1. 0 0. 2. 4 Redshift. 6. 8. Fig. 7.— Plot showing (z850 − J110 )AB color as a function of redshift for a range of reddened (0 ≤ AV ≤ 5) 100 Myr SSP solar metallicity models. Even with extremely large values of the reddening, the low-redshift models are unable to reproduce the strong z850 − J110 break of 2.2 mag observed for A1689-zD1. Because we must fit the entire SED of the galaxy, the reddening cannot be increased arbitrarily to fit only the z850 − J110 break. For example, reddening values of AV & 1.5 (dashed lines) produce fits that are inconsistent with the observed H160 −[4.5 µm] color of A1689-zD1. The gray box shows the redshift range where the stellar population models are consistent with the z850 − J110 color.. cated to the southwest of the secondary knot and is separated from it by ∼ 0.26′′ (1.3 kpc). Performing fits to the individual knots with GALFIT (Peng et al. 2002), we find that most of the luminosity of A1689-zD1 is emitted from the knots. The brighter (fainter) knot contributes ∼ 2/3 (∼ 1/3) of the total luminosity of A1689-zD1. The J110 − H160 colors of the two knots are roughly consistent, with values of 0.5±0.2 and 0.8±0.2 for the brighter and fainter knots, respectively. The knots are compact and have half-light radii . 0.06′′ (0.3 kpc) in the source plane. The concentration of a significant fraction of the total flux in compact star-forming knots is consistent with findings for starburst galaxies over a wide range of redshifts (e.g., Meurer et al. 1995; Law et al. 2007; Smail et al. 2007; Overzier et al. 2007) and as shown quite dramatically in the z = 4.92 lensed galaxy pair in CL 1358+62 (Franx et al. 1997). The knots in A1689zD1 are likely separate star-forming regions within the galaxy, but they could conceivably be interpreted as small star-forming galaxies merging at high redshift. 5.2. Half-Light Radius. We calculated the half-light radius of A1689-zD1 by defining the circular aperture containing half the total Kron flux (Kron 1980). For A1689-zD1 we measure a half-light radius of 0.48′′ , which translates to ∼ 0.19′′ (0.96 kpc) in the source-plane at z ∼ 7.6. The size translation was derived by comparing the size of the object along its major axis in both the image and source planes. As demonstrated by the PSF ellipses in Figure 8, the magnification of A1689-zD1 is greater along its minor axis than its major axis. This results in a source-toimage-plane size scaling along the galaxy major axis of 2.5, which is slightly smaller than the value one would obtain by assuming that the magnification is the same in √ all directions ( 9.3 = 3.0). Though there is a fair amount of dispersion in the size of individual galaxies in high-redshift dropout samples, the mean size of galaxies at a given luminosity. 5.3. Counterimages We also used the improved Broadhurst et al. (2005) Abell 1689 strong lensing model (see § 3) to look for potential counterimages of A1689-zD1. We re-projected the source image at z ∼ 7.6 back to the image plane at z ∼ 0.18 and found that the model does not predict any counterimages. For a simple isothermal sphere model with an Einstein radius of RE , one would expect that an object at radius r would have a counterimage on the opposite side of the cluster at a distance of 2RE − r. However, because of the complexity of the Abell 1689 lensing model, not every background object is guaranteed to produce a counterimage. 6. ULTRAVIOLET (UV) LUMINOSITY FUNCTION (LF). In theory our discovery of one very bright z850 -dropout in the ∼ 6 arcmin2 J110 -band coverage around Abell 1689 should allow us to estimate the volume density of UVbright galaxies at z ∼ 7. To explore this further, we generated mock images based on the UV LF, sizes, and colors of LBGs at z ∼ 6 found by Bouwens et al. (2007) and Bouwens et al. (2006) and magnified them according to the Broadhurst et al. (2005) Abell 1689 deflection map. Unfortunately, from these no-evolution simulations we estimate that we would expect to find only ∼ 0.2 galaxies over our search area. This suggests that there is very little that we could learn about the UV LF from our z850 -dropout survey around Abell 1689, and that, in fact, we may have been quite fortunate to find the bright candidate A1689-zD1. Even though the cluster magnification increases the typical depth by ∼ 2 − 3 mag, the effective source-plane area that is surveyed decreases inversely proportional to the magnification factor. The very small number of expected candidates follows from the tiny area (. 0.5 arcmin2 ) that the J110 -band coverage probes in the source plane at z ≥ 7. If the effective slope of the LF was large enough (d(log10 N )/dm & 0.4; Broadhurst et al. 1995), we would expect the greater depth to more than make up for the smaller search area. The only place the effective slope would be greater than ∼0.4 is for luminosities above L∗ , unless we assume that the LF at z ∼ 7 − 8 is steeper than at z ∼ 6 (i.e. α ≈ −1.74, as determined by Bouwens et al. 2007, which corresponds to d(log10 N )/dm ∼ 0.3). Despite the small expected numbers, the present search around Abell 1689 should be more efficient at finding L∗ galaxies at z & 7 than a search without the lensing amplification. However, lensing may not provide as great an advantage in searches for galaxies fainter than L∗ , given recent measurements of the faint-end slope [where d(log10 N )/dm ∼ 0.3]. 7. PREVIOUS z & 6 LENSED LBG CANDIDATES.
(7) STRONGLY LENSED LYMAN BREAK GALAXY CANDIDATE. N. 7. N. 1 kpc. E. 1 kpc. E. Fig. 8.— Source-plane deprojection of the NICMOS J110 (left) and H160 (right) images of A1689-zD1. The morphology is remarkably consistent in both images, showing an extended morphology that spans ∼ 0.4′′ (2.0 kpc) in the source plane. A1689-zD1 appears to be comprised of two compact knots, denoted by the dotted red circles, connected by a lower-luminosity region. Each knot appears to have an intrinsic half-light radius that is less than 300 pc (see § 5.1). The solid white ellipses represent the NIC3 J110 and H160 PSFs (0.33′′ and 0.37′′ FWHM, respectively), delensed to the source plane at z = 7.6.. High-redshift z & 6 galaxy candidates have been previously identified in searches around strong lensing clusters (Hu et al. 2002; Kneib et al. 2004; Richard et al. 2006). For example, in the field of the lensing cluster Abell 2218, Kneib et al. (2004) found a very highly magnified (µ ∼ 25) and triply imaged LBG candidate near the critical curve. They infer a redshift for the candidate of 6.6 < z < 7.1 from the broadband ACS and NICMOS photometry. However, because of the significant detection that their source shows in the z850 band and the modest z850 − J110 ∼ 0.4 break, we are confident that this source is at a redshift lower than A1689-zD1 (where z850 − J110 > 2.2). Using VLT ISAAC observations of Abell 1835 and AC114, Richard et al. (2006) identified 13 (first and second category) very bright LBG z & 6 candidates (2.5 σ detections), some of which are ∼ 1 mag brighter than A1689-zD1. We can evaluate the reliability of these sources by looking at the 5 candidates for which much deeper NICMOS H160 -band data exist. The deep NIC3 H160 observations (∼ 0.7 arcmin2 ) of Abell 1835 and AC114 reach a 5 σ limiting magnitude of ∼ 26.8 AB, which is ∼ 2 mag deeper than their VLT ISSAC data. Unfortunately, the 2 first and second category candidates (highest confidence) and the 5 first, second, and third category candidates (slightly lower confidence) covered by the NICMOS fields show no detection (< 2 σ) in the. these data. This suggests that their sample of first, second, and third category z & 6 candidates is largely spurious (Bouwens et al. 2008). Given its secure detection significance (8 σ), broadband colors, and strength of its z850 − J110 break, A1689-zD1 is the brightest LBG candidate that we can confidently place at a redshift z & 7. 8. SUMMARY AND CONCLUSIONS. We report the discovery of a strongly lensed LBG candidate (A1689-zD1) at z ∼ 7.6 in the field of the massive galaxy cluster Abell 1689. A1689zD1 is ∼1.3 mag brighter than the current brightest known z850 -dropout galaxy (Bouwens & Illingworth 2006; Bouwens et al. 2008). We find a strong z850 − J110 break of at least 2.2 mag and best-fit photometric redshift of z ∼ 7.6. Employing a detailed cluster deflection model, we delensed the source to examine its intrinsic properties. We estimate a magnification of 9.3 at z ∼ 7.6 at the position of A1689-zD1. The high detection significance (> 8 σ) of A1689-zD1 and the consistency of the morphology in both the J110 and H160 bands provide strong evidence that the source is real and not a spurious detection. The source plane deprojection shows that the star formation is occurring in compact knots of size . 300 pc. Using stellar population models to fit the rest-frame UV and optical fluxes, we derive best-fit values for stellar masses (1.6−3.9) × 109 M⊙ , stellar ages 45−320 Myr,.
(8) 8. BRADLEY ET AL.. and star-formation rates < 7.6 M⊙ yr−1 , properties generally similar to z ∼ 5 − 6 LBGs. A1689-zD1, with a redshift of z ∼ 7.6 and a formation redshift z & 8.0 (t . 0.63 Gyr), is the brightest observed, highly reliable z > 7.0 galaxy candidate found to date. Given the unique brightness of A1689-zD1, we are actively working to confirm its redshift with near-IR spectroscopy. A spectrum of this bright galaxy would allow for the most detailed study of a z > 7 LBG to date and provide valuable insights into the properties of galaxies in the early universe.. Brad Holden for helpful discussions. ACS was developed under NASA contract NAS 5-32865, and this research has been supported by NASA grants NAG5-7697 and HST-GO10150.01-A and by an equipment grant from Sun Microsystems, Inc. The Space Telescope Science Institute is operated by AURA Inc., under NASA contract NAS5-26555. We are grateful to K. Anderson, J. McCann, S. Busching, A. Framarini, S. Barkhouser, and T. Allen for their invaluable contributions to the ACS project at JHU. L.I. acknowledges support from a Conicyt Fondap grant.. We would like to thank Dan Coe, Andrew Zirm, and REFERENCES Beckwith, S. V. W., et al. 2006, AJ, 132, 1729 Benı́tez, N. 2000, ApJ, 536, 571 Bouwens, R. J., & Illingworth, G. D. 2006, Nature, 443, 189 Bouwens, R. J., Illingworth, G. D., Blakeslee, J. P., Broadhurst, T. J., & Franx, M. 2004a, ApJ, 611, L1 Bouwens, R. J., Illingworth, G. D., Blakeslee, J. P., & Franx, M. 2006, ApJ, 653, 53 Bouwens, R. J., Illingworth, G. D., Franx, M., & Ford, H. 2007, ApJ, 670, 928 —. 2008, ApJ, submitted (arXiv: 0803.0548) Bouwens, R. J., et al. 2004b, ApJ, 616, L79 Broadhurst, T., et al. 2005, ApJ, 621, 53 Broadhurst, T. J., Taylor, A. N., & Peacock, J. A. 1995, ApJ, 438, 49 Bruzual, G., & Charlot, S. 2003, MNRAS, 344, 1000 Bunker, A. J., Stanway, E. R., Ellis, R. S., & McMahon, R. G. 2004, MNRAS, 355, 374 Calzetti, D., Armus, L., Bohlin, R. C., Kinney, A. L., Koornneef, J., & Storchi-Bergmann, T. 2000, ApJ, 533, 682 Chabrier, G. 2003, PASP, 115, 763 Chary, R.-R., Teplitz, H. I., Dickinson, M. E., Koo, D. C., Le Floc’h, E., Marcillac, D., Papovich, C., & Stern, D. 2007, ApJ, 665, 257 Dow-Hygelund, C. C., et al. 2005, ApJ, 630, L137 Egami, E., et al. 2005, ApJ, 618, L5 Ellis, R., Santos, M. R., Kneib, J.-P., & Kuijken, K. 2001, ApJ, 560, L119 Eyles, L. P., Bunker, A. J., Ellis, R. S., Lacy, M., Stanway, E. R., Stark, D. P., & Chiu, K. 2006, MNRAS, 1348 Fan, X., Carilli, C. L., & Keating, B. 2006, ARA&A, 44, 415 Ferguson, H. C., et al. 2004, ApJ, 600, L107 Förster Schreiber, N. M., et al. 2004, ApJ, 616, 40 Franx, M., Illingworth, G. D., Kelson, D. D., van Dokkum, P. G., & Tran, K.-V. 1997, ApJ, 486, L75+ Frye, B. L., et al. 2007, ApJ, 665, 921 Giavalisco, M., et al. 2004, ApJ, 600, L103 Halkola, A., Seitz, S., & Pannella, M. 2006, MNRAS, 372, 1425 Hu, E. M., Cowie, L. L., McMahon, R. G., Capak, P., Iwamuro, F., Kneib, J.-P., Maihara, T., & Motohara, K. 2002, ApJ, 568, L75 Iye, M., et al. 2006, Nature, 443, 186 Jee, M. J., et al. 2007, ApJ, 661, 728 Kinney, A. L., Calzetti, D., Bohlin, R. C., McQuade, K., Storchi-Bergmann, T., & Schmitt, H. R. 1996, ApJ, 467, 38. Kneib, J.-P., Ellis, R. S., Santos, M. R., & Richard, J. 2004, ApJ, 607, 697 Kneib, J.-P., Ellis, R. S., Smail, I., Couch, W. J., & Sharples, R. M. 1996, ApJ, 471, 643 Kron, R. G. 1980, ApJS, 43, 305 Labbé, I., Bouwens, R., Illingworth, G. D., & Franx, M. 2006, ApJ, 649, L67 Law, D. R., Steidel, C. C., Erb, D. K., Pettini, M., Reddy, N. A., Shapley, A. E., Adelberger, K. L., & Simenc, D. J. 2007, ApJ, 656, 1 Lehnert, M. D., & Bremer, M. 2003, ApJ, 593, 630 Limousin, M., et al. 2007, ApJ, 668, 643 Madau, P. 1995, ApJ, 441, 18 Meurer, G. R., Heckman, T. M., Leitherer, C., Kinney, A., Robert, C., & Garnett, D. R. 1995, AJ, 110, 2665 Mobasher, B., et al. 2005, ApJ, 635, 832 Oke, J. B. 1974, ApJS, 27, 21 Overzier, R. A., et al. 2007, preprint (arXiv: 0709.3304) Page, L., et al. 2007, ApJS, 170, 335 Pelló, R., et al. 1999, A&A, 346, 359 Peng, C. Y., Ho, L. C., Impey, C. D., & Rix, H.-W. 2002, AJ, 124, 266 Richard, J., Pelló, R., Schaerer, D., Le Borgne, J.-F., & Kneib, J.-P. 2006, A&A, 456, 861 Salpeter, E. E. 1955, ApJ, 121, 161 Smail, I., et al. 2007, ApJ, 654, L33 Spergel, D. N., et al. 2007, ApJS, 170, 377 Stanway, E. R., McMahon, R. G., & Bunker, A. J. 2005, MNRAS, 359, 1184 Stark, D. P., Ellis, R. S., Richard, J., Kneib, J.-P., Smith, G. P., & Santos, M. R. 2007, ApJ, 663, 10 Steidel, C. C., Adelberger, K. L., Giavalisco, M., Dickinson, M., & Pettini, M. 1999, ApJ, 519, 1 Stern, D., Yost, S. A., Eckart, M. E., Harrison, F. A., Helfand, D. J., Djorgovski, S. G., Malhotra, S., & Rhoads, J. E. 2005, ApJ, 619, 12 Yan, H., et al. 2005, ApJ, 634, 109 Yan, H., & Windhorst, R. A. 2004, ApJ, 600, L1 Zekser, K. C., et al. 2006, ApJ, 640, 639.
(9)
Figure


+3

Documento similar
