USING GIS MODELLING TO ASSESS ACCESSIBILITY
IMPROVEMENTS AND ITS POTENTIAL INDIRECT EFFECTS
ON THE ENVIRONMENT DUE TO TRANSPORT
INFRASTRUCTURE PLANS DEVELOPMENT
Ortega, E.
1Mancebo, S.
1Sánchez, A.
1López, E.
11
Transport Research Centre (TRANSyT) of Polytechnic University of Madrid. (www.transyt.upm.es)
ABSTRACT
The Strategic Environmental Assessment Directive (2001/42/EU) establishes that the Environmental Report must include the identification and evaluation of the likely significant effects on the environment of implementing the Plan or Programme due to be studied. Transport Plans usually generate accessibility improvements or facilitate access between two given points on the territory. One indirect impact that this action implies is a likely pressure increase in those areas where a great improvement in their accessibility is gained, mainly through high speed motorways. This new pressure comes from the sudden and sometimes messy attraction of potential activities that could vary from industrial, agriculture or services sectors, an increase of tourism or recreational activities..., and the appearance or intensification of residential demand, including secondary or recreational houses.
The Transport Research Centre of the polytechnic University of Madrid (TRANSyT) has coordinated a research project, financed by the Ministry of Public Works, which its main objective has led to obtain, develop and analyse interdisciplinary information to assist on a better infrastructure planning process. In the framework of this project, a methodology has been proposed to assess potential indirect impacts on the environment caused by transport infrastructure developing in previously semi-isolated areas. The process involves the computation of accessibility indices based on travel time estimations on road and railway networks in conjunction with its combination with Natural Quality cartography, also developed through an ad-hoc methodology.
PAPER
OBJECTIVES
The objective is to know the indirect impact provoked by an increase of the accessibility in the Spanish peninsular territory on the environment. The increase in the accessibility is obtained through the improvement of the existing infrastructures of transport and through the construction of new other ones in those areas less endowed with them. It is intended to develop a methodology that allows the evaluation of this impact using the tools provided by a G.I.S.
METHODOLOGY Accessibility model
The calculation of the improvement in the accessibility in the period 1992-2004 has been developed by a team directed
Gutiérrez Puebla, J. as part of the mentioned project of investigation.
The developed methodology has been applied for the period 1992-2004, and the different results that are exposed in this paper correspond to this period. At present the methodology is being applied by TRANSyT for the 2004-2020 period, within the framework of a project financed by the Ministry of Science and Technology, and therefore further modifications of the initial methodology would be also explained as consequence of the continuity of the study.
Theoretical basis
The accessibility has measured up in terms of efficiency of the net in the connections of every node to the different centres of activity. To neutralize the effect of the geographical location of the nodes, and to highlight the effect of the infrastructure, the usual notion of distance (length, time, cost) is replaced by one that expresses the facility of access in relative terms. The indicator of efficiency of the net relates to the real times of access in contrast with the ideal ones (maximum speed allowed and a straight-line route) to obtain this effect (Gutiérrez Puebla, Monzón and Piñero, 1992; MOPTMA, 1993) applying the following form:
w ) w * III ( = A
ij n
j=1 ij ij ij n
j=1 i
(1)
Where
· Ai; it indicates the efficiency of the net in the connections of the node i with regard to the considered centres of activity.
· Iij = impedance; real time of displacement taking the shortest path (minutes).
· IIij; it is the ideal time of trip between the node of origin and the destination centre of economic activity: the time that
would be obtained in straight line across a hypothetical highway or line of high speed.
· wij; it is the weighing for this relation between i and j (in this case the quotient between the population in destiny and
the time of trip between i and j).
Methodology
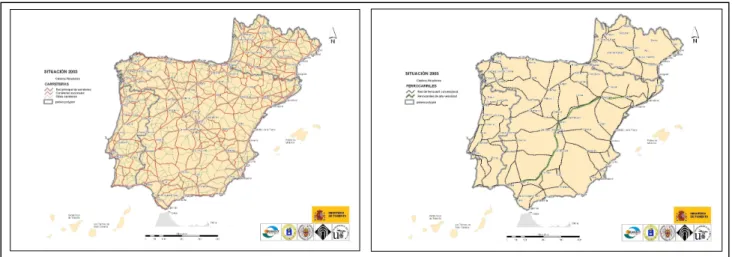
In a Geographical Information System (ARC/INFO), which combines cartographic and alphanumeric information, both motorway and railroad network have been represented, covering the whole territory of the peninsular Spain. Both are updated to 31 in December, 2003.
The used format has been ArcInfo's coverage, because it allows an analysis of networks built by arcs and nodes. Information relating to distance and speed of trip is incorporated in the arcs, while nodes retain information related to population of the locality and penalties of time owed to transfers caused by the effect of the infrastructure or due to changes of rail track widening.
Figure 1: Motorway and Railway Networks
Due to the recently approved Strategic Plan of Infrastructures and Transport (PEIT) in Spain, it has been necessary to update and extend current networks with the actions and new infrastructure development foreseen on the mentioned Plan in order to extent the study and analyse accessibility improvements due to take place before 2020. The procedure has been the following:
1. Foreseen networks for 2020 (according to the PEIT) have been georreferencing, consisting in a flat transformation based on a sufficient sample of control points. The mistake estimated in the process across the statistician RMS (root mean square) was 504, 989 and 1.050 m for the maps of Spain, Portugal and France. This supposes a precision loss, assuming error binormality according to Central Theorem of the Limit, of 1.788 m. This loss of precision only affect on the new sections, not to the already existing ones (that suffer only a thematic, not spatial update); therefore, bearing in mind the limited level of detail on the definition of the new projects (at this decision level, one can not expect a good definition of proposals, which should be improved at project level), this loss of precision is acceptable. The estimated final precision (assuming independence and binormality of the mistakes) is close to 2.000 m at 95 %, which match to a final scale of 1:2.000.000 according to the current European standards.
2. To edit the networks wherever it is necessary with help of the available edition tools in ArcTools/ArcEdit, which allows arcs and nodes modification.
Once all the information have been incorporated to the network arcs and nodes, the accessibility calculation for all the cities (nodes) that have been considered as centres of economic activity is proceeded. Thus, the order INTERACTION of ArcPlot has been used, which computes the spatial interactions between origin and destination pairs defined on point or polygon features or between a set of nodes and centers, obtainining a new table.
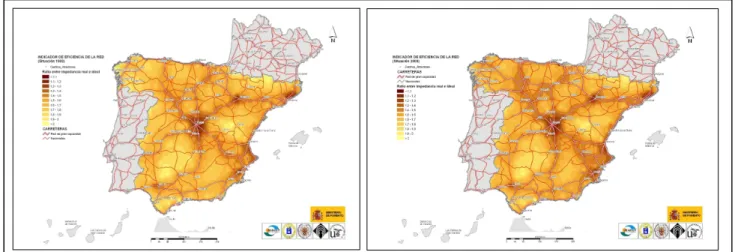
Figure 2: Accessibility. Motorway Network, 1992 and 2004
Figure 3: Accessibility. Rail Network, 1992 and 2004
ArcInfo has a command that provides a measure of the accessibility. The command is named Accessibility, which uses the following expression:
ni ij
j
i
d
W
P
1 (2)
where
• Pi; accessibility at point i.
• Wi; attractiveness of location j.
• dij; distance between location i and j.
•â; exponent for distance decay.
EVALUATION OF THE INDIRECT POTENTIAL IMPACT Environmental Quality Model
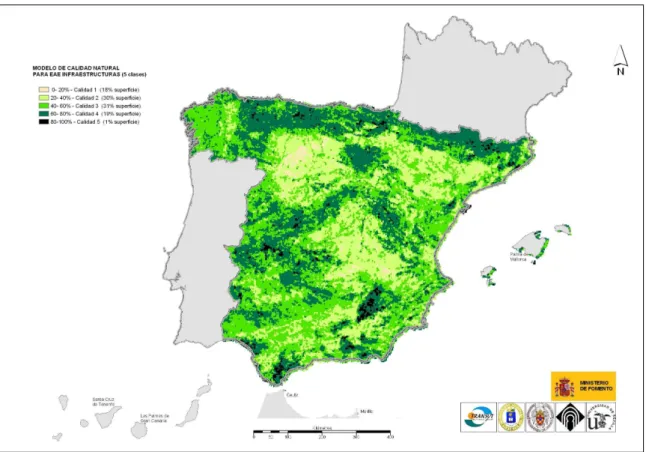
The indirect potential impact (López, E. Sánchez, A. (2004) Conflicto entre accesibilidad y preservación del medio: el caso de Pirineos, II Congreso Internacional de Ingeniería Civil y Medio Ambiente. Santiago de Compostela)caused by an accessibility increase has been measured by integrating the map of Natural Quality (Mancebo, S. García-Montero, Luis G. and others), developed in a previous stage of the project, and the accessibility maps (index of efficiency).
The Natural Quality map integrates the most relevant aspects of the environment, as it has been obtained by the combination of 12 environmental variables, which were valued objectively and independently according to the available information and inherent main characteristics, either using GIS models or through expert panels.
Considered variables in Natural Quality Map
Landuse Corine Land Cover Naturalness Habitat Naturalness
Landscape Quality SoilsQuality
Vegetation cover Valuation
Forest cover (30 % and > 5 m) Valuation Habitat MapterritorialunitSingularity
Landuse Corine Land Cover territorialunitSingularity Landscape Map Singularity
Soil Map Singularity Forest fragmentation Habitat fragmentation
Figure 4: Considered variables in Natural Quality Map
Accessibility Model Normalization
The process adopted in the present study has been the following:
• The starting point is the accessibility to the network nodes, considering roads and railways separately, in 1992, 2004
and their difference.
• Their projection is transformed from the original one (UTM spindle 30 N datum ED-50) to match the Natural Quality
map (LAEA European definition ETRS-89 datum)
Integration of Natural Quality and Accessibility maps
The combination of the accessibility map for 1992 and 2004 with the Natural Quality map inform us about the territory potentially affected by activities derived from the increased easiness of access. The methodology used for the evaluation has consisted in computing the accessibility difference between both scenarios, and combining the result with the environmental quality.
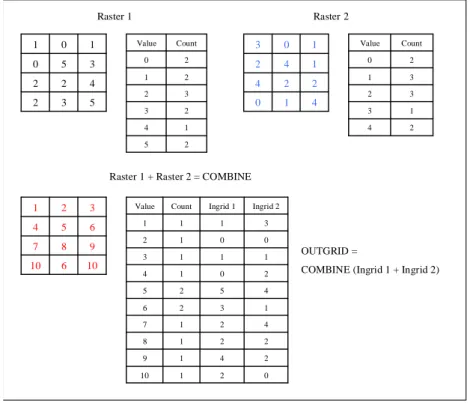
The maps are then integrated using the GIS command COMBINES, which combines multiple grids on to cell-by-cell basis within the analysis window, such that to unique output value is assigned to each unique combination of input values. Therefore, a new map is generated through the combination of all possible values or classes from both maps, and total surface for each combination is calculated.
5 3 2 4 2 2 3 5 0 1 0 1 2 5 1 4 2 3 3 2 2 1 2 0 Count Value 10 6 10 9 8 7 6 5 4 3 2 1 2 4 1 3 3 2 3 1 2 0 Count Value 4 1 0 2 2 4 1 4 2 1 0 3
Raster 1 Raster 2
0 2 1 10 2 4 1 9 2 2 1 8 4 2 1 7 1 3 2 6 4 5 2 5 2 0 1 4 1 1 1 3 0 0 1 2 3 1 1 1 Ingrid 2 Ingrid 1 Count Value
Raster 1 + Raster 2 = COMBINE
OUTGRID =
COMBINE (Ingrid 1 + Ingrid 2)
Figure 5: ArcInfo COMBINE command operation
Figure 6: Natural Quality Map and differences in Accessibility between scenarios 1992 and 2004 due to road network improvements.
The GIS command SUMARIZE provides a summary of the surfaces of all the combinations obtained through maps integration, which is useful for its later mathematical and graphic treatment.
By summarizing the data in a table, various summary statistics can be derived—including the count, average, minimum, and maximum value—and get exactly the pursued information. ArcMap creates a new table containing the summary statistics.
RESULTS
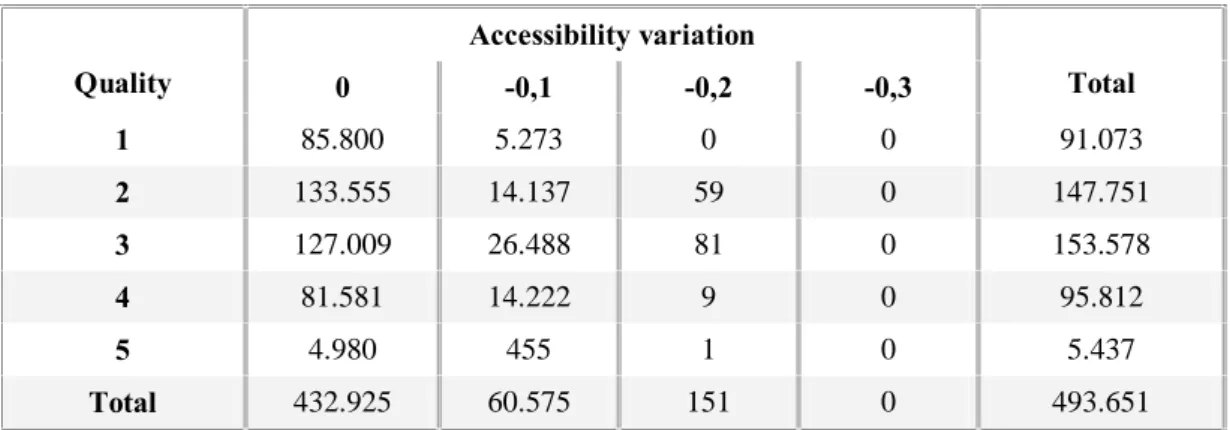
Analyzing the report of surfaces, the following table (surfaces in km2) is obtained:
Accessibility variation
Quality 0 -0,1 -0,2 -0,3 Total
1 85.800 5.273 0 0 91.073
2 133.555 14.137 59 0 147.751
3 127.009 26.488 81 0 153.578
4 81.581 14.222 9 0 95.812
5 4.980 455 1 0 5.437
Total 432.925 60.575 151 0 493.651
And, calculating surface distribution by percentages with regard to the total for each of the Natural Quality classes:
Accessibility variation
Quality 0 -0,1 -0,2 -0,3 Total
1 94% 6% 0% 0% 18%
2 90% 10% 0% 0% 30%
3 83% 17% 0% 0% 31%
4 85% 15% 0% 0% 19%
5 92% 8% 0% 0% 1%
Total 88% 12% 0% 0% 100%
Figure 8: Percentage of affected surface by Natural Quality class and accessibility variation.
The methodology that has been followed in order to analyse differences shows clearly the affected surfaces but, on the other hand, it does not allow the generation of indicators that could also be of great utility. Thus, accessibility maps for 1992 and 2004 shall be “combined” separately with the Natural Quality, in order to get potentially affected territory.
PROPOSED METHODOLOGICAL SCHEME
1. GIS digitalization and edition of the element causing the effect due to induced an indirect impact (Digitalization, Edition,…). (for instance, Transport Networks)
2. Calculation of the variable causing the indirect effect (Modelling, Interpolation,…). (p.e. Improvement of accessibility)
3. Identification of the element that suffers the impact. (p.e. Natural Quality) 4. Integration of both models (Combine in raster, Union in vectorial,…)
5. Data gathering for further analysis (Sumarize,….)
DISCUSSION OF THE ANALYSIS
The evaluation of indirect potential impacts on the environment due to a new Plan or Program is undoubtedly ambitious and indeed very complex. The developed methodology that has been applied in this epigraph must be considered as a first approach, although it has been intended to develop simple but objective and well suited evaluation.
GIS is a great tool to develop models to evaluate territorial variables. We can create maps using its tools, interpolating, digitalizing,…and raster format allows combine numerous variables easily.
ACKNOWLEDGEMENTS
Gutiérrez Puebla, J. y Gómez G. Authors of Accessibility Maps.
Mancebo, S.; García-Montero, L. G.; Otero, I.; Casermeiro, M. A.; Espluga, A. P. y Navarra, M., Authors of Natural Quality Map.
REFERENCES
Dirección General de Conservación de la Naturaleza (DGCNA) (2004). Habitat Map
Dirección General de Conservación de la Naturaleza (DGCNA) (2004) MFE50III Mapa Forestal Español
ESRI (2004) Arcdoc - Arc/Info
ESRI (2004). Motorway and Railway Networks
Food and Agriculture Organization of the United Nations, Joint Research Centre (2000) Soil Type Map
López, E. Sánchez, A. (2004) Conflicto entre accesibilidad y preservación del medio: el caso de Pirineos, II Congreso
Internacional de Ingeniería Civil y Medio Ambiente. Santiago de Compostela, 22-24 de septiembre de 2004.
Mancebo, S.; García-Montero, L. G.; Otero, I.; Casermeiro, M. A.; Espluga, A. P.; Navarra, M. (2005) Modelo de Cartografía de la calidad natural de España 1:500.000. III Congreso Nacional de Evaluación de Impacto Ambiental
Ministerio de Fomento (2004). Plan Estratégico de Infraestructuras y Transporte (PEIT), Documento propuesta. Secretaría de Estado de Infraestructuras y Planificación.
Universidad Politécnica de Madrid, Universidad de Castilla-La Mancha, Universidad Complutense de Madrid, Universidad de Sevilla (2005) Evaluación de Impactos Territoriales de Infraestructuras de Transporte. Aplicación:
Análisis de la Situación de la Red Española de Transportes A 31.Xii.2003. Ministerio de Fomento
Universidad Autónoma de Madrid (2004) Atlas de los Paisajes de España. Ministerio de Medio Ambiente
Ministerio de Obras Públicas y Transporte. (1993). Plan Director de Infraestructuras 1993-2007.
BIOGRAPHY