Simulation and
fl
avor compound analysis of dealcoholized beer via
one-step vacuum distillation
Cristina Andrés-Iglesias
a, Juan García-Serna
b, Olimpio Montero
c, Carlos A. Blanco
a,⁎
aDepartamento de Ingeniería Agrícola y Forestal (Área de Tecnología de los Alimentos), ETS Ingenierías Agrarias (Universidad de Valladolid), Avda. de Madrid 44, 34004 Palencia, Spain bHigh Pressure Processes Group, Department of Chemical Engineering and Environmental Tech., University of Valladolid, 47011 Valladolid, Spain
c
Centre for Biotechnology Development (CDB), CSIC. Boecillo Technological Park, Av. Francisco Vallés 8, 47151 Boecillo, Valladolid, Spain
a b s t r a c t
a r t i c l e i n f o
Article history: Received 27 May 2015
Received in revised form 9 July 2015 Accepted 12 July 2015
Available online xxxx
Keywords: Alcohol-free beer Aspen HYSYS simulation Dealcoholization Volatile compounds Flavor perception HS-SPME
The coupled operation of vacuum distillation process to produce alcohol free beer at laboratory scale and Aspen HYSYS simulation software was studied to define the chemical changes during the dealcoholization process in the aroma profiles of 2 differentlagerbeers.
At the lab-scale process, 2 different parameters were chosen to dealcoholize beer samples, 102 mbar at 50 °C and 200 mbar at 67 °C. Samples taken at different steps of the process were analyzed by HS-SPME–GC–MS focusing on the concentration of 7flavor compounds, 5 alcohols and 2 esters. For simulation process, the EoS parameters of the Wilson-2 property package were adjusted to the experimental data and one more pressure was tested (60 mbar).
Simulation methods represent a viable alternative to predict results of the volatile compound composition of a
final dealcoholized beer.
© 2015 Published by Elsevier Ltd.
1. Introduction
The market of non-alcoholic brews has experienced a significant improvement during the past years that becomes motivated mainly by highly competitive markets, driving/drinking rules, health conditions incompatible with alcohol consumption and/or religious reasons (Andrés-Iglesias, Montero, Sancho, & Blanco, 2014; Blanco, Andrés-Iglesias, & Montero, 2014; Catarino & Mendes, 2011). Similarly, it is well-known that beer has positive effects and a whole range of properties, such as no fat or cholesterol content, free sugar content, high antioxidant, magnesium and solublefiber content (Brányik et al., 2012), plus it provides essential vitamins and minerals contributing to a healthy balanced diet (Andrés-Iglesias, Blanco, Blanco, & Montero, 2014; Bamforth, 2001).
Beer aroma profile is made by many volatile organic compounds at very low concentration (ppm level), which are responsible for its uniqueflavor (Catarino, Mendes, Madeira, & Ferreira, 2007). Levels of different chemical compounds, such as alcohols, esters, aldehydes, ketones, organic acids and phenols, can be found on beer composition, giving a specificflavor that contributes to the overall organoleptic prop-erties of thefinal beer (Karlsson & Trägårdh, 1997). Among them, esters and alcohols are the main groups of aroma compounds. Esters are
responsible for the sweet and fruityflavors of beer, while alcohols confer it an alcoholic, fruity and immatureflavor (Andrés-Iglesias, Blanco et al., 2014; Andrés-Iglesias, Montero et al., 2014; Catarino, Ferreira, & Mendes, 2009).
In low-alcohol and/or alcohol-free beer production, the different techniques used have to be able to reach the maximum alcohol by volume (ABV) established by the different countries legal regulations. In the majority of EU countries beers with low alcohol content are divid-ed into alcohol-free beers (≤0.5% ABV) and low-alcohol beers (≤1.2% ABV). In Spain, alcohol free beers are divided in non-alcohol beers (≤1.0% ABV) and‘0.0%’beers (≤0.1% ABV). However, in the United States there should not be alcohol present in alcohol-free beers, while 0.5% ABV corresponds to the upper limit of non-alcoholic beers or ‘near-beers’(Olmo, Blanco, Palacio, Prádanos, & Hernández, 2014).
At present, there are several methods for low alcohol beer produc-tion (Blanco et al., 2014). The strategies can be divided into two main groups: biological and physical methods (Brányik et al., 2012; Montanari, Marconi, Mayer, & Fantozzi, 2009; Olmo et al., 2014). While physical methods withdraw the ethanol from a fermented beer, biological methods aim at controlling the alcohol production during the fermentation process (Zürcher, Jakob, & Back, 2005).
Biological methods can be achieved by either restricting ethanol formation or shortening the fermentation process. Obtaining low alco-hol content via interrupted fermentation is accompanied by low con-tents of aroma andflavor compounds, and their products are often Food Research International xxx (2015) xxx–xxx
⁎ Corresponding author.
E-mail address:[email protected](C.A. Blanco).
http://dx.doi.org/10.1016/j.foodres.2015.07.017 0963-9969/© 2015 Published by Elsevier Ltd.
Contents lists available atScienceDirect
Food Research International
characterized by worty off-flavors. They are usually performed using traditional brewery equipment and hence do not require additional investments (Brányik et al., 2012; Catarino & Mendes, 2011).
Other processes to avoid these limitations include the use of special or immobilized yeasts as well as the use of low sugar raw materials (Catarino & Mendes, 2011; Pickering, 2000). The use of special yeasts for a low alcohol beer production process increases the costs with the need of yeast selection, or genetic modification of the production organ-isms. However, suitable selected yeasts can contribute significantly to the product sensorial quality improvement. Alcohol free beer produc-tion processes by continuous fermentaproduc-tion with immobilized yeast, whose objective is limited alcohol formation, and which requires special equipment and material. In this latter case, high investment costs are re-quired but are justified by a higher productivity of the continuous pro-cesses. In general, producing alcohol-free beer by biological methods makes impossible the production of alcohol-free beers with alcohol con-tent close to zero (Brányik et al., 2012).
Physical methods require considerable investments into the special equipment for alcohol removal (Brányik et al., 2012). The most common separation processes used for beer dealcoholization are membrane-based processes and heat treatment (Catarino et al., 2007). Membrane-based processes include reverse osmosis, nanofiltration, di-alysis and pervaporation (Labanda, Vichi, Llorens, & López-Tamames, 2009). Heat treatment processes comprise evaporation and distillation; they are both under vacuum conditions to preserve the organoleptic properties by avoiding undesired secondary reactions ( Belisario-Sánchez, Taboada-Rodriguez, Marin-Iniesta, & López-Gómez, 2009). Furthermore, thermal processes to remove alcohol from regular beers can cause the loss of the original aroma (Blanco et al., 2014; Catarino et al., 2009) but their advantage is that they can remove ethanol from beers to levels close to zero (Brányik et al., 2012).
Among these physical methods, for large scale dealcoholization, the vacuum evaporation is the most economic process (Zürcher et al., 2005). Distillation is a separation operation based on differences in vol-atility. If a mixture containing substances that differ in their volatility is brought to ebullition, the composition of the vapors released will be dif-ferent from that of the boiling liquid. After condensation, the vapors constitute the“distillate”. The remaining liquid is called“residue” (Berk, 2013). The application of vacuum to distillation process enables to reduce the evaporation temperature and thus the thermal stress to beer (Zürcher et al., 2005). If the pressure is reduced, alcohol can be drawn off at much lower temperature (Brányik et al., 2012). Thermal processes to produce alcohol free beers are performed at temperatures between 30 and 60 °C at pressures of 60 to 200 mbar (Sohrabvandi, Mousavi, Razavi, Mortazavian, & Rezaei, 2010; Zürcher et al., 2005). The deterioration of beer quality by thermal dealcoholization depends mainly on the evaporation temperature and the period of exposure (Brányik et al., 2012).
It is well known that most of the aroma compounds are lost in alcohol free beers during production by thermal processes. The aroma profile is clearly damaged and other, less pleasantflavors, like bready, worty or caramel notes can appear (Blanco et al., 2014; Catarino et al., 2009; Lehnert et al., 2009; Sohrabvandi et al., 2010). To compensate these disadvantages many breweries use a modified brewing technolo-gy for the production of a more aromatic original beer. Another attempt to compensate sensory disadvantages is by blending dealcoholized beer with a small quantity of original beer or a beer aroma extract that can be recovered in evaporation plants with rectification columns. Since these attempts are not yet satisfactory further possibilities to improve the quality of these beers have been investigated (Zürcher et al., 2005).
Owing to beer chemical compound characterization has improved notably nowadays, analysis of beer flavor compounds has been constantly optimized to obtain better results in relation to sensitivity and specificity (Andrés-Iglesias, Blanco et al., 2014; Andrés-Iglesias, Montero et al., 2014). Gas chromatography–mass spectrometry (GC–MS) is currently used to measure volatile compound concentrations
in beer. Ethers, esters, acids, aldehydes, ketones, alcohols, sulfur com-pounds, hydrocarbon comcom-pounds, alicyclic comcom-pounds, heterocyclic compounds and aromatic compounds can be measured simultaneously by using GC–MS methods (Andrés-Iglesias, Blanco et al., 2014; Andrés-Iglesias, Montero et al., 2014). The combination of solid phase microextraction (SPME) with gas chromatography (GC) or gas chromatography–mass spectrometry (GC–MS) has proven to be a sensi-tive and precise method for the analysis of different classes of volatile compounds (Dong et al., 2013).
Beer dealcoholization via vacuum distillation in a batch system can be assumed to resemble differential distillation at reduced pressure. The principles of differential distillation are well established since the beginning of chemical engineering knowledge. Thus, this type of distil-lation is often known as“Rayleigh distillation”. Lord Rayleigh's law is based on a dynamic material balance to the volatile compound of a two component mixture coupled to the global mass balance (Berk, 2013). Extending the balance to a multicomponent mixture was studied in deep by several authors such asLang et al. (1994)and,Yatim et al. (1993)who modified the process for the addition of an extractive agent, or including sieves. An interesting comparative study was conducted byZürcher et al. (2005)using lab scale batch and continuous distillation as well as an industrial scale plant. They investigated the beer dealcoholization at 60 and 150 mbar by following changes in a number of compounds, e.g., ethanol, 1-propanol, ethyl acetate, 2-methylpropanol, 3-methylpropanol and several esters. However, they did not simulate the process.
In addition, several authors have investigated the simulation of spirits production by this process. Claus and Berglund studied fruit brandy distillation using a batch column distillation. They simulated the process using CHEMCAD with good results using NRTL (Non-Random Two Liquids) equation of state (EoS) together with UNIFAC parameters (Claus & Berglund, 2005, 2009). On the other hand, Gaiser et al. simulated the whisky still distillation process using Aspen Plus software and selecting the NRTL-2 property pack-age of that software; they claimed that this EoS provides a good ap-proximation for ethanol–water azeotrope (Gaiser et al., 2002).
Low alcohol and alcohol free beer consumption is increasing year by year, and often, these types of beverages are known to have a poorfl a-vor profile in comparison to the original beer. In this sense, it becomes important to adjust theflavor of non-alcoholic beers to that of regular ones, which needs understanding of how the dealcoholization process modifies it, an issue of which the scientific info is scarce.
In this work, we have combined lab scale differential vacuum distil-lation, aroma compound analysis and simulation of the dealcoholization process to shed light on this process. The main objective is to test a simulation environment that can explain the lab results, so that, it can be extrapolated to a similar process at industrial scale. For this, we have selected two model beers, one from Spain and one from Germany, and adjusted the interaction parameters of a thermodynamic model. To our knowledge, this is thefirst time that it is done for beers.
2. Material and methods
2.1. Samples and vacuum distillation dealcoholization experiments
The experiments of beer dealcoholization by laboratory scale vacu-um distillation were done at two different vacuvacu-um pressures and water bath temperatures. The temperature needed in the water bath is directly related to the total pressure by the phase equilibrium of the system, but has to be set to a slightly higher value to assure enough heat transfer. Thus, thefirst set of experiments was conducted at 102 mbar and 50 °C (corresponding to a saturation temperature of pure water, 46.2 °C) and the second set at 200 mbar and 67 °C (corre-sponding to a saturation temperature of pure water, 60.1 °C), A Rotavapor R-215 with vacuum pump V-700, vacuum controller V-850 and diagonal condenser (BÜCHI Labortechnik AG, Switzerland) was used. Theflask rotation wasfixed at 20 rpm and remained constant in all experiments. Each dealcoholization process was stopped at 15, 30, 45 and 60 min after the onset for sampling in order to analyze the different volatile compounds evaporated along with the ethanol. At the end of the distillation process, the residual beer was cooled in glass bottles and weighted for the material balance calculation.
For all experiments the same steps were done. At the beginning of each experiment the water batch was refilled until the same volume if necessary, once the batch reached the temperature, the experiment started at the rpm indicated above, the pressure was reached immedi-ately and remained constant (± 1) over the whole experiment and controlled by the vacuum controller.
For the GC–MS analysis 15 mL dark vials sealed with PTFE–silicone septa (Supelco, USA) were used for sample preparation. Vials contained 2 g of NaCl (Scharlau, Scharlab S.L., Spain) and 5 mL of beer were added and stirred to solve the NaCl and homogenize the sample. A total of 60 samples were taken and analyzed from the original beers, and from re-sidual beers at each time and dealcoholization process experiments.
2.2. Gas chromatography–mass spectrometry (GC–MS) equipment
Volatile compounds were separated and detected by gas chromatog-raphy using an Agilent GC 6890N (Agilent Technologies, USA) equipped with an Agilent 5973 single quadrupole mass spectrometer (, Agilent Technologies, USA) as detector. A headspace solid phase microextraction (HS-SPME) manual equipment (Supelco, USA) was used for the extraction and concentration of the volatile compounds, which was carried out with 100μm polydimethylsiloxan (PDMS)fiber (Sulpeco, USA). Prior to use, the SPMEfiber was conditioned at 250 °C for 30 min in the GC injector, according to the manufacturer's instructions. Blank runs of thefiber were completed, before sampling, each day to ensure no carry-over of analytes. The chromatographic separations were accomplished using a BP-1 30 m × 0.32 mm × 1μm capillary column (SGE Analytical Science, Australia).
2.3. Analysis of volatile compounds
The volatile composition of beer samples was measured by triplicate. Solid phase microextraction of compounds was performed at 30 °C for 45 min. The desorption was achieved in the injector of the GC chromatograph in splitless mode for 15 min, and the temperature was set at 250 °C as indicated by the manufacturer for PDMSfiber. Carrier gas was helium at a constantflow of 1.2 mL/min.
The oven temperature was programmed as follows: initial tempera-ture was set at 35 °C and kept for 7 min, this was followed by 2 ramps in which temperature was risen at 8 °C/min to 200 °C and kept this temperature for 5 min, and then temperature was risen at 10 °C/min to 250 °C, this temperature being kept for 10 min.
The ionization energy was 70 eV, and detection and data acquisition were performed in scan mode from 37 to 350 Da. For identification data obtained in the GC–MS analysis were compared with m/z values compiled in the spectrum library WILEY. Validation of com-pound identification was carried out by comparison of MS spectra and retention times with those of commercial standards. Quantification was carried out by using standard calibration curves of 2-methylbutanol
(≥99.0%), 3-methylbutanol (≥99.0%), 2-phenylethanol (≥99.0%), ethyl acetate (≥99.5%), isobutanol (≥99.0%) (these from Sigma, USA). 1-Propanol≥99.5% (Fluka, Sigma-Aldrich, USA) and isoamyl acetate≥99.0% (Fisher, UK). Because 1-propanol co-eluted with ethanol, the extracted ion chromatogram (EIC) for the ion with m/z 60.05 and retention time of 3.10 min was used for quantification of this compound.
2.4. HYSYS simulation and parameters
In order to simulate the system under study for the batch distillation of beer the following assumptions were considered:
1) The vacuum is done almost instantly and at t = 0 the system is at the constant desired vacuum pressure.
2) Liquid composition is homogeneous and heat is uniformly distributed. 3) Theflask has been simulated by a cylinder to simplify level calculation. 4) The heatflux for each data point is determined to match the time re-quired for a certain vaporization volume. This is because the Rotavapor system can provide different heatflux depending on a number of variables (water level,flask location, ambient temperature, rotation speed, etc.).
5) No reaction occurs in the bulk liquid.
The simulations have been carried out using HYSYS simulation software (Aspen inc. product) as it has a powerful non-steady state sim-ulation tool.
Wilson-2 property package was chosen in order to simulate the non-ideal behavior of the liquid phase, while non-ideal gas is considered for the gas phase (as it was under reduced pressure conditions).
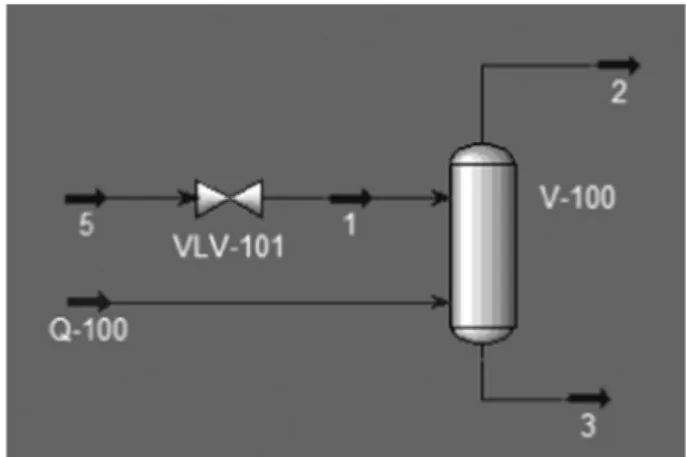
The main simulation processflow diagram is depicted inFig. 1. The main distillation vessel (V-100) has one feed stream-5 (virtual for sim-ulation purposes set at almost zeroflow), one heat source (Q-100), one liquid outlet stream-2 (virtual for simulation purposes set at almost zeroflow) and one vapor outlet stream-3 (main distillation outlet).
The main calculations were carried out using an Excel spreadsheet to determine the conversion between ppm and molar fraction values from experimental conditions to the simulation and vice versa.
The main components simulated were: sucrose, ethanol, ethyl acetate, 1-propanol, isobutanol, isoamyl acetate, 2-methylbutanol, 3-methylbutanol, 2-phenylethanol, water and nitrogen.
Sucrose was used as a simulation trick to increment the density of water targeting the real value of 1010 kg/m3, for that purpose a concentra-tion of 3% wt. was used in all simulaconcentra-tion experiments. Nitrogen was used for simulation purposes mimicking the atmosphere of the Rotavapor.
Initial values for compositions of the liquid were inserted in the “hold-up” values of the distillation vessel. The total pressure of stream-2 wasfixed to the experimental absolute pressure, coinciding with the vessel initial pressure (i.e., 102 and 200 mbar).
As indicated in the assumptions, the heatflux was estimated to match the mass evaporated at each time sample point. This way, the simulation time is not as important as the evaporated mass, that is used as the x-axis variable as percentage of mass evaporated (%vapor). Thus, all experiments were carried out until 15, 30, 45 and 60 min, time when the dealcoholization process was stopped and the samples were collected. The % of vapor fraction (% Vf) was calculated as the percentage of initial mass of the beer minus the mass at the differ-ent points of the simulation until the last mass (at 60 min of simulation) divided by the initial mass. Although the traditional ASTM D-86 curves for petroleum distillation are carried out in volume, in this case, mass was preferred to overcome density variations (ASTM-International, 2012). Furthermore, the heatflux could have varied along with the
experiment. For this reason, we have considered this variable more ac-curate than experimental time itself. In addition to this, results could be transferred to a real vacuum distillation process with better scale-up chances.
The developed software is available free in the web page of the re-search group of High Pressure Processes of the University of Valladolid (http://hpp.uva.es/software/) in the section for‘Beer Distillation’.
3. Results and discussion
Twolagerbeers were investigated in this study, one sample from Spain (S) and the other sample from Germany (G). Both samples were dealcoholized by vacuum distillation at laboratory scale at 2 different
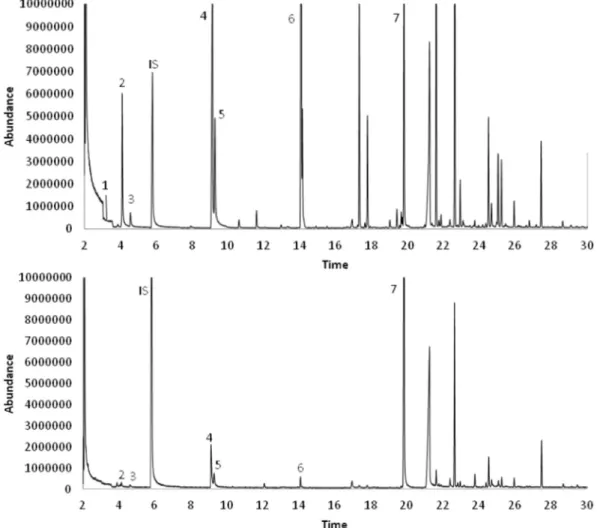
Fig. 2.Sample of TIC chromatogram for S beer sample, alcohol beer on the top and beer dealcoholized by laboratory vacuum distillation on the bottom. (1) 1-propanol, (2) ethyl acetate,
(3) isobutanol, (4) 3-methylbutanol, (5) 2-methylbutanol, (6) isopentyl acetate, (7) 2-phenylethanol.
pressures and temperatures, 102 mbar, 50 °C and 200 mbar, 67 °C. A total of 45 compounds were identified, and 7 of them quantified by peak area. The profile of quantified volatiles consisted of 5 alcohols (1-propanol, 2-methyl(1-propanol, 2-methylbutanol, 3-methylbutanol and 2-phenylethanol) and 2 esters (ethyl acetate and isoamyl acetate). These compounds are considered as ones of the main alcohols and es-ters in beer (Blanco et al., 2014; Lehnert et al., 2009; Rodrigues, Caldeira, & Câmara, 2008; Willaert & Nedovic, 2006), the most abundant being ethyl acetate, isoamyl acetate, the amyl alcohols and isobutanol (Piddocke, Kreisz, Heldt-Hansen, Fog Nielsen, & Olsson, 2009). Also, these compounds are those currently analyzed by other authors be-cause they are relevant flavor compounds in beer (Charry-Parra, DeJesús-Echevarria, & Perez, 2011; Kobayashi, Shimizu, & Shioya, 2008) and chosen as reference compounds when studying industrial processes for production of non-alcoholic beers (Catarino & Mendes, 2011; Mota et al., 2011).
A typical total ion chromatogram (TIC) of a regular beer sample and its dealcoholized beer by laboratory scale vacuum distillation process is shown inFig. 2.
3.1. Final ethanol content calculated by ASPEN HYSYS simulation
During the differential distillation process, the most volatile fraction (ethanolic fraction) abandons the system infirst place together with an increasing amount of water. In this work, we have focused on the anal-ysis of the beer, rather than the evaporated volatile fraction (ethanolic fraction).
Table 1
Percentage of the vapor fractions (% Vf) of S and G samples and its correspondent times, for both lab-scale vacuum distillation processes and the averages (%).
Time, min 0 15 30 45 60
S 102 mbar 0 7.46 9.55 13.40 15.76
S 200 mbar 0 6.17 10.14 15.12 19.22
G 102 mbar 0 5.70 9.00 14.40 17.60
G 200 mbar 0 10.80 13.40 14.80 18.90
Average (% Vf) 0 7.53 10.52 14.43 17.87
Fig. 4.Ethanol concentration if thefinal volume is diluted or non-diluted at the two
experimental pressures.
Table 2
Retention time (Rt), concentration of volatile compounds (mg/L) delacoholized at 102 mbar, 50 °C and 200 mbar, 67 °C in the experiment (EXP), in simulations (SIM) and the standard deviation of the experimental value (St Dev).
SIM EXP St Dev SIM EXP St Dev SIM EXP St Dev SIM EXP St Dev SIM EXP St Dev
102 mbar, 50 °C Rt S, 0 min S, 15 min S, 30 min S, 45 min S, 60 min
1-Propanol 3.10 5.56 5.56 2.47 1.22 2.09 0.36 0.50 0.25 0.12 0.05 0.24 0.00 0.01 0.00 0.00
Ethyl acetate 4.13 17.82 17.82 1.11 1.52 1.07 0.10 0.67 1.23 0.41 0.15 0.86 0.30 0.07 0.54 0.09
Isobutanol 4.60 9.41 9.41 2.52 5.67 4.97 2.03 4.38 4.68 2.73 2.35 3.67 2.56 1.63 3.26 2.10
3-Methylbutanol 9.11 40.99 40.99 2.73 25.01 17.44 1.45 19.37 17.15 7.14 10.43 11.51 1.54 7.24 7.33 1.05 2-Methylbutanol 9.27 13.37 13.37 0.94 7.78 5.26 0.54 5.83 5.29 2.14 2.91 3.55 0.63 1.91 1.93 0.27 Isopentyl acetate 14.09 1.92 1.92 0.33 0.36 0.11 0.08 0.15 0.10 0.09 0.02 0.09 0.08 0.00 0.09 0.08 2-Phenyl ethanol 19.82 34.01 34.01 1.39 37.07 40.46 6.26 37.95 48.76 17.74 39.51 62.04 9.92 40.16 85.28 3.90
102 mbar, 50 °C Rt G, 0 min G, 15 min G, 30 min G, 45 min G, 60 min
1-Propanol 3.10 8.93 8.93 3.48 2.36 6.99 2.20 0.52 0.28 0.01 0.02 0.17 0.03 0.00 0.00 0.00
Ethyl acetate 4.13 26.54 26.54 0.74 3.85 3.65 1.08 1.08 2.93 0.47 0.20 1.06 0.17 0.07 0.45 0.06
Isobutanol 4.60 10.47 10.47 2.66 6.89 6.88 2.08 4.48 4.32 2.21 2.07 2.88 1.93 1.12 2.87 1.93
3-Methylbutanol 9.11 43.77 43.77 2.12 28.46 27.85 2.79 18.58 13.69 2.02 8.58 4.92 0.82 4.65 5.13 0.88 2-Methylbutanol 9.27 11.54 11.54 0.42 7.27 7.48 1.18 4.50 3.49 0.70 1.86 1.12 0.43 0.90 1.22 0.25 Isopentyl acetate 14.09 2.58 2.58 0.25 0.67 0.27 0.15 0.15 0.16 0.10 0.01 0.13 0.09 0.00 0.11 0.08 2-Phenyl ethanol 19.82 37.69 37.69 4.68 40.00 53.95 5.40 41.46 56.92 5.71 43.17 69.57 6.81 43.71 75.17 4.58
200 mbar, 67 °C Rt S, 0 min S, 15 min S, 30 min S, 45 min S, 60 min
1-Propanol 3.10 5.56 5.56 0.69 3.63 3.58 0.90 1.51 2.51 0.94 0.30 0.00 0.00 0.02 0.00 0.00
Ethyl acetate 4.13 17.82 17.82 1.79 2.99 4.09 1.00 0.79 1.19 0.07 0.22 0.86 0.14 0.07 0.46 0.11
Isobutanol 4.60 9.41 9.41 2.87 5.60 4.88 1.83 3.06 4.25 1.65 1.40 3.67 1.71 0.53 3.03 1.47
3-Methylbutanol 9.11 40.99 40.99 4.05 26.58 20.44 4.01 15.70 16.90 0.83 7.88 11.51 2.29 3.34 7.35 0.70 2-Methylbutanol 9.27 13.37 13.37 1.57 8.40 6.44 1.18 4.70 5.18 0.67 2.17 3.55 0.75 0.80 2.20 0.29 Isopentyl acetate 14.09 1.92 1.92 0.10 0.63 0.20 0.07 0.17 0.12 0.04 0.02 0.09 0.05 0.00 0.07 0.04 2-Phenyl ethanol 19.82 34.01 34.01 2.59 36.63 43.36 7.14 38.28 53.41 3.85 39.66 62.04 6.35 40.17 70.65 3.61
200 mbar, 67 °C Rt G, 0 min G, 15 min G, 30 min G, 45 min G, 60 min
1-Propanol 3.10 8.93 8.93 3.32 1.11 0.40 0.11 0.26 0.30 0.02 0.22 0.14 0.02 0.01 0.00 0.00
Ethyl acetate 4.13 26.54 26.54 3.91 0.90 5.18 0.48 0.35 1.24 0.28 0.34 2.91 0.53 0.10 2.73 0.25
Isobutanol 4.60 10.47 10.47 3.29 2.43 5.07 1.76 1.22 3.46 1.56 1.24 1.93 1.53 0.36 1.82 1.34
Nevertheless, the concentration of ethanol in the ethanolic fraction in alcohol by volume percentage (% ABV) was estimated by simulation at the two experimental pressures, 102 mbar and 200 mbar and an ad-ditional reduced pressure of 60 mbar.
The initial point (IP) was the labeled alcohol content of each beer 4.7% for G and 5.5% for S. The concentration of ethanol in the beer phase exhibited an exponential-like decay against the vapor fraction (Fig. 3). The % of vapor fractions at their correspondent times in the ex-periment is shown inTable 1.
In general, 1.0% ABV was obtained at about 15% of liquid vaporiza-tion. In this study we have analyzed and simulated the compositions considering the instant volume during the process. So, we have not corrected the values considering a possiblefinal dilution with water to the initial volume. This means that if thefinal residue (dealcoholized beer) would be diluted to the initial volume (e.g., adding water), the % ABV achieved would be lower than 1% of ethanol (that was obtained at 200 mbar for instance). This fact is illustrated inFig. 4, where we com-pare the % ABV for diluted distillate and for not diluted distillate.
3.2. Differences of the volatile compound profile during the laboratory scale vacuum distillation process
The volatile compound fraction in beer, apart from ethanol, is mainly comprised of higher alcohols formed during primary beer fermentation (Blanco et al., 2014). Higher alcohols contribute to the aroma of beer and produce a warm mouthfeel (Willaert & Nedovic, 2006). The most significant contribution is owed to propanol, isobutanol and isoamyl alcohols (2 and 3-methylbutanol) (Blanco et al., 2014; Brányik,
Vicente, Dostálek, & Teixeira, 2008). Higher alcohols are the immediate precursors of mostflavor active esters; hence, formation of higher alcohols needs to be controlled to ensure optimal ester production (Gonçalves et al., 2014) because of esters have very low flavor thresholds and a major impact on the overall flavor (Willaert &
Nedovic, 2006). However, low content of aroma compounds in
alcohol free beers could be attributed to the dealcoholization process (Riu-Aumatell, Miró, Serra-Cayuela, Buxaderas, & López-Tamames, 2014).
When we analyzed both regular beers, results showed (Table 2) that for all volatile compounds the concentrations were higher for the G sample than for the S sample with the exception of 2-methylbutanol, which was higher for the S sample (13.37 mg/L). Calculating the per-centage of volatiles (different than ethanol) lost in the dealcoholization process at 102 mbar and 200 mbar at the end of the experiment, it was found that almost all volatile compounds studied were evaporated along with ethanol with the exception of 2-phenyletanol. For the S sam-ple, losses of 97% of esters and 88% of alcohols were observed at 102 mbar and 76% of esters and 95% of alcohols at 200 mbar. For the G sample losses of 96% of esters and 92% of alcohols were achieved at 102 mbar, and 90% of esters and 95% of alcohols for 200 mbar. These vol-atile compound losses can be compared with those reported in previous studies by other authors using different dealcoholization processes (Table 3).
From our results, we can conclude that pressure does not have a sub-stantial impact on the relative volatility between the ethanol and other aroma components; therefore, we suggest that thefinal volatile profile after dealcoholization cannot be significantly improved by only modify-ing the pressure. Thus, the main alcohols and esters could be affected by the higher temperature applied at 200 mbar. From data inTable 2it can be seen that at 200 mbar and 67 °C the volatile compounds losses were higher for all compounds except for the amyl alcohols in S sample and ethyl acetate in G sample. Looking at the seven volatile compounds quantified in this study (Table 2), for the ethyl acetate, the evaporation was almost completed at thefirst 7.53% vapor fraction (Vf), correspon-dent with the average of % Vf at 15 min of the process (Table 1), in both samples and pressures (from initial values of 17.82 and 26.54 mg/L to 1.07 and 3.65 at 102 mbar; and to 4.09 and 5.18 mg/L at 200 mbar, for the samples S and G respectively), although for the 200 mbar pressure the evaporation seems more gradually.
Table 3
Losses of total esters and alcohols in percentage (%) by different alcohol free beer production processes: lab-scale vacuum distillation (this work, present as the average of both samples losses), osmotic distillation (Liguori et al., 2015), vacuum rectification (Montanari et al., 2009), fallingfilm evaporation, dialysis (Liguori et al., 2015) and reverse osmosis (Stein, 1993).
Lab-scale vacuum distillation Osmotic distillation Vacuum rectification Fallingfilm evaporation Dialysis Reverse osmosis
Total esters 97 (102 mbar) 83 (200 mbar)
99 100 95–100 99 78
Total alcohols 90 (102 mbar) 95 (200 mbar)
77 78 95–98 96 69
Table 4
Boiling points (°C) of the volatile compounds at the different experiment pressures.
Boiling points (°C)
Compounds Atmospheric pressure 102 mbar 200 mbar
Ethyl acetate 77.1 13.7 32.3
1-Propanol 97 33.6 52.2
Isobutanol 107.9 44.5 63.1
Isopentyl acetate 142 78.6 97.2
2-Methylbutanol 127.5 64.1 82.7
3-Methylbutanol 131.1 67.7 86.3
2-Phenyl ethanol 220 156.6 175.2
Table 5
Estimated parameters for Element-1 of Wilson-2 equation in HYSYS.
Sucrose Ethanol Ethyl acetate
1-Propanol Isobutanol Isopentyl acetate
2-Methylbutanol 3-Methylbutanol 2-Phenylethanol Water Nitrogen
Sucrose 0.0000 0.0000 0.0000 0.0000 0.0000 0.0000 0.0000 0.0000 0.0000 0.0000 0.0000
Ethanol 0.0000 0.0000 2.0000 −12.6000 −1.8000 9.5000 2.5000 2.5000 0.0000 −0.0503 0.0000
Ethyl acetate 0.0000 0.3000 0.0000 2.0000 0.0000 0.0000 0.0000 0.0000 0.0000 −1.8000 0.0000
1-Propanol 0.0000 12.6000 −0.8296 0.0000 0.9130 0.0000 3.0350 3.0350 0.0000 1.1919 0.0000
Isobutanol 0.0000 1.8000 0.0000 −0.7573 0.0000 0.0000 0.0000 0.0000 0.0000 0.0000 0.0000
Isopentyl acetate 0.0000 −9.5000 0.0000 0.0000 0.0000 0.0000 0.0000 0.0000 0.0000 2.0000 0.0000 2-Methylbutanol 0.0000 −0.3000 0.0000 −2.0368 0.0000 0.0000 0.0000 0.0000 0.0000 0.0000 0.0000 3-Methylbutanol 0.0000 −0.7256 0.0000 −2.0368 0.0000 0.0000 0.0000 0.0000 0.0000 0.0000 0.0000
2-Phenylethanol 0.0000 0 0.0000 0.0000 0.0000 0.0000 0.0000 0.0000 0.0000 0.0000 0.0000
Water 0.0000 −2.5035 −1.8000 −7.0000 0.0000 −2.0000 0.0000 0.0000 0.0000 0.0000 0.0000
1-Propanol was almost completely gone within thefirst of 10.52% Vf in both experiments and beers apart from the S sample at 200 mbar, in which its lost extended to a 14.43% Vf.
Isobutanol was evaporated gradually over the process time course under both experimental conditions but, at thefirst 10.52% Vf more than a half of the concentration was removed (from 9.41 and 10.47 mg/L to 4.68 and 4.32 at 102 mbar; and to 4.25 and 3.46 mg/L at 200 mbar, for the samples S and G, respectively). A similar trend was ob-served for isopenthyl acetate, but in this case more than a half was re-moved during thefirst 7.53% Vf.
For both experiments and samples during thefirst 7.53% Vf the amount of amyl alcohols (2-methylbutanol and 3-methylbutanol) was reduced by approximately 50%, except for the G sample at 102 mbar. At the end of the laboratory dealcoholization process the amyl alcohols were in higher concentration for the S sample in both experiments (102 mbar, 50 °C and 200 mbar, 67 °C).
At the end of both dealcoholization processes (17.87% Vf) the con-centrations of the majority of the volatile compounds analyzed were higher for the S sample.
The aromatic alcohol 2-phenylethanol causes‘sweet’or‘rose’flavors in beer (Šmogrovičová & Dömény, 1999). Surprisingly, in this laboratory scale dealcoholization process 2-phenylethanol was apparently pro-duced during the experimental process. This compound has a high boil-ing point (Table 4), and it was expected to slightly increase its concentration due to the vaporization process (that reduces the volume of the remaining liquid). This feature was simulated using Aspen HYSYS, obtaining that 2-phenylethanol should have increased its concentration by 3 to 5% maximum, as reported previously byZürcher et al. (2005). However, its concentration increased after the distillation process by about 30 to 50%, that is from 37.69 ppm up to 59.97 ppm (G at 200 mbar, 67 °C) and 75.17 ppm (G at 102 ppm, 50 °C), and from an ini-tial of 34.01 ppm up to 70.65 ppm (S at 200 mbar) and 85.28 ppm (S at 102 mbar).
It is well known that, during fermentation, 2-phenyletanol is formed by phenylalanine catabolism (Kobayashi et al., 2008). Higher alcohols achieve maximum concentrations during batch fermentation at a time roughly coincident with cell growth arrest and minimum free amino ni-trogen (FAN) concentration. Their formation takes place by the so-called anabolic and catabolic routes. In the anabolic route the 2-oxo acids, arising from carbohydrate metabolism, are decarboxylated to form aldehydes, which are reduced to the corresponding alcohols. Si-multaneously, 2-oxo acids also derived from amino acid utilization, which is termed the catabolic (Ehrlich) route to higher alcohol forma-tion. Thefinal concentration of higher alcohols is therefore determined by the uptake efficiency of the corresponding amino acid and the sugar utilization rate. The contribution of each biosynthetic pathway is infl u-enced by the amino acid composition of the wort, fermentation stage and yeast strain. In addition, some higher alcohols may originate from the reduction of aldehydes and ketones that are present in the wort (Brányik et al., 2008). However, in the present study, the beers used were commercial beers, so they werefiltered and no fermentation op-tion is possible. Therefore, we explain this effect by the potential degra-dation and/or transformation of other beer components due to a combined effect of temperature and residence time. It has been shown that, at industrial scale, beer stays only for a few seconds in the dealcoholization processes as it happens in thinfilm evaporators or spinning cone columns (Brányik et al., 2012). Conversely, in the exper-imental setup used in this study, the interfacial area of evaporation was considerable lower than that in thinfilm evaporators, and, hence, the time required for reaching thefinal ethanol content (≤1%) was calculat-ed to be nearly 45 min, a residence time long enough to give rise to transformation of other potentially related compounds. In this sense, one of the possible formation routes is from the degradation of the amino acid 2-phenylalanine, but any other component from the same metabolic route, e.g., phenyl pyruvate, phenyl acetaldehyde or phenyl
acetic acid can additionally lead to 2-phenyethanol in an acidic Tab
hydrogen donor bulk liquid (i.e., water/ethanol) such as beer. When a prolonged heating of beer is made, probably the remained content of this amino acid or other similar compound forms the compound by re-action. Accordingly, 2-phenylethanol might be used as a marker of overheating or overtiming in beer dealcoholization processes.
3.3. Simulation results and thermodynamic parameters
In order to demonstrate the feasibility of a dynamic Aspen HYSYS simulation for the dealcoholization process, several thermodynamic packages were considered. In the present study, it was necessary to con-sider an EoS with interaction in liquid phase, such as NRTL or Wilson. For our simulation the best results were found using Wilson-2 thermo-dynamic package from HYSYS database.
However, the deviations of the simulation results against the exper-imental results were unacceptable using the default parameters of the software. Thus, we have performed afit of the selected binary interac-tion coefficients for the main measured compounds at 15 min, and then the simulation was tested to check whether the system was able to predict or not the other experimental data points.
The bestfit parameters for Wilson-2 Element-1 and Element-2 (i.e., interaction parameters according to Aspen HYSYS nomenclature) are listed inTables 5 and 6(see alsoFigs. 5 and 6for component concentra-tion graphs).
The predictions for the seven compounds analyzed were very ac-ceptable. Average absolute deviations (determined as the absolute value of the simulated instant concentration minus the experimental in-stant concentration, divided by the initial value of the concentration) were between 6.9 and 15.1% for both S and G beers (excluding the
0.0 5.0 10.0 15.0 20.0 25.0
0% 5% 10% 15% 20%
ppm
% vapor fraction
Ethyl acetate G
SIM 60 SIM 102 EXP 102 SIM 200 EXP 200
0.0 2.0 4.0 6.0 8.0 10.0
0% 5% 10% 15% 20%
ppm
% vapor fraction
Isobutanol G
SIM 60 SIM 102 EXP 102 SIM 200 EXP 200 0.0 0.5 1.0 1.5 2.0 2.5
0% 5% 10% 15% 20%
ppm
% vapor fraction
Isopentyl acetate G
SIM 60 SIM 102 EXP 102 SIM 200 EXP 200
0.0 2.0 4.0 6.0 8.0 10.0 12.0 14.0
0% 5% 10% 15% 20%
ppm
% vapor fraction
2-Methylbutanol G
SIM 60 SIM 102 EXP 102 SIM 200 EXP 200
0.0 10.0 20.0 30.0 40.0 50.0
0% 5% 10% 15% 20%
ppm
% vapor fraction
3-Methylbutanol G
SIM 60 SIM 102 EXP 102 SIM 200 EXP 200
0.0 10.0 20.0 30.0 40.0 50.0 60.0 70.0 80.0
0% 5% 10% 15% 20%
ppm
% vapor fraction
2-Phenylethanol G
SIM 60 SIM 102 EXP 102 SIM 200 EXP 200 0.0
2.0 4.0 6.0 8.0
0% 5% 10% 15% 20%
ppm
% vapor fraction
1-Propanol G
SIM 60 SIM 102 EXP 102 SIM 200 EXP 200
values of 2-phenylethanol that behaves oddly). The values obtained by simulation (SIM) and experimentation (EXP) are listed inTable 2(see alsoFigs. 5 and 6).
For the case of 2-phenylethanol it is clear that the component is gen-erated by reaction, so the simulation cannot predict it as the assumption 5 (seeSection 2.4) is not fulfilled.
Considering the difficulty of the analysis and the system itself we consider the simulation values for prediction acceptable. This is the
first time, to our knowledge, that beer is dealcoholized and the experi-mental values arefit to a simulation and thermodynamic model aimed at creating a prediction tool.
From our point of view, the prediction could be improved by study-ing the kinetics of formation of 2-phenylethanol and by studystudy-ing a pilot scale plant using a short-residence time equipment (such as fallingfill evaporator), but this is out of the scope of this paper. Nevertheless,
2-phenylethanol appeared from 15 min on, so this means that the ther-modynamic approach is valid for times below that time that indicates that it could be used for simulation of short residence time pieces of equipment.
4. Conclusions
Low alcohol and free alcohol beers from thermal dealcoholization (e.g., vacuum distillation) lack of theflavor and aroma compounds that the original beers possesses. Literature data on this is scarce and, so far, no simulation tools to predict the compositions during the dealcoholization process have been published.
In this study, we have observed howflavor compounds analyzed vanished to very low concentration levels in the lab-scale vacuum 0.0
5.0 10.0 15.0 20.0 25.0
0% 5% 10% 15% 20%
ppm
% vapor fraction
Ethyl acetate S
SIM 60 SIM 102 EXP 102 SIM 200 EXP 200
0.0 2.0 4.0 6.0 8.0 10.0
0% 5% 10% 15% 20%
ppm
% vapor fraction
Isobutanol S
SIM 60 SIM 102 EXP 102 SIM 200 EXP 200
0.0 0.5 1.0 1.5 2.0 2.5
0% 5% 10% 15% 20%
ppm
% vapor fraction
Isopentyl actate S
SIM 60 SIM 102 EXP 102 SIM 200 EXP 200
0.0 2.0 4.0 6.0 8.0 10.0 12.0 14.0
0% 5% 10% 15% 20%
ppm
% vapor fraction
2-Methylbutanol S
SIM 60 SIM 102 EXP 102 SIM 200 EXP 200
0.0 10.0 20.0 30.0 40.0 50.0
0% 5% 10% 15% 20%
ppm
% vapor fraction
3-Methylbutanol S
SIM 60 SIM 102 EXP 102 SIM 200 EXP 200
0.0 10.0 20.0 30.0 40.0 50.0 60.0 70.0 80.0
0% 5% 10% 15% 20%
ppm
% vapor fraction
2-Phenylethanol S
SIM 60 SIM 102 EXP 102 SIM 200 EXP 200 0.0
2.0 4.0 6.0 8.0
0% 5% 10% 15% 20%
ppm
% vapor fraction
1-Propanol S
SIM 60 SIM 102 EXP 102 SIM 200 EXP 200
distillation process during 60 min at vaporization level of around 20% in mass.
Two pressures were checked (102 and 200 mbar) at two corre-sponding temperatures (50 and 67 °C respectively). In general, results were similar under both experimental conditions, but slightly morefl a-vor disappearing was measured at 200 mbar.
An unexpectedly high concentration of 2-phenylethanol was found at the end of the process, its concentration increasing by about 30 to 50% with regard to the initial one. The reasons for this result are not yet entirely understood, however it might indicate that one or several reactions of other phenolics arising in the 2-phenylethanol metabolic route were involved and produced it during the distillation process, due to a combined effect of temperature and residence time.
For the first time we have tested a simulation tool for beer dealcoholization against the laboratory results,fitting the thermody-namic binary interaction coefficients of a Wilson Equation of State. Although, more research is needed in this sense, we succeed in the simulation of the behavior of six components, i.e., 2-methylbutanol, 3-methylbutanol, ethyl acetate, 2-phenylethanol, isobutanol and 1-propanol together with the ABV % using Aspen HYSYS with Wilson-2 EoS and a set of binary interaction parameters. Although the residence time is very high in differential bath vacuum distillation compared to the industrial thinfilm evaporators, the simulation tool is considered to be acceptable because the thermodynamic behavior does not depend on the residence time.
To sum up, the adjusted parameters of the simulation process are the key to overview the behavior of any beer sample and their volatile com-pound profiles at different temperatures, times and pressures, for real processes such as vacuum distillation or thinfilm evaporators.
Acknowledgments
The authors acknowledge the Spanish Economy and Competitive-ness Ministry, Project Reference: ENE2012-33613 and the regional government (Junta de Castilla y León), Project Reference: VA330U13 and VA332A12-2 for funding.
References
Andrés-Iglesias, C., Blanco, C.A., Blanco, J., & Montero, O. (2014).Mass spectrometry-based metabolomics approach to determine differential metabolites between regular and non-alcohol beers.Food Chemistry,157, 205–212.
Andrés-Iglesias, C., Montero, O., Sancho, D., & Blanco, C.A. (2014).New trends in beerfl a-vour compound analysis.Journal of the Science of Food and Agriculture,95, 1571–1576. ASTM-International (2012).ASTM D86-12. In W. Conshohocken (Ed.),Standard test
method for distillation of petroleum products at atmospheric pressure.
Bamforth, C.W. (2001).Nutritional aspects of beer—A review.Nutrition Research,22(1), 227–237.
Belisario-Sánchez, Y.Y., Taboada-Rodriguez, A., Marin-Iniesta, F., & López-Gómez, A. (2009).Dealcoholized wines by spinning cone column distillation: phenolic com-pounds and antioxidant activity measured by the 1,1-diphenyl-2-picrylhydrazyl method.Journal of Agricultural and Food Chemistry,57(15), 6770–6778.
Berk, Z. (2013).Chapter 13—Distillation. In Z. Berk (Ed.),Food process engineering and technology(pp. 329–352) (Second ed.). San Diego: Academic Press.
Blanco, C.A., Andrés-Iglesias, C., & Montero, O. (2014). Low-alcohol beers: Flavour com-pounds, defects and improvement strategies.Critical Reviews in Food Science and Nutrition.http://dx.doi.org/10.1080/10408398.2012.733979.
Brányik, T., Silva, D.P., Baszczyňski, M., Lehnert, R., & Almeida e Silva, J.B. (2012).A review of methods of low alcohol and alcohol-free beer production.Journal of Food Engineering,108(4), 493–506.
Brányik, T., Vicente, A.A., Dostálek, P., & Teixeira, J.A. (2008).A review offlavour formation in continuous beer fermentations.Journal of the Institute of Brewing,114(1), 3–13. Catarino, M., Ferreira, A., & Mendes, A. (2009).Study and optimization of aroma recovery
from beer by pervaporation.Journal of Membrane Science,341(1–2), 51–59. Catarino, M., & Mendes, A. (2011).Non-alcoholic beer—A new industrial process.
Separation and Purification Technology,79(3), 342–351.
Catarino, M., Mendes, A., Madeira, L.M., & Ferreira, A. (2007).Alcohol removal from beer by reverse osmosis.Separation Science and Technology,42(13), 3011–3027. Charry-Parra, G., DeJesús-Echevarria, M., & Perez, F.J. (2011).Beer volatile analysis:
Opti-mization of HS-SPME coupled to GC/MS/FID.Journal of Food Science,76, 205–211. Claus, M.J., & Berglund, K.A. (2005).Fruit brandy production by batch column distillation
with reflux.Journal of Food Process Engineering,28(1), 53–67.
Claus, M.J., & Berglund, K.A. (2009).Defining still parameters using CHEMCAD batch distillation model for modeling fruit spirits distillations.Journal of Food Process Engineering,32(6), 881–892.
Dong, L., Piao, Y., Zhang, X., Zhao, C., Hou, Y., & Shi, Z. (2013).Analysis of volatile compounds from a malting process using headspace solid-phase micro-extraction and GC–MS.Food Research International,51(2), 783–789.
Gaiser, M., Bell, G.M., Lim, A.W., Roberts, N.A., Faraday, D.B.F., Schulz, R.A., et al. (2002). Computer simulation of a continuous whisky still.Journal of Food Engineering,
51(1), 27–31.
Gonçalves, J.L., Figueira, J.A., Rodrigues, F.P., Ornelas, L.P., Branco, R.N., Silva, C.L., et al. (2014).A powerful methodological approach combining headspace solid phase microextraction, mass spectrometry and multivariate analysis for profiling the volatile metabolomic pattern of beer starting raw materials.Food Chemistry,160, 266–280.
Karlsson, H.O.E., & Trägårdh, G. (1997).Aroma recovery during beverage processing.
Journal of Food Engineering,34(2), 159–178.
Kobayashi, M., Shimizu, H., & Shioya, S. (2008).Beer volatile compounds and their appli-cation to low-malt beer fermentation.Journal of Bioscience and Bioengineering,106(4), 317–323.
Labanda, J., Vichi, S., Llorens, J., & López-Tamames, E. (2009).Membrane separation tech-nology for the reduction of alcoholic degree of a white model wine.LWT—Food Science and Technology,42(8), 1390–1395.
Lang, P., Yatim, H., Moszkowicz, P., & Otterbein, M. (1994).Batch extractive distillation under constant reflux ratio.Computers and Chemical Engineering,18, 1057–1069. Lehnert, R., Novak, P., Macieira, F., Kurec, M., Teixeira, J.A., & Branyik, T. (2009).
Optimisa-tion of lab-scale continuous alcohol-free beer producOptimisa-tion.Czech Journal of Food Sciences,27(4), 267–275.
Liguori, L., De Francesco, G., Russo, P., Perretti, G., Albanese, D., & Di Matteo, M. (2015). Production and characterization of alcohol-free beer by membrane process.Food and Bioproducts Processing,94, 158–168.
Montanari, L., Marconi, O., Mayer, H., & Fantozzi, P. (2009).Chapter 6—Production of alcohol-free beer. In V.R. Preedy (Ed.),Beer in health and disease prevention
(pp. 61–75). San Diego: Academic Press.
Mota, A., Novák, P., Macieira, F., Vicente, A.A., Teixeira, J.A.,Šmogrovičová, D., et al. (2011). Formation offlavor-active compounds during continuous alcohol-free beer produc-tion: The influence of yeast, strain, reactor configuration, and carrier type.Journal of the American Society of Brewing Chemists,69, 1–7.
Olmo, Á. d., Blanco, C.A., Palacio, L., Prádanos, P., & Hernández, A. (2014).Pervaporation methodology for improving alcohol-free beer quality through aroma recovery.
Journal of Food Engineering,133(0), 1–8.
Pickering, G.J. (2000).Low- and reduced-alcohol wine: A review.Journal of Wine Research,
11(2), 129–144.
Piddocke, M.P., Kreisz, S., Heldt-Hansen, H.P., Fog Nielsen, K., & Olsson, L. (2009). Physio-logical characterization of brewer's yeast in high-gravity beer fermentations with glucose or maltose syrups as adjuncts.Applied Microbiology and Technology,84, 453–464.
Riu-Aumatell, M., Miró, P., Serra-Cayuela, A., Buxaderas, S., & López-Tamames, E. (2014). Assessment of the aroma profiles of low-alcohol beers using HS-SPME–GC–MS.
Food Research International,57, 196–202.
Rodrigues, F., Caldeira, M., & Câmara, J.S. (2008).Development of a dynamic headspace solid-phase microextraction procedure coupled to GC-qMSD for evaluation the chemical profile in alcoholic beverages.Analytical Chimica Acta,609, 82–104. Šmogrovičová, D., & Dömény, Z. (1999).Beer volatile by-product formation at different
fermentation temperature using immobilised yeasts.Process Biochemistry,34(8), 785–794.
Sohrabvandi, S., Mousavi, S.M., Razavi, S.H., Mortazavian, A.M., & Rezaei, K. (2010). Alcohol-free beer: Methods of production, sensorial defects, and healthful effects.
Food Reviews International,26(4), 335–352.
Stein, W. (1993).Dealcoholization of beer.Technical Quarterly Master Brewers Association of Americas,30, 54–57.
Willaert, R., & Nedovic, V.A. (2006).Primary beer fermentation by immobilised yeast—A review onflavour formation and control strategies.Journal of Chemical Technology & Biotechnology,81(8), 1353–1367.
Yatim, H., Moszkowicz, P., Otterbein, M., & Lang, P. (1993).Dynamic simulation of a batch extractive distillation process.Computers and Chemical Engineering,17, 57–62. Zürcher, A., Jakob, M., & Back, W. (2005).Improvements inflavor and colloidal stability of