Biogeochemical controls on the oxygen, nitrogen and sulfur distributions in the water column of Golfo Dulce: an anoxic basin on the Pacific coast of Costa Rica revisited
22
0
0
Texto completo
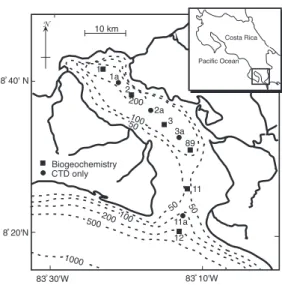
(2) of nitrate to dinitrogen gas led to the observed DIN deficit: 4NO3- + 5CH2O + 4H+ → 2N2 + 5CO2 + 7H2O. Only in the bottom-most waters were low concentrations of hydrogen sulfide (<5 µM) measured. Richards et al. (1971) suggested that the anoxic, but non-sulfidic, conditions in the lower water column are maintained by intermittent introductions of water over the sill, correlated, perhaps, with seasonal upwelling and wind events. In January 1994, we visited Golfo Dulce as part of the R/V Victor Hensen Costa Rica Expedition 1993/1994. Vargas and Wolff (1996) various aspects of this cruise leg have been described in Thamdrup et al. (1996) and Kuever et al. (1996). In this paper we wish to address specific questions posed by the work of Richards et al. (1971) that concern the biogeochemistry of the sub-pycnocline water column: (1) What controls the concentration of dissolved sulfide in the water column, and (2) At which rates, and through which processes is dissolved inorganic nitrogen (DIN) removed from Golfo Dulce?. To this end we measured the distribution of electron acceptors – oxygen, nitrate, manganese and iron oxides, and sulfate, and the rates of oxygen consumption, denitrification, and sulfate reduction in the water column and in the sediment. Furthermore, we examined microbial distributions throughout the chemical zonation of the water column, employing both traditional microscopy and fluorescent labeling coupled with image analysis. Finally, we used sulfur speciation, iron oxide speciation, and 210Pb-derived rates of sedimentation to explore the role of both water column and sedimentary processes as a control on water column sulfide distributions. Our assay for denitrification documented such activity in sediments underlying oxic waters, but did not detect denitrification in either the sediment or water column of the anoxic basin (Thamdrup et al. 1996), in apparent contradiction to Richards’ hypothesis (Richards et al. 1971). A recent study has, however, shown. 172. that this process does occur in the water of central basin, but also that another, newly discovered microbial process, namely anaerobic ammonium oxidation or “anammox”, contributes to DIN removal (Dalsgaard et al. 2003). Anammox is the co-proportionation of nitrite and ammonium (van de Graaf et al. 1995): NO2- + NH4+→ N2 + 2H2O. We reinterpret our denitrification data based on these results.. MATERIALS AND METHODS Chemical and physical characteristics, water column. Salinity and temperature were measured using a Conductivity-TemperatureDepth (CTD) sensor (ME-MeerestechnikElectronik) at all stations shown in Figure 1. Water samples were collected from a 5 liter General Oceanics Go-Flo bottle at 20 m waterdepth intervals at Stations 1, 2, 3, 89, 11, and 12 (Fig. 1). Water was removed anoxically from the Go-Flo bottle by applying a slight N2 overpressure and was collected in 250 mL Winkler-type bottles under a N2 atmosphere in a glovebag. Dissolved oxygen was determined. Fig. 1. Sampling stations in Golfo Dulce, Pacific coast of Costa Rica. 1994.. Rev. Biol. Trop. (Int. J. Trop. Biol. ISSN-0034-7744) Vol. 54 (Suppl. 1): 171-191, September 2006.
(3) by Winkler titration using Winkler reagents that had been degassed with nitrogen. For sampling in the expectedly deep anoxic and sulfidic zone, the method of Ingvorsen and Jørgensen (1979) was used to determine the dissolved sulfide and oxygen concentrations on the same samples. Sulfide was quantified using the methylene blue technique (Cline 1969). Subsamples for measurement of nitrate, ammonium and urea were frozen and later analyzed with an autoanalyzer (APHA 1992). Nitrate and nitrite concentrations were determined together and will be referred to collectively as nitrate. Phosphate was determined using the phospho-molybdate method (APHA 1992). Total CO2 was determined on samples using flow-injection analysis (after Hall and Aller 1992). Samples for suspended elemental sulfur were collected by anoxically flushing a known amount of seawater through an in-line GF/F glass fiber filter. The filters were preserved in a 2% zinc chloride solution, and frozen. Later, elemental sulfur was extracted from the filter with methanol and the elemental sulfur was analyzed by reversed-phase HPLC (Möckel 1984, Ramsing et al. 1996). Thiosulfate was measured using the DTNP derivatization technique of Vairavamurthy and Mopper (1990). Dissolved and particulate manganese and iron samples were separated by filtering water through N2-flushed glass fiber filters (Whatman GF/F). The filtrate was immediately acidified to pH 1 with 6 N HCl. The filters were frozen. Particulate manganese and iron on the filters were extracted by the dithionite-citrate-acetate extraction method (Lord 1980). Iron was analyzed by reaction with Ferrozine (0.02% in 50mM HEPES buffer, pH 7; Stookey 1970) and colorimetric determination on a Shimadzu UV-160A spectrometer (1 cm cell path length); manganese was analyzed using flame atomic absorption spectrometry on a Perkin Elmer atomic absorption spectrometer. Sediment. Sediment samples were obtained with a 50 x 50 cm box corer. Sediment was collected both from the basin floor (Station 1 at a water depth of 205 m) and from the slope of the basin (Station 160 at water depth of 163 m).. Box cores showing no apparent disturbance of the surface sediment were sub-cored with 36 mm acrylic tubes. Pore waters were either obtained by sectioning and centrifugation or by use of a pneumatic pore water squeezer (operated within an anaerobic glovebag for the processing of reduced sulfur species). Pore waters for dissolved sulfide and sulfate were also preserved in 0.15 M ZnCl2. Concentrations of pore water sulfide were analyzed using the methylene blue method (Cline, 1969). Sulfate was determined using non-suppressed ion chromatography. Sediment samples for solid phase sulfur samples were preserved in 1.5 M zinc acetate dihydrate and frozen. Solid phase concentrations of acid volatile sulfide (AVS) and chromium reducible S (CRS) were determined using the two-step Cr-II distillation method (without carrier) as described by Fossing and Jørgensen (1989). Pyrite S was defined as the difference between CRS and elemental sulfur. Elemental sulfur in the sediment samples was determined on methanol extracts of zinc preserved sub-samples (ca. 100 mg sediment and 10.0 mL methanol) using reversed-phase HPLC (Möckel 1984, Ramsing et al. 1996). Poorly crystalline Fe(III) and easily extractable Fe(II) concentrations were extracted from sediments using the dithionite and oxalate extraction procedures respectively, and quantified as described in Canfield et al. (1993). Gamma analysis of dried sediments for the determination of 210Pb (47 kev), 226Ra daughter products 214Pb (295 and 352 kev) and 214Bi (609 kev), 137Cs (662 kev), and 40K (1460 kev) were performed at the University of Delaware, College of Marine Studies. Samples were sealed at least 15 days before counting to ensure secular equilibrium between the 226Ra and daughters 222Rn, 214Pb, 214Bi. Self-absorption of the sample at 47 kev, 295 kev, 352 kev, and 609 kev was corrected by the method of Cutshell et al. (1983). Microbiology of the water column. The microbiological analysis included phase-contrast microscopy, viable counts and isolations of sulfur-oxidizing bacteria, community analysis by denaturing gradient gel electrophoresis. Rev. Biol. Trop. (Int. J. Trop. Biol. ISSN-0034-7744) Vol. 54 (Suppl. 1): 171-191, September 2006. 173.
(4) (DGGE) of extracted ribosomal DNA, and epifluorescence microscopy combined with image analysis. Results of all but the last approach have been presented by Kuever et al. (1996). To preserve samples for staining and image analysis, 10 mL of a freshly prepared fixative (buffered paraformaldehyde solution; Ramsing et al. 1996) was added to a 20 mL water sample. The fixed sample was then mixed and stored at 4 °C for 50-60 hours prior to filtration. Details of the filtration and dehydration procedure are given in Ramsing et al. (1996). Briefly, samples were filtered and dehydrated in filtration wells containing 25 mm, 0.2 µm aluminum oxide filters (Anopore™ from Millipore GmbH) and stored desiccated at 4 °C. Hybridization efficiency and autofluorescence of desiccated samples were unaltered after 3 months (data not shown). Cell distributions throughout the water column were quantified using a series of three stains: 1) DAPI, a general stain for DNA; 2) ethidium bromide (EtBr), a general stain for nucleic acids; 3) fluorescent in situ hybridization (FISH) using the 338F 16S rRNA oligonucleotide probe for Bacteria devised by Amann et al. (1990). For EtBr and DAPI staining, 200 µL of 3 µg mL-1 EtBr or DAPI in filtered seawater was applied to a well of the filtration device containing one of the preserved filters. After 10 min incubation at room temperature the liquid was removed by gentle suction. Details of the fluorescent hybridization procedure used for the 338F Bacteria oligonucleotide probe, and of the image acquisition parameterization and digital image analysis are given in Ramsing et al. (1996). For image analysis the stained and hybridized samples were examined with a Zeiss Axioplan epifluorescence microscope. The following Zeiss standard filters were used: filterset 10 for blue excitation with green emission (selective for fluorescein) and filterset 15 for red (EtBr). The pictures presented were taken with a 63x planNEOFLUAR oil immersion objective without additional magnification. Microbial processes. Oxygen consumption rates in the water column were determined. 174. by monitoring oxygen concentration changes in water samples incubated in 50 mL Winkler bottles stored in the dark at in situ temperature. Rates of denitrification in the water column were determined using the isotope pairing technique of Nielsen (1992), in which the 15N:14N ratios of N produced during incuba2 tion with 15NO3- are analyzed. The technique, originally developed for sediments, was modified for application to water samples. For this, we added 150 µL of 15 mM 15N-NO3- to water samples enclosed in 50 mL Winkler bottles, to a final nitrate concentration of 45 µM plus the ambient concentration (between 0 and 20 µM). The bottles were incubated in the dark at in situ temperature for 12 hours, after which water was transferred to 12.6-mL exetainers that were filled completely, with overflow, and these samples were fixed by the addition of 0.1 mL of a 50%-wt. ZnCl2 solution for later mass spectrometry of N2. Sulfate reduction at two depths within the water column, 200 m and 204 m, was determined on water samples partitioned anoxically into 300 mL glass stoppered bottles. After injecting 25 µL of 205 kBq µL-1 carrier-free SO42- into the bottles, the samples were incubated for 6 hours in the dark and at 17º C. Microbial activity was halted by removing 3 mL of solution and then adding 1 mL of 11 M ZnCl2 solution and 1 mL of 4 M sodium sulfide solution. Samples were frozen until analyzed. Reduced 35S resulting from sulfate reduction in bottles was determined using the acidic CrII distillation method (Fossing and Jørgensen 1989). Denitrification rates in surface sediments from Station 1 were measured by incubating sediment cores at 17º C with overlying anoxic water labeled with 150 µL of 15 mM 15N-NO3-, and determination of the rates of N2 production using the isotope pairing technique of Nielsen (1992). Sulfate reduction rates in the sediments at Station 1 and Station 160 were determined using the whole-core 35SO42- method described in Jørgensen (1978). Carrier-free 35SO42- (2 µL of 205 kBq µL-1) was injected into 26 mm diameter sub-cores through silicon-filled side ports at 1 cm intervals and incubated at 17º C for 8. Rev. Biol. Trop. (Int. J. Trop. Biol. ISSN-0034-7744) Vol. 54 (Suppl. 1): 171-191, September 2006.
(5) hours. At Station 1, an additional type of incubation was also employed, in which sulfate reduction was determined by injecting 5 mL of homogenized sediment from distinct sediment horizons with 5 µL of 37 kBq µL-1 of carrier-free 35SO42-, as described in Canfield et al. (1993). All incubations were terminated by mixing the sediment with equal volumes of 0.15 M zinc acetate solution and freezing. Sulfate reduction rate blanks were determined by adding sediment to zinc acetate as described and then adding 35SO42-. Reduced 35S resulting from sulfate reduction in the zinc preserved samples was determined using the acidic Cr-II distillation method (Fossing and Jørgensen 1989).. Results Physical and chemical characteristics of the water column. A transect (Fig. 2) from. the Pacific Ocean, across the sill and along the main longitudinal axis of Golfo Dulce showed steep vertical gradients of temperature, salinity, and density centered between 40 and 50 m. An upper mixed layer of 30 m depth, a strong pycnocline, and a deeper, apparently well-mixed bottom water of 150 m, could be delineated. The pycnocline showed a slight downward tilt from the head of the bay to the sill of 0.18 m km-1 and a slightly steeper downward tilt of 0.44 m km-1 from the sill to the outermost Pacific Ocean station. The pycnocline rested approximately ten to twenty meters above the sill height, thus affording a connection between the sub-pycnocline Pacific and deep Golfo Dulce basin waters. The vertical turbulent eddy diffusion coefficient (Kz, for any depth, z) was approximated from the density gradient as described in Gargett (1984), Landing et al. (1991), and Lewis and Landing (1991) and is also shown in Figure 2. Eddy diffusion is related to the. Fig. 2. Longitudinal CTD transects of Golfo Dulce showing (a) temperature, (b) salinity, and (c) density as sigma-t. The calculated vertical eddy diffusion coefficient, Kz, is shown in (d). January 1994.. Rev. Biol. Trop. (Int. J. Trop. Biol. ISSN-0034-7744) Vol. 54 (Suppl. 1): 171-191, September 2006. 175.
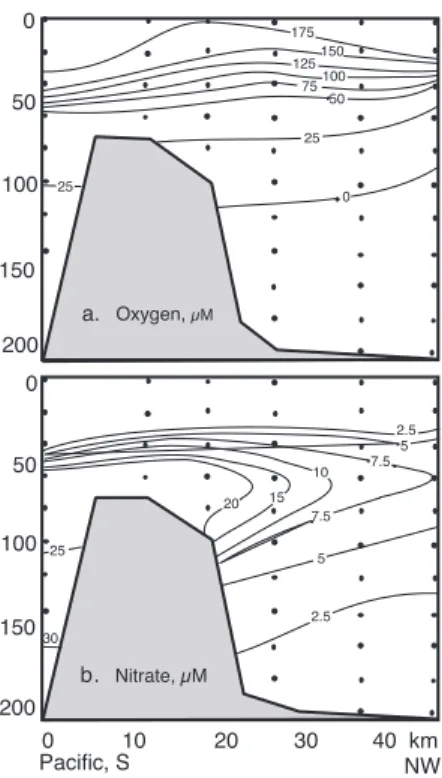
(6) Brunt-Väisälä (buoyancy) frequency, N2, and to the input of energy to the basin via internal waves, a0, by the equations: Kz = a0 N(-1 to -1.2) (1). and N2 = [-(g/r0) (∂r/∂z)] (2). where g is the gravitational acceleration constant, (980 cm s-2), r0 is the average density over a given interval (a ten point running average in this case), and ∂r/∂z is the density gradient over the same interval. A value of 0.0005 cm2 s-1 was chosen for a0, as it falls between values calculated for completely restricted basins (0.0001 cm2 s-1; Landing et al., 1991) and the open ocean (0.001 cm2 s-1, Gargett 1984). Calculated values of Kz, as shown in Figure 2d, reflect the density gradient, with the lowest values of Kz, in the pycnocline (less than 0.0025 cm2 s-1). The values of Kz below the pycnocline ranged from 0.01 to 0.025 cm2 s-1. The values calculated for the deep basin in Golfo Dulce fell between those calculated for Jellyfish Lake, Palau, a completely restricted marine lake (0.0015 cm2 s-1; Landing et al. 1991), and larger, more open, anoxic basins, such as the Black Sea (0.06 cm2 s-1; Lewis and Landing 1991) and Cariaco Trench (0.06 cm2 s-1; Scranton et al. 1987). Note that the Kz values below the pycnocline were relatively constant with depth and were of the same magnitude as the very surface waters. Within the Golfo Dulce basin, oxygen isopleths tilted upwards proceeding from the sill to the head of the bay (Fig. 3a) . Near the sill, oxygen fell below detection limits (1 µM) at depths between 120 and 140 m depth, while near the head of the bay, oxygen concentrations were already depleted (<1 µM) at depths of 120 m. Oxygen concentrations on the Pacific side of the sill also exhibited sharp decreases through the pycnocline, but never fell below values of 25 µM. Figure 3b illustrates the horizontal as well as vertical gradients that exist for nitrate in the deep basin of Golfo Dulce. Nitrate concentrations in the surface waters were low, with concentrations <2.5 µM. Concentrations of. 176. nitrate within the interior of the basin increased with depth across the pycnocline to values of 7.5 to 15 µM. At the head of Golfo Dulce, nitrate concentrations decreased to <2.5 µM at >160 m. Near the sill, pycnocline concentrations of nitrate reached values of >20 µM, while in the Pacific Ocean, nitrate concentrations increased with depth to values of >30 µM. These distributions of nitrate are consistent with the results of Richards et al. (1971). Ammonium concentrations were generally low (<1 µM), except within the pycnocline where values of 2.5 were measured (Fig. 4). Respiratory products, such as ∑CO2 and phosphate, exhibited increases across the pycnocline, then slightly increasing values with depth (Fig. 4). Maximum concentrations of ∑CO2 and phosphate were 2.59 mM and 2.3 µM respectively in the bottom waters. Values for pH mirrored the ∑CO2 profiles; pH exhibited surface values of 8.2 to 8.3 and decreased to 7.74 at depth. Dissolved manganese concentrations in the main basin increased linearly from below detection at 120 m to concentrations of. Fig. 3. Longitudinal transects through Golfo Dulce showing distribution of (a) dissolved oxygen and (b) nitrate.. Rev. Biol. Trop. (Int. J. Trop. Biol. ISSN-0034-7744) Vol. 54 (Suppl. 1): 171-191, September 2006.
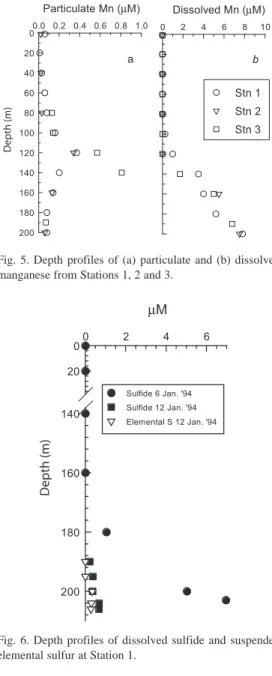
(7) Fig. 4. Depth profiles of (a) phosphate; (b) ∑CO2; and (c) ammonium concentrations from Stations 1, 2 and 3.. 8 to 9 µM at the sediment water interface (Fig. 5). Particulate manganese concentrations peaked at the 120 m depth (0.4 µM) at Stations 1 and 2, and at 140 m water depth (0.8 µM) at Station 3. Neither dissolved nor particulate iron were detectable in the water column (<0.5 µM). Dissolved sulfide concentrations were <1 µM in most of the water column. The only exception was for the samples taken from below the depths of 180 m on the first day (January 6, 1994) at Station 1, where concentrations increased from 1 µM at 180 m to nearly 7 µM at 203 m. However, within six days (January 12, 1994) concentrations of dissolved sulfide decreased to <1 µM within the bottom 10 m of water at Station 1. At this later date we determined sulfur intermediates in the bottommost 10 m of the water column at Station 1, finding filterable elemental sulfur concentrations of 0.30 µM and thiosulfate concentrations in the range of 0.16 to 0.19 µM (Fig. 6). Microbiological observations. The microbiological investigations revealed some zonation of the Golfo Dulce water column. Total microbial cell counts and the average cell size of individual cells are shown in Figure 7. Total cell counts, based on the EtBr and DAPI stains, were in the range of 105 - 106 cells mL-1 with no significant difference between the results from the two stains. Cell numbers decreased ~3-fold from the surface through the pycnocline, while deeper counts were remarkably constant with only a slight increase with depth. The Bacterial probe 338F only stained 1 - 20 % of all cells.. Fig. 5. Depth profiles of (a) particulate and (b) dissolved manganese from Stations 1, 2 and 3.. Fig. 6. Depth profiles of dissolved sulfide and suspended elemental sulfur at Station 1.. Below the pycnocline, larger percentages of all cells (i.e., > 10%) were stainable in the region between 80 and 120 m and just above the sediment surface at 204 m (Fig. 7). Cell volume estimates using the Bacterial 338F probe (Fig. 7) resembled the DAPI cell volume estimates (not shown). In both cases, the average cell volume peaked at the 100 m depth and again near the sediment surface. The dispersion of cells at certain water depths was. Rev. Biol. Trop. (Int. J. Trop. Biol. ISSN-0034-7744) Vol. 54 (Suppl. 1): 171-191, September 2006. 177.
(8) Fig. 7. Cell counts showing (a) cell density from EtBr and DAPI counts and (b) cell volumes and relative number of cells stained with the Bacterial FISH-probe 338F. The continuous line is the best fit of a spline through the average cell counts of DAPI and EtBr stained cells. Golfo Dulce, 1994.. consistent with the microscopic observations. Cells were noticeably more clumped at 100 m (and to a slightly lesser extent at 120 m) when compared to the very well dispersed cells observed at 60 m. As reported by Kuever et al. (1996), direct phase-contrast microscopy also showed that the abundances of bacteria and phytoplankton decreased with increasing depth into the pycnocline. Below 40 m and down to 200 m, very little was observed microscopically except for a layer of amorphous, detrital material between 100 and 120 m depth. Near the sediment-water interface at 204 m depth, however, several large bacteria with large, light-reflecting inclusions of elemental sulfur were observed, including 20-30 µm long motile spirilloids and a large, motile ovoid form (up to 20 µm diameter) that were identified as Aquaspirillum bipunctata and Thiovulum majus, respectively (Kuever et al. 1996). In the surface fluff layer of the sediments at Station 160 (163 m), large (1.5 mm long and up to 80 µm diameter), vacuolated, sulfur-containing, filamentous bacteria belonging to the genus Beggiatoa were observed.. 178. MPN counts of aerobic sulfur-oxidizing bacteria indicated abundances of 102-105 cells mL-1 throughout the anoxic water column, while denitrifying, sulfur-oxidizing bacteria did not exceed 102 cells mL-1 (Kuever et al. 1996). Non-sulfur-accumulating sulfur-oxidizing bacteria resembling Thiobacillus and Thiomicrospira were also isolated by autotrophic growth under aerobic conditions on hydrogen sulfide, elemental sulfur, thiosulfate and tetrathionate. These isolates did not use nitrate as an electron acceptor. Respiration rates in water and sediment: Rates of oxygen consumption were greatest in the surface waters at 60 µmol L-1 d-1 and decreased to values below 10 µmol L-1 d-1 in the pycnocline (Thamdrup et al. 1996). A secondary peak of 4 µmol L-1 d-1 was observed at 60 m. Below 60 m oxygen consumption was not detectable. The integrated oxygen consumption rate through the pycnocline and into the deep basin (40 - 80 m) was 52 mmole m-2 d-1. Rates of denitrification throughout the water column, as measured using the 15N isotope pairing technique, fell below detection limits. Rev. Biol. Trop. (Int. J. Trop. Biol. ISSN-0034-7744) Vol. 54 (Suppl. 1): 171-191, September 2006.
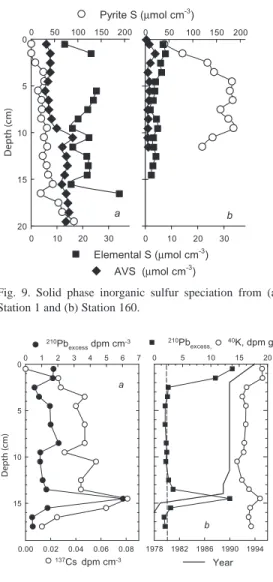
(9) (DL = 0.02 µmol L-1 d-1). In one sample from 204 m depth, 15NO3- was converted to N2 at a rate of 0.15 µmol L-1 d-1. Because no nitrate or nitrite was detected at this depth, and the entire N2 production was recovered as 14N15N, the production could not be due to denitirification, which should produce (15N)2 in the absence of 14NO - and oxygen (Nielsen 1992). As detailed 3 in the Discussion, such skewed isotope signatures may be due to the anammox process. Similar to denitrification, sulfate reduction rates measured at two bottom water depths (200 and 204 m) were not distinguishable from blank values (detection limit <0.011 µmol L-1 d-1). In two sediment cores from Station 1, 15NO - was converted to N at rates of 0.09 3 2 and 0.13 mmol N m-2 d-1. No native nitrate was detected in the water above the cores, and, similar to the bottom water sample, denitrification was expected to produce (15N)2 (Nielsen 1992). In partial analogy to the bottom water sample, however, 30 – 50% of the label that had been transformed was recovered as 14N15N, indicating the involvement of another nitrogen pool in N2 production. As discussed below, anammox activity provides a likely explanation of these observations, while both denitrification and anammox were likely inhibited in situ by the absence of nitrate (see Discussion). No 15N-incubations were performed with the surface sediments of the slope station (Station 160). Denitrification rates in two shallow, oxic sediments were previously determined to 0.28 – 0.43 mmol N m-2 d-1 (Thamdrup et al. 1996). A possible contribution from anammox at these sites cannot be extracted from the data because the nitrification at these sites is not known (cf. Risgaard-Petersen et al. 1995). Rates of sulfate reduction in Station 1 and Station 160 surface sediments (0 to 1 cm depth) were 48 – 111 and 100 nmol cm-3 d-1 respectively (Fig. 8). The two types of sulfate reduction rate incubations employed gave similar results. Areal sulfate reduction rates over the upper-most 15 cm at these two stations were 7.8 mmole m-2 d-1 for Station 1 and 2.4 mmole m-2 d-1 for Station 160. The distribution. Fig. 8. Sulfate reduction rates at Station 1 and Station 160. Different signatures indicate different types of incubation. Filled squares: whole core; open diamonds: homogenized sediment samples; open circles: 5-cm subcores.. of sulfate reduction activities was strikingly different between Station 1 and Station 160. At Station 160 the rates of sulfate reduction were highest at the surface and decreased sharply within the first five centimeters to background values of < 5 nmol cm-3 d-1. Sulfate reduction rates at Station 1 exhibited a sub-surface peak between 2 and 5 cm, but, in contrast to Station 160, rates of 30 to 50 nmol cm-3 d-1 persisted throughout 30 cm of sediment. Sedimentary Sulfur. Dissolved sulfide concentrations within the surface 15 cm of sediment at both Station 1 in the deep basin and at Station 160 on the slope were <3 µM and exhibited no distinct profile with depth. Near the sediment-water interface concentrations of dissolved H2S were <2 µM at both Station 1 and at Station 160; therefore, fluxes of dissolved sulfide to the overlying water column were calculated to be less than 0.018 mmole m-2 day-1. Solid phase sulfur distributions were, however, quite different between Station 1 and Station 160 (Fig. 9). At Station 160, AVS and elemental sulfur concentrations were low, and exhibited only small peaks of less than 4 and 8 µmole cm-3, respectively. Pyrite concentrations increased sharply before reaching a constant concentration of approximately 180 µmole cm-3 at 7 cm depth. In contrast to Station 160, AVS and elemental sulfur. Rev. Biol. Trop. (Int. J. Trop. Biol. ISSN-0034-7744) Vol. 54 (Suppl. 1): 171-191, September 2006. 179.
(10) concentrations were generally higher in the deep basin sediments of Station 1. AVS concentrations steadily increased over depth from 5 to 15 µmole cm-3 and elemental sulfur values fluctuated between 15 and 35 µmole cm-3 over the length of the core (20 cm depth). Conversely, pyrite concentrations gradually increased, and only reached concentrations of 60 to 70 µmole cm-3 by 20 cm sediment depth. Distribution of 210Pb, 137Cs, and 40K in basin sediments. The distribution of excess 210Pb (not supported by 226Ra) in the deep basin sediments (Fig. 8a) did not exhibit the typical exponential decrease of 210Pb with increasing depth that is commonly observed in steadily accumulating sediments. On a volumetric basis (after correcting for sediment porosity and density), no surface excess 210Pb peak was present and more than 27% of the total excess 210Pb activity lay in the lower 13 to 16 cm layer. 137Cs activities were congruous with those of 210Pb, peaking at the 14.5 cm depth (Fig. 10a). Normalized against gdry weight, however, the excess 210Pb distribution exhibited a surface peak of 13.8 dpm g-1, which decreased sharply to values of approximately 2 dpm g-1 by 3 cm depth. A second peak of 13.3 dpm g-1 was observed at 14.5 cm depth. The gravimetrically normalized activities of 40K in the sediments also showed a bimodal distribution with enhanced activities at the surface and in the 14 to 15 cm layer (Fig. 10b).. Discussion Biogeochemical zonation of Golfo Dulce. The survey showed that the unique water-column characteristics of Golfo Dulce reported by Richards et al. (1971) persisted 25 years later, with three distinct zones below the center of the pycnocline, which was located about 40 m depth (Fig. 2 and 3): I) a zone, located at approx. 40 – 100 m during our cruise with a steep oxygen gradient, stabilized by some density stratification, II) an anoxic and non-sulfidic but nitrate-containing zone at approx. 100 – 200 m with little density stratification, and. 180. Fig. 9. Solid phase inorganic sulfur speciation from (a) Station 1 and (b) Station 160.. Fig. 10. Sediment profiles of 210Pb and 137Cs from Station 1. Panel (a) shows the distribution of 210Pb and 137Cs per volume basis. Panel (b) shows the 210Pb (squares) and 40K (stippled curve) distribution on a per mass basis. The solid line indicates the age of the sediment (lower axis) based on the Constant Flux Model calculations.. III) waters within few meters of the sediment surface, with occasional nitrate depletion and sulfide accumulation. Zone II is further characterized by the accumulation of reduced Mn2+ (Fig. 5) and nitrite (Córdoba and Vargas 1996, Dalsgaard et al. 2003) as further indications of anoxia in this zone. The interface between Zones I and II was marked by higher concentrations of particulates. Rev. Biol. Trop. (Int. J. Trop. Biol. ISSN-0034-7744) Vol. 54 (Suppl. 1): 171-191, September 2006.
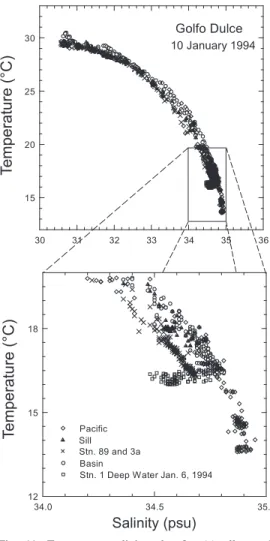
(11) (Kuever et al. 1996), some of which were most likely manganese oxides (Fig. 5), as expected at oxic/anoxic interfaces (e.g., Ramsing et al. 1996), but also aggregation of bacteria was observed. The interface was further marked by a larger average microbial cell volume and a larger percentage of the cells staining with the bacterial oligonucleotide probe 338F than at adjacent depths (Fig. 7). Both these extremes indicate increased microbial activity, as generally observed at such redox interfaces (e.g., Zopfi et al. 2001, Taylor et al. 2001). Consistent with other studies of natural microbial communities (e.g., Rosselló-Mora et al. 1999), we interpret the variations in FISH-staining percentages with the probe for Bacteria as correlated to the ribosome content of the bacterial cell, which, in turn, correlates with metabolic activity. Likewise, average cell size in natural populations may correlate with activity (Lebaron et al. 2002). With neither ammonium nor sulfide reaching the bottom of the oxic zone, Mn2+ was the only reduced species identified at the oxic/ anoxic interface as a potential substrate for the bacterial population (Fig. 5). Although Mn oxidation in many aquatic systems is microbially catalyzed, there is as yet no documentation of manganese oxidation as the basis of bacterial energy metabolism (e.g., Tebo et al. 1997). Alternatively, the population could be fuelled by dissolved organic matter that is more easily metabolized during oxygen respiration than during anaerobic metabolism and could be supplied to the interface from the deeper basin. Near-bottom sulfide concentrations varied on a timescale of days (Fig. 6; see also Richards et al. 1971), and the interface between Zones II and III is thus less stable than the Zone I-II interface, and at times may impinge on the sediment. In addition to the flocculent sediment itself, patches of coconut debris on the basin floor (Nicholls-Driscoll 1976), degrading through bacterial sulfate reduction, may also serve as a heterogeneously distributed source of sulfide (Thamdrup et al. 1996). Despite the temporal and possibly spatial heterogeneity of the Zone II-III interface, larger. cells and a higher bacterial staining percentage were found in the bottom water, in analogy to the transition between Zones I and II (Fig. 7). As documented by microscopy, large motile bacteria tentatively identified as Aquaspirillum sp. and Thiovulum sp. contributed to these observations, and sulfur inclusions indicated that these organisms carried out sulfide oxidation (Kuever et al. 1996). These motile organisms seem well-adapted to follow the excursions of the interface. Also other sulfide-oxidizers were isolated from this depth. Curiously, neither Aquaspirillum nor Thiovulum are known to oxidize sulfide anaerobically, e.g. with nitrate, and the isolates were also not capable of nitrate reduction. Thus, it is possible that the sulfide oxidizers utilize pulses of slightly oxygenated water entering over the sill, as discussed below, but we cannot exclude that sulfide oxidation coupled to nitrate reduction is an important metabolism for the bottom-water community. Also ammonium, present at > 100 µM at 1 cm depth within the sediment (Thamdrup et al. 1996) but hardly detectable in the water column (Fig. 4; Dalsgaard et al. 2003), could be a substrate for nitrifyers or anammox bacteria in this interface community. Central questions for understanding the unique biogeochemical zonation of Golfo Dulce, concern the rate of exchange with the ocean outside and importance of various processes involved in the biogeochemical cycling within the basin. Full answers to these questions require frequent sampling during at least one annual cycle. Below, however, we provide first estimates of the water budget and we evaluate the major biogeochemical processes at play in the basin. Frequency of deep-basin renewal and oxygen demand. Richards et al. (1971) suggested that the Golfo Dulce basin waters are renewed on a regular basis. Consistent with their suggestion, plots of temperature vs. salinity (Fig. 11) from our cruise also indicate that the basin waters below 180 m undergo exchange on a relatively frequent basis. An exploded view of the T-S plot (Fig. 11) illustrates the changes. Rev. Biol. Trop. (Int. J. Trop. Biol. ISSN-0034-7744) Vol. 54 (Suppl. 1): 171-191, September 2006. 181.
(12) in bottom water T-S characteristics over time. The entire basin including the sill area and two stations outside the bay were surveyed on January 10, 1994. Additionally, the water column at Stations 1, 2 and 3 had been surveyed with the CTD four days prior on January 6, 1994. The waters below 180 m from January 6 exhibit T-S characteristics that are quite distinct from the survey four days later. The January 6 deep waters T-S properties, shown in Figure 11 by the squares, lie on a separate mixing line from the overlying water. Over the course of four days, the bottom water mass had become sufficiently mixed with the overlying waters to erase the earlier bottom water T-S signature. During this time, near-bottom H2S (Fig. 6) disappeared and Córdoba and Vargas (1996) independently measured increased concentrations of 10 µM O2 and up to 20 µM nitrate at depths below 100 m. A simple salt balance can be used to estimate the rate of bottom water renewal in Golfo Dulce, where the inflow of water into the deep basin from the Pacific, Qp, is balanced by upwelling, Qw. The outflow of surface water from Golfo Dulce, Qs, is in turn also balanced by upwelling, Qw, and by the freshwater input from run-off, Qr. Thus, for the water balance: Qp = Qw = Qs - Qr (3). and for a salt balance we can therefore write, QsSs = QrSr + QpSp (4). where, Ss, Sr, and Sp are the salinities of the Golfo Dulce surface, run-off, and sub-pycnocline Pacific respectively. Solving for Qs we get: Qs = SpQr - QrSr/(Sp - Ss) (5). and thus, Qp = Qs - Qr (6). The run-off flow can be estimated knowing the annual rainfall to the Golfo Dulce basin and. 182. Fig. 11. Temperature-salinity plot for (a) all samples and (b) bottom water samples. With the exception of the January 6, 1994 bottom water samples all points are from January 10, 1994. Samples are further distinguished by location (Basin: Stations 1, 1a, 2, 2a, and 3 in the main portion of the Golfo Dulce basin; Stations 3a and 89; Sill: Station 11; and Pacific: Stations 11a and 12).. the catchment area. We assume that the concentration of salt in the run-off water equals zero. For a catchment area of 2 050 km2 and a mean annual rainfall of 300 to 500 cm a-1 (Wolff et al., 1996) Qr should fall between 6.2 and 10.5 x 10⁹ m3 a-1. This gives an annual flux of 7.7 - 13.3 x 10¹⁰ m3 a-1 inflow across the sill and a residence time of water in the deep basin between 34 to 57 days. Estimates of oxygen fluxes illustrate the importance of lateral transport of water and. Rev. Biol. Trop. (Int. J. Trop. Biol. ISSN-0034-7744) Vol. 54 (Suppl. 1): 171-191, September 2006.
(13) oxidants (oxygen and nitrate) over the sill and into the deep Golfo Dulce basin versus fluxes due to vertical eddy diffusion. Dividing the oxygen deficiency of the deep Golfo Dulce basin (>40 m) relative to the sub-pycnocline Pacific oxygen concentrations by the water residence time, we calculate an oxygen consumption rate of 61 - 206 mmole m-2 d-1. This value is within the same range as the oxygen demand determined from the integrated rates of oxygen consumption between 40 and 80 m (52 mmole m-2 d-1), but is significantly higher than the estimated vertical eddy diffusive flux of oxygen across the pycnocline at Station 1 (0.19 mmole m-2 d-1; Kz of 0.003 cm2 s-1; Fig. 2). Although the pycnocline severely restricts the vertical, eddy-diffusive exchange of oxygen into the deep basin, the deep basin is by no means stagnant. Horizontal, advective exchange of sub-pycnocline Pacific water over the sill, as originally proposed by Richards et al. (1971) and further substantiated in this study, serves to maintain the sub-oxic conditions of the Golfo Dulce deep basin. Controls on sulfide in the anoxic basin: We propose that advective flow of sub-pycnocline water, containing oxygen and nitrate, over the sill and into the deep basin in concert with the deposition of iron-rich turbidite layers in the deep basin, acts to restrict the build-up of dissolved sulfide in the bottom waters of Golfo Dulce to concentrations not exceeding 10 µM. We demonstrate below that the continual addition of iron-rich sediments to the deep basin floor helps to “scrub-out” sulfide from the sediment. What sulfide does escape the sediment is then oxidized by inputs of oxygen and nitrate from over the sill. Sedimentary sulfur budget. The deep basin sediments consist of repeated sequences of upwardly fining turbidites and exhibit a much greater accumulation of material on the basin floor than on the relatively steep sides of slope (Hebbeln et al. 1996). The capacity of the sediments for removing dissolved sulfide produced from ongoing sulfate reduction depends on the frequency and extent of turbidite deposition and on the amount of reactive. iron present in the turbidite sediments. The average concentration of iron in the dithionite and anoxic oxalate extractions of the turbidite sediments were 144 µmole cm-3 and 274 µmole cm-3 respectively. These extractions include iron in the form of iron oxides plus some sheet silicate Fe, and quantify the fraction of Fe that reacts rapidly with hydrogen sulfide (Canfield et al. 1992). These reactive iron concentrations in Golfo Dulce sediments are high when compared to other continental margin sediments (e.g. < 50 µmole cm-3 for Danish coastal sediments; Thamdrup et al. 1994). X-radiography of Station 1 sediment cores indicated that the youngest turbidite here, underlying 2 – 4 cm of fluff at the surface, was ~13 cm thick (Thamdrup et al. 1996). The timing and magnitude of this most recent turbidite event may be estimated from the 210Pb and 137Cs distributions at Station 1 (Fig. 8). In sediments receiving steady fluxes of particulates and 210Pb, the distribution of 210Pb typically follows an exponential decrease from the surface and can be represented by a model that includes downward mixing due to bioturbation and downward sediment velocity due to steadystate sediment accretion. In contrast, the profile from Station 1 shows a distinct peak at the 1415 cm depth (Fig. 8). Over 27% of the 226Raunsupported 210Pb activity may be found in this single layer. Furthermore, a peak of 137Cs, which is usually attributed to atmospheric fallout resulting from aboveground nuclear testing (peak in 1963) and the Chernobyl accident (1986), is also observed in the same layer. In turbiditic sediments, where the flux of 210Pb to the surface may be constant but the sedimentation rate is episodic, the Constant Flux Model (Robbins 1978) may be employed. In this model the age of any given layer can be estimated from the following relationship: t = 1/l•ln(Gz/G0) (7). where: t= age of bottom of layer z in years Gz= inventory of 210Pbexcess below depth z G0= total inventory of 210Pbexcess in sediment l= decay rate constant for 210Pb = 0.311 a-1. Rev. Biol. Trop. (Int. J. Trop. Biol. ISSN-0034-7744) Vol. 54 (Suppl. 1): 171-191, September 2006. 183.
(14) G0 represents the 210Pb activity supplied to the basin via atmospheric fallout and not carried into the basin with the turbidite. This “background” 210Pbexcess associated with the turbidite can be estimated by examining the gravimetrically normalized (rather than volumetrically as in Figure 8a) activity of 210Pbexcess sediment (Fig. 8b). Although, volumetrically there is little total 210Pbexcess in the surface, gravimetrically normalized 210Pbexcess shows a strong enrichment of 210Pbexcess that corresponds to the slow sedimentation of 210Pbexcess-enriched particles to the basin floor. Likewise, and for the same reasons, the layer at 14-15 cm is also enriched in 210Pbexcess when examined on a gravimetrically normalized basis. Conversely, the sediment layers between this surface enrichment and the base of the turbidite (14-15 cm) represent radiometrically “old” turbidite 210Pbexcess values that overlie a “younger” layer of high 210Pb excess activity. Gravimetrically normalized 40K values also exhibit distinct differences between the peak 210Pbexcess activity layers and the turbidite layer suggesting that these layers are from dissimilar sources. We expect that the lower 40K contents, as a proxy for K (0.0118% of K is ubiquitously present as 40K) reflect the more highly weathered soils contained in a turbidite, as K is a minor component of feldspars and easily weathered from moist, tropical soils (Matthes 1987). Accordingly we have subtracted the 210Pbexcess cpm cm-3 between 2 and 13 cm from the total inventory (G0) assuming that this represents 210Pbexcess associated with the turbidite matrix. The results of the Constant Flux Model, shown in Figure 8b, indicate that the most recent turbidite sequence was deposited as recently as 1992 and not earlier than 1989. Thus, we can assume that, within the last 2 to 5 years before sampling, approximately 12 to 14 centimeters of iron-rich weathered soil or sediment were suddenly deposited on the basin floor. Moreover, that the 137Cs peak falls below 14 cm, is consistent with the oldest estimated date of turbidite deposition (1989). A sulfur budget can be constructed for the turbidite layer based on the inventories of total reduced inorganic sulfur (TRIS), the integrated. 184. sulfide production (sulfate reduction) within the layer, and the timing of this most recent turbidite sequence. As shown in Table 1, the turbidite layer has retained 59 to 100% of the sulfide produced as solid phase reducible iron species, such as pyrite, AVS, and elemental sulfur. Thus, the frequent deposition of iron-rich turbidites can effectively remove dissolved sulfide from the pore waters, thereby attenuating the flux of dissolved sulfide to the Golfo Dulce bottom waters and its subsequent demand on oxygen and nitrate. Table 1 Sulfur balance for the 12 cm thick turbidite layer at Station 1 Total Reduced Inorganic Sulfur (TRIS) Elemental Sulfur Pyrite Sulfur Acid Volatile Sulfur TRIS Sulfide produced from Sulfate Reduction in turbidite (SRR integrated = 6.3 mmol m-2 d-1) × (Age of turbidite layer = 2 - 5 years) =. mol m-2 2.6 3.0 1.1 6.7. 4.6 - 11.4. Water-column sulfide oxidation. Assuming, based on the preceding calculations, that 80% of the sulfide is precipitated and removed as TRIS compounds, oxidation of the remaining hydrogen sulfide produced through sulfate reduction within the surface sediment is equivalent to the consumption of 2.6 mmole O2 m-2 d-1. This represents less than 5% of the total sub-pycnocline oxygen demand, and a similar small fraction of the DIN loss may be attributed to sulfide oxidation, if nitrate rather than oxygen is the electron acceptor. There is no evidence for bioturbation of the surface sediments (Nichols-Driscoll 1976, Thamdrup et al. 1996), which would facilitate the reaction of sulfide and oxygen. During the cruise neither oxygen nor nitrate was detected in the deepest water at Station 1, but there were indications that these compounds serve as oxidants for sulfide escaping the sediment. Thus, the presence of sulfide oxidation products in the bottom-most waters. Rev. Biol. Trop. (Int. J. Trop. Biol. ISSN-0034-7744) Vol. 54 (Suppl. 1): 171-191, September 2006.
(15) (>200 m) such as elemental sulfur and thiosulfate can be attributed to mixing of sulfidic and oxygenated waters (Zhang and Millero 1993, Zopfi et al. 2001), although bacterial oxidation, aerobic or anaerobic, cannot be excluded as the source of the nanomolar levels observed. As pointed out earlier, microscopic observations and bacterial isolations of sulfur-oxidizing bacteria suggest that the oxidation of sulfide is to some extent mediated by sulfide-oxidizing microaerophilic bacteria at the sediment-water interface or within the overlying water column. Species of sulfur bacteria isolated from water depths of 204 m, such as Thiovulum spp., Thiobacillus spp., and Thiomicrospira spp., oxidize sulfide to elemental sulfur and eventually to sulfate in the presence of low oxygen concentrations. Thiovulum spp. are particularly motile, and could take advantage of the frequent influxes of oxygenated water into the deep basin (Garcia-Pichel 1989). Sub-horizontal injections of slightly oxygenated waters into otherwise anoxic water layers have also been indicated as an important source of oxidant in other anoxic basins, and contribute to the maintenance of anoxic, nonsulfidic layers in the Black Sea and the Cariaco Basin (Zopfi et al. 2001, Scranton et al. 2001, Konovalov et al. 2003). In addition to the reaction with oxygen, a coupling of sulfide oxidation to denitrification has been indicated by marked increases in denitrification rates close to the basin floor (Dalsgaard et al. 2003). Another coupling of sulfide oxidation to nitrate reduction may be represented by the large, vacuolated, Beggiatoa sp. observed at the surface of Station 160 sediments on the slope of the Golfo Dulce basin. McHatton et al. (1996) have reported on similar, vacuolated Beggiatoa mats at Monterey Canyon cold seeps. These vacuolated species of Beggiatoa are able to concentrate nitrate 3000 to 4000 fold over ambient levels in their vacuoles, much in the same manner as the closely related Thioploca species accumulate nitrate internally from anoxic, upwelling waters off the coast of Chile (Fossing et al. 1995). The nitrate concentrating Beggiatoa. spp. are autotrophic and, like their near relatives Thioploca spp., presumably couple sulfide oxidation with nitrate reduction to ammonium (Otte et al. 1999). Unfortunately, at the time of sampling, the ability of such bacteria to concentrate nitrate had not yet been discovered and their distribution in the Golfo Dulce sediments was not pursued. However, such nitrate-reducing bacteria may play a greater role in sulfide oxidation in the sediments on the upper slope where nitrate concentrations are higher. Importance and pathways of nitrogen cycling: In between the pycnocline and the sulfate reduction dominated sediments lie 160 meters of water column where fixed nitrogen appears to be lost. Like Richards et al. (1971) in 1969, we observed that nitrate decreased with depth below the pycnocline in Golfo Dulce (Fig. 3) without a concurrent increase in the concentration of ammonium (Fig. 4c). Note also that the DIN gradients are not coincident with the steep gradients of C and P and O2 observed in the pycnocline (Figs. 3 and 4). We calculated a DIN deficit for January 1994 by taking the difference between the actual subpycnocline inventory of DIN in Golfo Dulce below 60 m at Station 1 and the inventory of DIN had the water column been completely replaced by water flowing from the Pacific (23 µM). This resulted in a DIN deficit of 2.9 mole DIN m-2. For comparison, Richards et al. (1971) calculated a DIN deficit of 4.6 mole DIN m-2. Given our estimate of the DIN deficit and the water residence time of 35 - 57 days, we calculate that the rate of DIN loss is 51- 85 mmole m-2 d-1. The estimates of consumption of various electron acceptors in the remineralization of organic carbon in the Golfo Dulce water column and sediments is compiled in Table 2. Aerobic respiration dominates the remineralization of organic carbon in the euphotic zone and pycnocline as manifested by the high rates of oxygen consumption at the surface and by sharp gradients in N, P and ∑CO2 across the pycnocline (Fig. 4). Below the pycnocline (>40 m), oxygen consumption is 4 - 14 fold lower (Table 2). This oxygen. Rev. Biol. Trop. (Int. J. Trop. Biol. ISSN-0034-7744) Vol. 54 (Suppl. 1): 171-191, September 2006. 185.
(16) Table 2 Estimated and measured rates of nitrogen, carbon, and oxygen consumption in the Golfo Dulce water column and sediments at Station 1. See text for details mmol N m-2 d-1. Nitrogen Dissolved Inorganic Nitrogen (DIN) loss (based on 2.9 mol m-2 DIN deficit and 35 - 57 d water residence time) DIN loss to possible sulfide oxidation Denitrification (measured) Water column (Dalsgaard et al. 2003) Sediment Anammox (Dalsgaard et al. 2003). 1.9 - 2.1 79 - 266 0.1 42 - 61. mmol O2 m-2 d-1. Oxygen Measured oxygen consumption Euphotic zone (0 - 40 m) Pycnocline/Sub-pycnocline (> 40 m) Sub-pycnocline oxygen consumption (> 40 m) (based on O2 deficit and 35 - 57 day water residence time) Sulfide Oxidation Manganese Oxidation. consumption is not necessarily attributable to aerobic heterotrophic respiration, but may also be coupled to the oxidation of ammonium and sulfide. Sulfate reduction represents between 9 to 20% of anaerobic respiration (DIN loss plus sulfate reduction) and <3% of the total organic carbon degradation (Table 2), although sulfate reduction dominates sedimentary organic carbon degradation. As discussed previously, the oxidation of sulfide accounts for <5% of the total oxygen supply to the deep basin. Rates of DIN loss are only slightly lower than the rates of oxygen consumption for the sub-pycnocline zone (Table 2). In the following discussion we explore possible mechanisms leading to the DIN deficit and their implications for nitrogen, oxygen, sulfur, and organic carbon cycling. Richards et al. (1971) attributed the DIN deficiency to denitrification. We did not detect denitrification in the water column (depthintegrated detection limit 2 mmol m-2 d-1). Some denitification may occur in the basin sediments, as demonstrated by the production of N2 from nitrate added to cores from Station 1. However, the rate of N2 production from 15N 186. 51 - 85. 737 52 61 - 206. 1.0 - 2.6 > 0.0096. accounted for < 1% of the calculated DIN loss, and because native nitrate was not detected in the bottom water, denitrification cannot have been active in situ at Station 1. Benthic denitrification may be active on the slopes of the basin, and in the basin floor at times when nitrate reaches deeper. However, even if the entire sediment respiration were coupled to denitrification, rather than sulfate reduction, benthic denitrification would contribute little to the calculated DIN loss (16 mmol C m-2 d-1 oxidized through sulfate reduction is equivalent to denitrification of 13 mmol N m-2 d-1). Thus, at first sight, our results seem to exclude denitrification as the major DIN sink, and to call for more exotic pathways of N cycling in Golfo Dulce. However, recent investigations in the basin provide an explanation to our observations, and reinstall water-column denitrification as a major DIN sink together with the recently discovered anammox process. Based on a 15Nassay similar to ours, Dalsgaard et al. (2003) observed both denitrification and anammox throughout the anoxic water column at two stations close to our Stations 2 and 3 in November. Rev. Biol. Trop. (Int. J. Trop. Biol. ISSN-0034-7744) Vol. 54 (Suppl. 1): 171-191, September 2006.
(17) 2001. Production of 15N-labelled N2 from 15NO - was first detected after a lag-phase of 3 15 – 40 h, which was explained as the time required for a substantial build-up of 15N in the intermediate pool of nitrite present at concentrations up to 2 µM. Nitrite is a free intermediate during denitrification (e.g., Zumft 1997). Because nitrite was also present in the bottom water during our cruise (Cordóba and Vargas 1996), it is likely that our 12 h incubations were too short to detect N2 production from the added 15N-nitrate label. Consistent with this conclusion, we did observe 15N-nitrate reduction in the water sample from 204 m depth, where native nitrate and nitrite were depleted. The isotopic composition of the N2 formed in this sample, 14N15N only, was, however, not consistent with denitrification, and also in the sediment incubations, the pattern of isotope pairing deviated from that expected for denitrification. Instead these results suggest anammox activity. While the pairing of isotopes in N2 formed through denitrification is random (Nielsen 1992), anammox produces N2 through a 1:1 pairing of nitrogen atoms in nitrite and ammonium (van der Graaf et al. 1997). Nitrite may be produced from nitrate reduction by denitrifiers, other bacteria, or possibly by the anammox bacteria themselves. Thus, the formation of 14N15N in incubations with bottom water or sediments in which 14NO3- was not present, is consistent with the pairing through anammox of 15N from added nitrate and 14N from ammonium produced from organic matter mineralization (Thamdrup et al. 2002). Ammonium is efficiently scavenged to very low levels by the anammox bacteria (Dalsgaard et al. 2003). As an alternative explanation, the source of 14N for 14N15N production could be intracellular pools in, e.g., Beggiatoa filaments such as those observed in masses at 160. Thus, further proof of anammox activity should include the production 15N-labeled N2 from added 15NH4+ (Thamdrup et al. 2002, Dalsgaard et al. 2003). In 2001, the integrated rate of water-column N2 production from denitrification and anammox was 327 and 121 mmol N m-2 d-1 at. locations near Stations 2 and 3, respectively, with contributions from denitrification of 81% and 65% (Dalsgaard et al. 2003). This loss corresponds to 1.5 – 4 times our upper estimate of DIN loss, which is within the conceivable range of seasonal and year-to-year variation in the rate of the water column processes. Thus, the two microbial processes appear to be the major sinks of DIN in the Golfo Dulce basin. The occurrence of anammox further explains the absence of ammonium in the deeper waters of the basin (Dalsgaard et al. 2003). More than twenty years elapsed since Golfo Dulce was visited by Richards et al. (1971) aboard the R/V Thomas G. Thompson, with the aim of understanding the controls of the anoxic water column biogeochemistry, and our visit. We have used a combined approach of chemical measurements, rate determinations, and microbiology to examine in greater detail the controls on the sulfide concentration in the deep basin and the regulation of the apparent dissolved inorganic nitrogen deficit in the sub-pycnocline waters. The controlling feature of Golfo Dulce is the conduit between sub-pycnocline waters of the deep basin of Golfo Dulce and the low oxygen, nitrate-rich, upwelling waters of the Pacific. Our estimates of water exchange between the Golfo Dulce deep basin and the Pacific, based on a simple salt balance, suggest that the deep basin hydraulic residence time is on the order of one to two months. Nearly equimolar concentrations of oxygen and nitrate are delivered over the sill and are consumed to completion within the deepest waters at the head of the bay. The loss of dissolved inorganic nitrogen can be attributed to denitrification and anammox in the water column, while benthic processes are minor sinks. Sulfide oxidation, whether mediated by nitrate or oxygen reduction, plays only a minor role in either of the DIN or oxygen budgets. Conversely, the sporadic influxes of oxygen and nitrate over the sill keep the sulfide concentrations from increasing beyond concentrations of 10 µM. Both oxidants are indicated to be directly involved in the oxidation of. Rev. Biol. Trop. (Int. J. Trop. Biol. ISSN-0034-7744) Vol. 54 (Suppl. 1): 171-191, September 2006. 187.
(18) bottom-water sulfide based on distributions of intermediates of sulfide oxidation, microaerobic sulfur bacteria, and denitrification rates. In addition to oxidation of sulfide within the water column, inputs of iron-rich turbidites to the sediments on decadal time-scales, remove a significant fraction of dissolved sulfide from sediment pore waters, thus reducing the flux of dissolved sulfide to the overlying water column. In turn, low sulfide fluxes and low sulfide concentrations in the water column may allow for nitrification pathways to more fully proceed as sulfide is a strong inhibitor of nitrification (Henriksen and Kemp 1988). The Golfo Dulce water column is in a unique equilibrium that allows the maintenance of a deep sub-oxic, but not sulfidic hypolimnion, where nitrogen cycling plays a dominant role. This situation is principally regulated by the continual inputs of oxygen and nitrate from sub-pycnocline Pacific upwelling waters. Until recently, the Golfo Dulce basin has existed as a relatively remote, isolated marine ecosystem. The biogeochemical structure of the water column observed in this study was essentially unchanged from when Richards et al. (1971) visited in 1969, and very similar results were obtained again in November 2001 (Dalsgaard et al. 2003). However, with expanding landuse pressures on the area (e.g., tourism) it will be interesting to observe whether Golfo Dulce retains the same distinguishing biogeochemical characteristics over the next decades.. Acknowledgments We thank José A. Vargas (CIMAR-UCR, Costa Rica) and Matthias Wolff (ZMT, Bremen, Germany), who organized the R/V Victor Hensen Costa Rica Expedition 1993/1994, and who graciously assisted in making our trip possible and productive. We thank the Captain and crew of the F/S Victor Hensen for their. 188. fine support. K. Neumann, D. Ganzhorn, and A. Glud provided skilful technical assistance in the laboratory. We acknowledge J. Gundersen for his enthusiastic help aboard the ship, N. Hussain for the 210Pb analysis, and J. Zopfi for a helpful discussion. This project was supported by the Max-Planck-Society. RESUMEN En el Golfo Dulce, que es un pequeño ecosistema marino anóxico tropical en Costa Rica, se evaluaron, en la columna de agua y los sedimentos, las distribuciones de parámetros químicos, las tasas de respiración, y las distribuciones de bacterias, con el propósito de examinar los controles biológicos de la anoxia, sulfuro, nitrógeno inorgánico disuelto y consumo de carbón orgánico. Tal como fue informado en otros estudios, la columna de agua más profunda de 100 m es anóxica y las concentraciones de sulfuro en las aguas de fondo fue menor a 7 µM (y en forma transitoria). Tanto las bacterias nadadoras libres oxidadoras de sulfuro, como Beggiatoa sp. (con grandes vacuolas) fueron observadas en las aguas anóxicas del fondo o en la interfase agua-sedimento. La respiración aeróbica dominó la descomposición de la materia orgánica en las aguas superficiales y en la picnoclina, mientras que la reducción del sulfato estuvo restringida a los sedimentos. La distribución de las bacterias fue en zonas discretas en la zona anóxica y exhibió las densidades más grandes donde el oxígeno decreció por debajo de 1µM alrededor de los 100m de profundidad, y cerca de la interfase agua-sedimento. La columna de agua bajo la picnoclina fue sub-óxica y caracterizada por un déficit de nitrógeno inorgánico disuelto (DIN) de 2.9 mol.m-2. Con un tiempo de residencia de 35 a 57 días, estimado a partir del balance de sal, este déficit corresponde a una pérdida de DIN de 51-85 mmol.m-2.d-1, comparable con el consumo de oxígeno en la sub-picnoclina. El sulfuro en la columna de agua fue mantenido a concentraciones bajas por la frecuente entrada de agua con oxígeno proveniente del Océano Pacífico. La producción de sulfuro en los sedimentos debida a la reducción bacterial del sulfato fue entorpecida por la frecuente deposición de turbiditas ricas en hierro. Con base en la distribución de 210P, se calcula que la más reciente llegada de turbiditas a los sedimentos de la cuenca tuvo lugar entre 1989 y 1992. Palabras clave: anoxia, anammox, sedimentos marinos, procesos microbiológicos, denitrificación, reducción del sulfato, Golfo Dulce, Costa Rica.. Rev. Biol. Trop. (Int. J. Trop. Biol. ISSN-0034-7744) Vol. 54 (Suppl. 1): 171-191, September 2006.
(19) References Amann R.I., B.J. Binder, R.J. Olson, S.W. Chisholm, R. Devereux & D.A. Stahl. 1990. Combination of 16S rRNA-targeted oligonucleotide probes with flow cytometry for analyzing mixed microbial populations. Appl. Environ. Microbiol. 56: 1919-1925.. Hall P.O.J. & R.C. Aller. 1992. Rapid, small-volumne, flow injection analysis for ∑CO2 and NH4+ in marine and freshwaters. Limnol. Oceanog. 37: 1113-1119. Hebbeln, D., D. Beese & J. Cortés. 1996. Morphology and sediment structures in Golfo Dulce, Costa Rica. Rev. Biol. Trop. 44 (Suppl. 3): 1-10.. APHA (American Public Health Association). 1992. Standard Methods for the Examination of Water and Wastewater. APHA, Washington, D.C., U.S.A. 1150 p.. Henriksen, K. & W.M. Kemp. 1988. Nitrification in estuarine and coastal marine sediments, in nitrogen cycling in coastal marine environments, p 207-249. In T.H. Blackburn & J. Sørensen, (eds). J. Wiley, New York, New York, USA.. Canfield, D.E., R. Raiswell & S. Bottrell. 1992. The reactivity of sedimentary iron minerals toward sulfide. Amer. J. Sci. 292: 659-683.. Ingvorsen, K. & B.B. Jørgensen. 1979. Combined measurement of oxygen and sulfide in water samples. Limnol. Oceanog. 24: 390-393.. Canfield, D.E., B. Thamdrup & J.W. Hansen. 1993. The anaerobic degradation of organic matter in Danish coastal sediments: Iron reduction, manganese reduction, and sulfate reduction. Geochim. Cosmochim. Acta 57: 3867-3883.. Jørgensen, B.B. 1978. A comparison of methods for the quantification of bacterial sulfate reduction in coastal marine sediments. I. Measurement with radiotracer techniques. Geomicrobiology J. 1: 11-27.. Cline, J.D. 1969. Spectrophotometric determination of hydrogen sulfide in natural waters. Limnol. Oceanogr. 14: 454-458. Cordóba, R. & J.A. Vargas. 1996. Temperature, salinity, oxygen, and nutrient profiles at a 200 m deep station in Golfo Dulce, Pacific coast of Costa Rica. Rev. Biol. Trop. 44 (Suppl. 3): 233-236. Cutshell, N.H., I.L. Larsen & C.R. Olsen. 1983. Direct analysis of 210Pb in sediment samples: self-absorbtion corrections. Nucl. Instr. Meth. 206: 309-312. Dalsgaard, T., D.E. Canfield, J. Petersen, B. Thamdrup & J. Acuña-González. 2003. N2 production by the anammox reaction in the anoxic water column of Golfo Dulce, Costa Rica. Nature 422: 606-608. Fossing, H. & B.B. Jørgensen. 1989. Measurement of bacterial sulfate reduction in sediments: Evaluation of a single-step chromium reduction method. Biogeochemistry, 8: 205-222. Fossing H., V.A. Gallardo, B.B. Jørgensen, M. Hüttel, L.P. Nielsen, H. Schulz, D.E. Canfield, S. Forster, R. Glud, J. Gundersen, J. Küver, N.B. Ramsing, A. Teske, B. Thamdrup & O. Ulloa. 1995. Concentration and transport of nitrate by the mat-forming sulphur bacterium Thioploca. Nature 374: 713-715. Garcia-Pichel, F. 1989. Rapid bacterial swimming measured in swarming cells of Thiovulum majus. Appl. Environ. Mircrobiol. 171: 3560-3563. Gargett, A.E. 1984. Vertical eddy diffusivity in the ocean interior. J. Marine. Res. 42: 359-393.. Konovalov, S.K., G.W. Luther, G.E. Friederich, D.B. Nuzzio, B.M. Tebo, J.W. Murray, T. Oguz, B. Glazer, R.E. Trouwborst, B. Clement, K.J. Murray & A.S. Romanov. 2003. Lateral injection of oxygen with the Bosporus plume - fingers of oxidizing potential in the Black Sea. Limnol. Oceanog. 48: 2369-2376. Kuever, J., C. Wawer & R. Lillebaek. 1996. Microbiological observations in the anoxic basin Golfo Dulce, Costa Rica. Rev. Biol. Trop. 44 (Suppl. 3): 49-57. Landing, W.M., W.C. Burnett, W.B. Lyons & W.H. Orem. 1991. Nutrient cycling and the biogeochemistry of manganese, iron, and zinc in Jellyfish Lake, Palau. Limnol. Oceanog. 36: 515-525. Lebaron, P., P. Servais, A.C. Bardoux, M. Bourrain, C. Courties & N. Parthuisot. 2002. Variations of bacterial-specific activity with cell size and nucleic acid content assessed by flow cytometry. Aquat. Microbiol. Ecol. 28: 131-140. Lewis, B.L. & W.H. Landing. 1991. The biogeochemistry of manganese and iron in the Black Sea. Deep-Sea Res. 38 (Suppl. 2): S773-S803. Lord, C.J., III. 1980. The chemistry and cycling of iron, manganese and sulfur in salt marsh sediments. Ph.D. dissertation, University of Delaware, Delaware, USA. 340 p. Matthes, S. 1987. Minerologie. Springer, Berlin, Germany. McHatton, S.C., J.P. Barry, H.W. Jannasch & D.C. Nelson, D.C. 1996. High nitrate concentrations in vacuolate, autotophic marine Beggiatoa spp. Appl. Environ. Microbiol. 62: 954-958.. Rev. Biol. Trop. (Int. J. Trop. Biol. ISSN-0034-7744) Vol. 54 (Suppl. 1): 171-191, September 2006. 189.
(20) Möckel, H.J. 1984. The retention of sulphur homocycles in Reversed-Phase HPLC. Fren. Z. Anal. Chem. 318: 327-334.. Sørensen, J. 1987. Nitrate reduction in marine sediment: pathways and interactions. Geomicrobiol. J. 5: 401421.. Nichols-Driscoll, J. 1976. Benthic invertebrate communities in Golfo Dulce, Costa Rica, an anoxic basin. Rev. Biol. Trop. 24: 281-297.. Seitz H.J. & H. Cypionka H. 1986. Chemolitohtrophic growth of Desulfovibrio desulfuricans with hydrogen coupled to ammonification of nitrate or nitrite. Arch. Microbiol. 146: 63-67.. Nielsen, L.P. 1992. Denitrification in sediment determined from nitrogen isotope pairing. FEMS Microbiol. Ecol. 86: 357-362. Otte, S., J.G. Kuenen, L.P. Nielsen, H.W. Paerl, J. Zopfi, H.N. Schulz, A. Teske, B. Strotmann, V.A. Gallardo & B.B. Jørgensen. 1999. Ecophysiological studies on partially purified mixed cultures of Thioploca species. Appl. Env. Microbiol. 65: 3148-3157. Ramsing, N.B., H. Fossing, T.G. Ferdelman, F. Andersen & B Thamdrup. 1996. Distribution of bacterial populations in a stratified fjord (Mariager Fjord, Denmark) quantified by in situ hybridization and related to chemical gradients in the water column. Appl. Environ. Microbiol. 62: 1391-1404. Richards, F.A., J.J. Anderson & J.D. Cline. 1971. Chemical and physical observations in Golfo Dulce, an anoxic basin on the Pacific coast of Costa Rica. Limnol. Oceanog. 16: 43-50. Risgaard-Petersen, N., L.P. Nielsen, S. Rysgaard, T. Dalsgaard & R.L. Meyer. 2003. Application of the isotope pairing technique in sediments where anammox and denitrifcation coexist. Limnol. Oceanogr. Methods 1: 63-73. Robbins, J.A. 1986. Geochemical and geophysical applications of radioactive lead. In J.O. Nriagu (ed.). The Biogeochemistry of lead in the environment, Elsevier, Amsterdam, Holland. Rosselló-Mora, R., B. Thamdrup, H. Schäfer, R. Weller & R. Amann. 1999. The response of the microbial community of marine sediments to organic carbon input under anaerobic conditions. Syst. Appl. Microbiol. 22: 237-248. Scranton, M.I., F.L. Sayles, M.P. Bacon & P.G. Brewer. 1987. Temporal changes in the hydrography and chemistry of the Cariaco Trench. Deep-Sea Res. 34: 945-963. Scranton, M.I., Y. Astor, R. Bohrer, T.Y. Ho & F. MullerKarger. 2001. Controls on temporal variability of the geochemistry of the deep Cariaco Basin. Deep-Sea Res. Part I-Oceanogr. Res. Pap. 48: 1605-1625.. 190. Stookey, L.L. 1970. Ferrozine - a new spectrophotometric reagent for iron. Anal. Chem. 42: 779-781. Taylor, G.T., M. Iabichella, T.Y. Ho, M.I. Scranton, R.C. Thunell, F. Muller-Karger & R. Varela. 2001. Chemoautotrophy in the redox transition zone of the Cariaco Basin: A significant midwater source of organic carbon production. Limnol. Oceanog. 46: 148-163. Tebo, B.M., W.C. Ghiorse, L.G. van Waasbergen, P.L. Siering & R. Caspi. 1997. Bacterially mediated mineral formation: insights into manganese(II) oxidation from molecular genetic and biochemical studies, p. 225-266. In J. F. Banfield and K. H. Nealson (eds.). Geomicrobiology: Interactions Between Microbes and Minerals. Reviews in Mineralogy. Mineralogical Society of America, Washington, D.C. Thamdrup, B., H. Fossing & B.B. Jørgensen. 1994. Manganese, iron, and sulfur cycling in a coastal marine sediment, Aarhus Bay, Denmark. Geochim. Cosmochim. Acta 58: 5115-5129. Thamdrup, B., D.E. Canfield, T.G. Ferdelman, R.N. Glud & J.K. Gundersen. 1996. A biogeochemical survey of the anoxic basin Golfo Dulce, Costa Rica. Rev. Biol. Trop. 44 (Suppl. 3): 19-33. Tiedje, J.M. 1988 Ecology of denitrification and dissimilatroy nitrate reduction to ammonium. In A. Zehnder (ed.). Biology of Anaerobic Bacteria. Wiley, New York, New York, USA.. Vairavamurthy, A. & K. Mopper. 1990. Determination of sulfite and thiosulfate in aqueous samples including anoxic seawater by liquid chromatography after derivatization with 2, 2’-dithiobis(5-nitropyridine). Environ. Sci. Tech. 24: 333-337. Van de Graaf, A. A., A. Mulder, P. de Bruijn, M. S. M. Jetten, L. A. Robertson & J. G. Kuenen. 1995. Anaerobic oxidation of ammonium is a biologically mediated process. Appl. Environ. Microbiol. 61: 1246-1251.. Rev. Biol. Trop. (Int. J. Trop. Biol. ISSN-0034-7744) Vol. 54 (Suppl. 1): 171-191, September 2006.
(21) Van de Graaf, A.A., P. De Bruijn, L.A. Robertson, M.S.M. Jetten & J.G. Kuenen. 1997. Metabolic pathway of anaerobic ammonium oxidation on the basis of 15N studies in a fluidized bed reactor. Microbiol. 143: 2415-2421. Vargas, J.A. & M. Wolff (eds.). 1996. Pacific coastal ecosystems of Costa Rica with emphasis on the Golfo Dulce and adyacent areas: a synoptic view based on the RV Víctor Hensen expedition 1993/1994, and previous studies. Rev. Biol. Trop. 44 (Suppl. 3): 1-238.. Wolff, M., H.J. Hartmann & V. Koch. 1996. A pilot trophic model for Golfo Dulce, fjord-like tropical embayment, Costa Rica. Rev. Biol. Trop. 44 (Suppl. 3): 215-231. Zhang, J.-Z. & F.J. Millero. 1993. The products from the oxidation of H2S in seawater. Geochim. Cosmochim. Acta 57: 1705-1718. Zopfi, J., T.G. Ferdelman, B.B. Jørgensen, A. Teske & B. Thamdrup. 2001. Influence of water column dynamics on sulfide oxidation and other major biogeochemical processes in the chemocline of Mariager Fjord (Denmark). Mar. Chem. 74: 29-51.. Rev. Biol. Trop. (Int. J. Trop. Biol. ISSN-0034-7744) Vol. 54 (Suppl. 1): 171-191, September 2006. 191.
(22)
(23)
Figure

+5


Documento similar
This study reports the comparative microbial ecology of the water column of Nuestra Señora del Carmen acid pit lake with the extreme acidic Río Tinto basin.. The
The present study deals with the economic and hydrological analysis of the virtual water and water footprint of the Guadiana river basin, and consid- ers the ways in which both
- Competition for water and land for non-food supply - Very high energy input agriculture is not replicable - High rates of losses and waste of food. - Environmental implications
a symptom of disconnected agricultural and sanitation policies ...74 Policy cocktails for protecting coastal waters from land-based activities 84 Pathways to improved water
In the previous sections we have shown how astronomical alignments and solar hierophanies – with a common interest in the solstices − were substantiated in the
The performance and durability of PEM fuel cells significantly depend on variations in the concentrations of hydrogen and oxygen in the gas channels, water activity in the
Increments of free and total contents of H 2 S and MeSH measured in the wines in the study after 21 days of anoxic aging
MD simulations in this and previous work has allowed us to propose a relation between the nature of the interactions at the interface and the observed properties of nanofluids:
