Colloidal PbS and PbSeS Quantum Dot Sensitized Solar Cells Prepared by Electrophoretic Deposition
16
0
0
Texto completo
(2) 1. Introduction The development of third generation solar cells overcoming the Shockley-Queisser efficiency limit for a single absorber, 31%,1 is one of the most fascinating challenges in the energy research field. In this aspect, semiconductor Quantum Dots (QDs) have shown extremely attractive properties for the development of solar cells overcoming the current limitations.2 The demonstration of efficient multiple exciton generation (MEG) process in colloidal QDs,3, 4 despite certain controversy,5 has aroused a huge interest in the use of these materials in photovoltaic devices. This interest has been reinforced with the recent reports of absorbed photon–to–current efficiency (APCE) close to 200%6 and incident photon–to–current efficiency (IPCE) as high as 114%.7 These achievements are acquired by using QDs with IR absorption, PbS6 and PbSe.7 In the former case PbS QDs have been employed in a sensitized solar cell configuration.8 Electron-hole pairs, photogenerated and produced by impact ionization in a MEG process, in PbS colloidal QDs are quickly separated into two different media. Electrons are injected into flat TiO 2 single crystals while holes are regenerated by a polysulfide electrolyte. 6 Nanostructured TiO2 electrodes, instead of flat electrodes, enhance dramatically light harvesting but two main problems have to be solved: i) the uniform sensitization with colloidal QDs of nanostructured electrode along all its thickness and ii) the development of a stable QDSC configuration with colloidal PbS QDs as sensitizers. We have addressed these problems preparing colloidal PbS and PbSeS quantum-dot sensitized solar cells (QDSCs) in a novel sensitizing way employing electrophoretic deposition (EPD) and protecting the colloidal QDs from corrosive electrolyte with a CdS coating. We have analyzed the effect of electrophoretic deposition time and QD size in the final solar cell performance, obtaining efficiencies as high as 2.1±0.2 %. These results represent a significant advance in the development of colloidal QDSCs with light absorption in the IR region. In addition, we discuss the role of QDs in the recombination process of the analyzed solar cells. Electrophoretic deposition has been used for the deposition of TiO2 nanoparticles in solar cell9 or photocatalytic10 applications. In addition, it is a method also employed to deposit colloidal QDs, especially of CdSe on different materials such Au,11,. 12. templates.. patterned electrodes,13 15. stacked-cup carbon nanotubes,14. and polymer. Colloidal CdSe QDs have also been deposited by electrophoresis for 2.
(3) photovoltaic purposes. Electrophoretic deposition of CdSe-C60 was used for the preparation of composite films for solar energy generation.. 16. Flexible QDSCs have. been fabricated by using the electrophoretic deposition of CdSe QDs on ZnO nanorods, obtaining efficiencies of 0.98%.17 Higher efficiencies, 1.7%, have been reported for TiO2 nanostructured electrodes with a ZnS coating of the colloidal CdSe QDs.18 But there is no report on the use of EPD of PbS or PbSeS QDs. Electrophoretic deposition presents a significant advantage over other deposition techniques for colloidal QDs, either as linker assisted19-21 or direct adsorbed,19, 21 because of its simplicity and short deposition time. While for electrophoretic deposition times as short as 2 h were sufficient for effective coating,18 several hours or even days are needed with other techniques.19-21 The use of PbS QDs in QDSCs has been significantly less than the utilization of CdSe QDs, in spite of the higher light harvesting potential of PbS QDs due to their tunable absorption in the IR range. This is largely due to the difficulty of finding an appropriate electrolyte for PbS in which it is stable. PbS is not stable neither with iodine nor polysulfide redox electrolytes.22-24 Thus, most of the reports on PbS QDSCs are for all-solid devices.23, 25-27 In the case of using a liquid electrolyte for hole transport in PbS QDSCs, the highest reported efficiency, 0.62%, has been reported using a Co redox electrolyte,28 at 1 sun and with PbS grown by the Successive Ionic Layer Absorption and Reaction (SILAR) method. We have shown that by employing the same deposition technique, stable QDSCs using polysulfide electrolyte can be obtained by coating the PbS QDs with CdS,29 reporting a significant efficiency of 2.36% using nanostructured TiO2 electrodes.30 Similar efficiencies have been obtained using SnO2 electrodes,31 and outstanding efficiencies of 3.82% have been obtained using TiO2 photoanodes with hierarchical pore distribution,32 employing again in both cases the SILAR growth. But, the presynthesis of colloidal QDs allows the preparation of QDs with better defined properties than QD samples prepared by SILAR. Treatment of colloidal PbS/TiO2 cells using CdS grown bySILAR method has been successfully applied before in a depleted heterojunction solar cell configuration.33 The ultrafast electron injection from PbS colloidal QDs into TiO2 as fast as 6.4 fs,34 points to the capability of extraction of charge generated by MEG. Thus the preparation of cells with colloidal QDs is extremely interesting.. 2. Experimental Section 3.
(4) Colloidal QDs: PbSSe QDs with oleic acid capping were kindly provided by NANOCO, while PbS QDs were purchased from Evident Technologies. Both QDs were solved in toluene. TiO2 photoanode Preparation: After cleaning the FTO glasses (Pilkington TEC 8 with 8 Ω2 sheet resistance), a compact layer of TiO2 was deposited on them by spray pyrolysis of titanium- (IV) bis(acetoacetonato) di(isopropanoxylate) followed by sintering at 450ºC, in order to improve the electrical contact between the nanoparticles. TiO2 photoanodes were prepared by “double-layer” screen-printing on FTO glass using two different TiO2 pastes including a light-scattering layer on top of the transparent TiO2 film. The transparent layer is formed by 20 nm TiO2 nanoparticles (18NR-AO, Dyesol) and the opaque layer contains 300-400 nm TiO2 Particles (WER4-O Dyesol). Finally, the resulting film was sintered again at 450 ˚C for 30 minutes. Total thickness of the photoanodes was 15±1 μm, measured with a profilometer Dektack 6 from Veeco. Electrophoretic Deposition of the QDs on the TiO2 Electrodes: QDs were diluted in toluene, with concentrations of ~ 2.2·10−6 M. Two TiO2 FTO electrodes were immersed vertically in the QDs solution parallel to each other. The deposition area of the electrodes was about 0.25 cm2 and the distance between them was adjusted at 1cm. A voltage of 200 V was applied during 5-90 min. QDs were deposited on both cathode and anode electrodes similar to previous reports.18 Fresh layers at each deposition time were taken out from the electrophoretic cell, rinsed several times with toluene to wash off unbound QDs and subsequently rinsed with ethanol and dried at room temperature. After electrophoretic deposition colloidal QDs were coated with CdS layer grown by SILAR. The SILAR process has been carried out following the method recently described. Cd2+ ions have been deposited from an ethanolic 0.05 M solution of Cd(NO3)2 × 4H20. The sulfide sources were a 0.05 M solutions of Na2S × 9 H2O in methanol/water (50/50 V/V). A single SILAR cycle consisted of 1 minute dip-coating of the TiO2 working electrode into the metal precursors and subsequently rinsed during one minute in ethanol. Subsequently sample is dipped into the sulfide solutions for one minute and rinsed in methanol/water (50/50 V/V) one more minute. This procedure constitutes a complete SILAR cycle. SILAR process has been carried out automatically using a robot designed by ISTest. All the analyzed cells in this work were coated with ZnS, by being alternately dipped into 0.1M Zn(CH3COO)2 and 0.1M Na2S Milli-Q water solutions for 1 min/dip and subsequently rinsed with Milli-Q ultrapure water. Two SILAR cycles were employed for ZnS coating. 4.
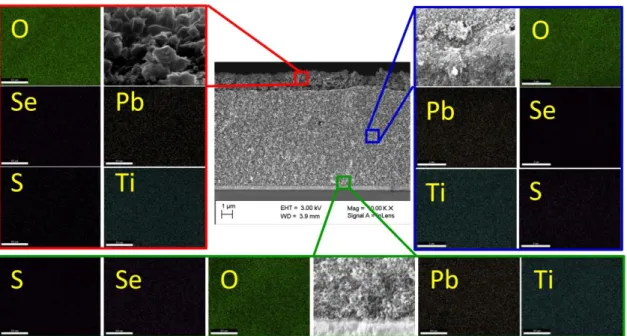
(5) QDSC Preparation: Porous Cu2S was used as counter-electrodes which was prepared by immersing brass in HCl solution at 70°C for 5 min and subsequently dipping it into polysulfide solution for 10 min.19 The counter-electrode and a QD-sensitized electrode were assembled into sandwich type the using a scotch spacer (thickness 50 μm) and with a droplet (10 μl) of polysulfide electrolyte. Polysulfide electrolyte was composed of 1 M Na2S, 1 M S, and 0.1 M NaOH solution in Milli-Q ultrapure water. Photoanode and Solar Cell Characterization: The cross section morphology of the TiO2-PbSeS electrode films was investigated using a field emission scanning electron microscope FE-SEM (ULTRA plus ZEISS FESEM). Energy-dispersive X-ray spectroscopy (Apollo X, Ametek® EDAX) was employed to map and determine the distribution of chemical elements. A Bruker AXS-D8 Advance X-ray diffractometer (XRD), using Cu K radiation, was used to analyze the structural properties of anodes before and after light sensitization. The optical absorption spectra of the photoanodes were recorded at 300-700 nm using a Cary 500 UV vis Varian photospectroscometer. The IPCE measurements were done using a 150 W Xe lamp coupled with a monochromator controlled by a computer; the photocurrent was measured using an optical power meter 70310 from Oriel Instruments, using a Si photodiode to calibrate the system. QDSCs were characterized by current–voltage and impedance spectroscopy using a 0.1256 cm2mask and no antireflective layer. These measurements were performed employing the PG-STAT30 potentiostat (Autolab) and solar simulator at AM1.5 G, where the light intensity was adjusted with an NREL calibrated Si solar cell with a KG-5 filter to one sun intensity (100 mW/cm2). For most of the conditions analyzed in this work more than one cell have been prepared, standard errors have been calculated for these conditions, and included in Tables 1 and 2. In few cases just a single cell was analyzed, in that cases errors are not provided. IS measurements were carried out in dark at different bias voltages with 10 mV AC perturbation over a frequency range of 400 kHz to 10 mHz.. 3. Results and Discussion QDSCs have been prepared in this work by electrophoretic deposition of PbS and PbSeS QDs. It has been shown that PbSeS QDs offer certain benefits with respect to PbS or PbSe QDs in depleted heterojunction solar cells.35 Figure 1, shows a cross section of a PbSeS sensitized TiO2 film prepared by EPD. The double layer structure of TiO2 can be appreciated with a thicker TiO2 transparent layer and a thinner top 5.
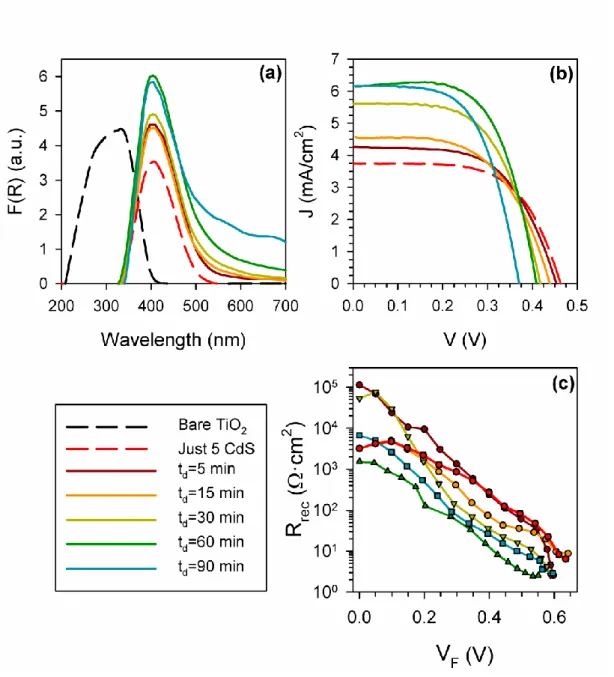
(6) scattering layer. Elementary mapping of Ti, O, Se, S and Pb at three different positions (i.e. sample depths) indicate that the deposition of colloidal PbSeS QDs was uniform along TiO2 thickness, ruling out a preferential deposition on top layer. A rather continuous coating, with no inhomogeneities at nanoscale level, is detected by comparing high magnification SEM micrographs of samples before and after electrophoretic deposition (Figure S1). It is worth to mention that no effect of the electrophoretic deposition time, td, on the coating homogeneity was detected. Solar cells prepared with photoanodes sensitized with PbS and PbSeS QDs show poor stability with polysulfide electrolyte. It has been shown that PbS is photocorroded in polysulfide electrolyte,23 and needs to be protected from direct contact with the electrolyte. This is accomplished in this work by coating of CdS layer, using SILAR technique, on top of PbSeS and PbS QDs deposited by electrophoresis. CdS coating has been demonstrated previously to be an efficient protection of PbS, with a significant enhancement of the solar cell efficiency and stability.29 In this sense, we have used a CdS coating, deposited by SILAR, in order to protect the PbSeS and PbS QDs from the corrosive effect of polysulfide electrolyte, obtaining stable devices. For photoanode sensitization with PbSeS 800 nm different deposition times (td) have been investigated. Hereafter, to distinguish among the different QD sizes analyzed after the QD type (PbS or PbSeS) we will add the wavelength of the first excitonic absorption peak. Figure 2a presents the absorption, in the allowed range of our experimental setup, of differently sensitized TiO2 films: bare TiO2 film, film sensitized just with 5 SILAR cycles of CdS, films sensitized with 800 nm PbSeS QDs plus 5 SILAR cycles of CdS at different deposition times. The absorption of the different samples has been extracted from their diffuse reflectance R and it is expressed in Kubelka-Munk units as F(R)=(1-R)2/2R. For the sensitized electrodes the absorption of TiO2 substrate has been removed. The film sensitized just with CdS exhibits an absorption threshold at 550 nm. When PbSeS QDs are deposited and coated with CdS the absorption threshold red shifts causing light absorption in the red visible region to increase due to a higher colloidal QD loading with deposition time. Figure 2b, shows the current-potential curves obtained for QDSCs using photoanodes with different td, the solar cell parameters corresponding to these cells can be found in Table 1. When colloidal PbSeS QDs are deposited before CdS, the photocurrent of the cells increases due to the higher light harvesting capability provided by PbSeS QDs, see Figure 2a. But, this is associated with a decrease in open circuit 6.
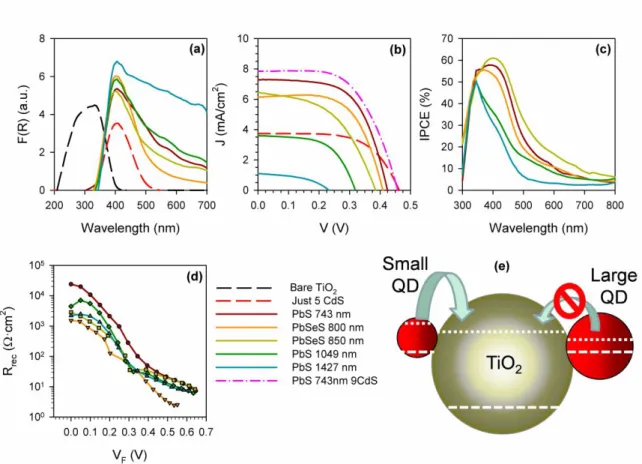
(7) voltage, Voc, as the QD loading increases. It should be expected that the ligands are preserved in the electrophoretic deposition, although the photoinjection is still possible. Efficient photoinjection has been previously reported for devices using colloidal QDs. CdSe QDs capped with TOP directly adsorbed on TiO2 showing an APCE rather high, ~90%,36 and also colloidal QDS attached to TiO2 using linker molecules present significant photocurrent.19, 21, 37 The maximum performance in the analyzed cases has been obtained for td= 60 min. The origin of the decrease of Voc can be understood by the analysis of impedance spectroscopy (EIS) data on the basis of the previously proposed models.38, 39 Samples with different deposition time present the same chemical capacitance, see Supporting Information S2, indicating that the conduction band position and the density of states of TiO2 are not affected by the QD loading. A clear trend in the recombination resistance is observed, Figure 2c. The recombination resistance is seen to decrease with td, indicating unambiguously that PbSeS QDs participate in the recombination process.40 Recombination increases with the QD loading. PbSeS QDs are acting as recombination centers as it has been also observed recently for Sb2S3.41, 42 The observation of this fact is decisive for the future optimization of the QDSCs. On the other hand, the reduction of recombination resistance due to increase in QD loading produces the observed decrease in Voc, which adversely affect on the solar cell performance, see Table 1. Note that both PbSeS colloidal QDs and CdS coating contribute to the final light harvesting. PbSeS QDs are the responsible of light absorption for wavelengths lower than ~550 nm, while for wavelengths higher than ~550 nm both PbSeS QDs and CdS contribute to the light absorption, but with a higher part from CdS, see Figure 2a. We have also analyzed the effect of QD size in the final solar cell performance using PbSeS and PbS QDs of different sizes keeping td constant, see Figure 3. As the first excitonic absorption peak shifts to the IR region, the light absorption in the visible region increases, Figure 3a. But the increase in the light harvesting capability does not translate into greater efficiency of QDSCs, or in an increase of the photocurrent, Jsc, see Figure 3b and Table 2. In fact, a systematic decrease of Voc and Jsc is observed, with the highest efficiency obtained using PbS 743 nm QDs, i.e. the QDs with the smallest size (largest band gap). The relation between the wavelength of the first excitonic absortion peak and PbS QD size is described in Supporting Information S3, using data from reference 43.. 7.
(8) The decrease of solar cell performance with the increase of the size of QDs has two causes. On one hand, the recombination resistance depends on the QD size, see Figure 3d. The sample with PbS 743 nm presents the highest recombination resistance (lowest recombination rate). On the other hand, there is an especially interesting discrepancy between light absorption and incident photon to current efficiency (IPCE), Figure 3c. This discrepancy is clearly manifested for the biggest QDs, PbS 1427 nm. In this case, the sensitized photoanode presents strong light absorption in all the visible region, but practically null IPCE at wavelengths higher than 500 nm. Indicating that PbS is not contributing to the photocurrent. In this case only CdS light absorber is contributing to the photocurrent, as can be observed from the IPCE measurements. This result is in good agreement with the work of Hyun et al.43 In that work it has been shown that PbS QDs with size bigger than 4.3 nm (wavelength of the first excitonic absorption peak: 1116 nm) cannot inject into TiO2 conduction band (CB) as its conduction band is lower than the CB of TiO2, as it is indicated schematically in Figure 3e. As the QD size decreases the band gap increases shifting the PbS CB to higher energies than the TiO2 CB, allowing electron injection from PbS with small size into TiO2. As the quantum confinement increases the energetic distance between both CBs increases too, enhancing the injection driving force and consequently the photocurrent. Having shown that the recombination pathway is preferentially through PbS QDs, and also that depends on the QDs size, recombination in this QDSCs has to be related with QD traps. Note that for PbS 1427 nm QDs, that do not inject electrons into TiO2, the cell performance is significantly lower than for the cell just with 5 CdS SILAR cycles, see Figure 3b. This implies that the PbS QDs act as recombination centers in all the analyzed cases even when they are not able to inject photoexcited electrons into TiO2. On the other hand, PbSeS QDs present lower recombination resistance than PbS indicating a higher recombination rate than their PbS counterparts. Additionally, for the QD size with the highest performance, PbS 743 nm, we have modified the number of CdS SILAR cycles obtaining an efficiency as high as 2.1±0.2% for 9 SILAR cycles (1.8 % for the sample just with 9 SILAR cycles of CdS), see Figure 3b and Table 2. Significantly this efficiency is very close to our previously reported efficiency of 2.21% for a PbS/CdS, both grown by SILAR and using the same TiO2 electrode,29 that conventionally produces solar cells with higher efficiencies than colloidal QDs.44. 8.
(9) 4. Conclusions In summary, we have sensitized nanostructured TiO2 photoanodes with colloidal QDs of PbSeS and PbS with different sizes. We have shown that the electrophoretic deposition method can used advantageously for fast sensitization of the photoanode with these QDs. CdS coating, deposited by SILAR, protects the colloidal QDs stabilizing the solar cell performance. A clear effect between QD size and device performance is observed, obtaining better results for the smallest QDs, with efficiencies as high as 2.1±0.2%. In addition, we have shown unambiguously that QDs act as recombination centers in these QDSCs. There is plenty of room for the optimization of these devices by focusing in reducing recombination though the QD traps. The latter may be possible by improving control on the QD properties, further characterization and surface treatments seem thus to be crucial. As an example, PbSeS sensitized photoanodes were here characterized by X-ray diffraction and the presence of lead oxide (PbO) phase was detected, irrespectively of the td, (Supporting Information S4). Although the origin of oxidation and its final effect in solar cell performance is currently under investigation, this finding points out the wide room of improvement of present lead chalcogenide QDSCs.. Associated Content Supporting Information. FE-SEM micrographs of cross sections of TiO2 and TiO2/PbSSe samples, Chemical Capacitance of the analyzed cells, Correlation between PbS QD size and wavelength of the first excitonic absorption peak, XRD Characterization. This material is available free of charge via the Internet at http://pubs.acs.org.. Authors Information Corresponding Authors *E-mail: [email protected] and [email protected].. Acknowledgement The work is supported by the “Institute of Nanotechnologies for Clean Energies”, funded by the Generalitat Valenciana under project ISIC/2012/008. This work was partially supported by the European Union under the project ORION CP-IP 229036-2, the Ministerio de Educación y Ciencia of Spain under the project HOPE CSD20079.
(10) 00007 (Consolider-Ingenio 2010) and JES-NANOSOLAR PLE2009-0042, by Generalitat Valenciana under project PROMETEO/2009/058, NSERC (Canada) strategic project grant and by McGill University MEDA scholarship. R.T-Z. acknowledges the support of the Program “Ramón y Cajal” of the MICINN. We acknowledge NANOCO for providing kindly PbSeS QDs.. References 1. 2. 3. 4. 5. 6. 7. 8. 9. 10. 11. 12. 13. 14. 15. 16. 17. 18. 19.. 20. 21. 22. 23.. 24.. W. Shockley and H. J. Queisser, J. Appl. Phys., 1961, 32, 510-519. A. J. Nozik, Physica E, 2002, 14, 115-200. R. D. Schaller and V. I. Klimov, Phys. Rev. Lett., 2004, 92, 186601. R. J. Ellingson, M. C. Beard, J. C. Johnson, P. Yu, O. I. Micic, A. J. Nozik, A. Shabaev and A. L. Efros, Nano Lett., 2005, 5, 865-871. M. T. Trinh, A. J. Houtepen, J. M. Schins, T. Hanrath, J. Piris, W. Knulst, A. P. L. M. Goossens and L. D. A. Siebbeles, Nano Lett., 2008, 8, 1713-1718. J. B. Sambur, T. Novet and B. A. Parkinson, Science, 2010, 330, 63-66. O. E. Semonin, J. M. Luther, S. Choi, H.-Y. Chen, J. Gao, A. J. Nozik and M. C. Beard, Science, 2011, 334, 1530-1533. B. O' Regan and M. Grätzel, Nature, 1991, 353, 737-740. L. Grinis, S. Dor, A. Ofir and A. Zaban, J. Photoch. Photobio. A, 2008, 198, 52– 59. I. Mora-Seró, T. Lana-Villarreal, J. Bisquert, A. Pitarch, R. Gómez and P. Salvador, J. Phys. Chem. B, 2005, 109, 3371-3380. M. A. Islam, Y. Xia, D. A. Telesca Jr., M. L. Steigerwald and I. P. Herman, Chem. Mater., 2004, 16, 49-54. S. Jia, S. Banerjee and I. P. Herman, J. Phys. Chem. C, 2008, 112, 162-171. M. A. Islam and I. P. Herman, Appl. Phys. Lett., 2002, 80, 3823-3825. B. Farrow and P. V. Kamat, J. Am. Chem. Soc., 2009, 131, 11124–11131. Q. Zhang, T. Xu, D. Butterfield, M. J. Misner, D. J. Ryu, T. Emrick and T. P. Russell, Nano Lett., 2005, 5, 357-361. P. Brown and P. V. Kamat, J. Am. Chem. Soc., 2008, 130, 8890–8891. J. Chen, W. Lei, C. Li, Y. Zhang, Y. Cui, B. Wang and W. Deng, Phys. Chem. Chem. Phys., 2011, 13, 13182–13184. A. Salant, M. Shalom, I. Hod, A. Faust, A. Zaban and U. Banin, ACS Nano, 2010, 4, 5962–5968. S. Giménez, I. Mora-Seró, L. Macor, N. Guijarro, T. Lana-Villarreal, R. Gómez, L. J. Diguna, Q. Shen, T. Toyoda and J. Bisquert, Nanotechnology, 2009, 20, 295204. I. Robel, V. Subramanian, M. Kuno and P. V. Kamat, J. Am. Chem. Soc., 2006, 128, 2385-2393. I. Mora-Seró, S. Giménez, F. Fabregat-Santiago, R. Gómez, Q. Shen, T. Toyoda and J. Bisquert, Accounts Chem. Res., 2009, 42, 1848-1857. G. Hodes, J. Phys. Chem. C, 2008, 112, 17778-17787. H. J. Lee, H. C. Leventis, S.-J. Moon, P. Chen, S. Ito, S. A. Haque, T. Torres, F. Nüesch, T. Geiger, S. M. Zakeeruddin, et al., Adv. Funct. Mater., 2009, 19, 2735–2742. B. Ma, L. Wang, H. Dong, R. Gao, Y. Geng, Y. Zhu and Y. Qiu, Phys. Chem. Chem. Phys., 2011, 13, 2656-2658. 10.
(11) 25. 26. 27. 28.. 29. 30. 31. 32. 33.. 34. 35. 36. 37. 38. 39. 40. 41. 42. 43.. 44.. H. J. Snaith, A. Stavrinadis, P. Docampo and A. A. W. Watt, Solar Ene., 2011, 85, 1283–1290. K. P. Acharya, E. Khon, T. O'Conner, I. Nemitz, A. Klinkova, R. S. Khnayzer, P. Anzenbacher and M. Zamkov, ACS Nano, 2011, 5, 4953-4964. S. H. Im, H.-J. Kim, S. W. Kim, S.-W. Kimb and S. I. Seok, Energ. Environ. Sci., 2011, 4, 4181–4186. H. J. Lee, P. Chen, S.-J. Moon, F. Sauvage, K. Sivula, T. Bessho, D. R. Gamelin, P. Comte, S. M. Zakeeruddin, S. I. Seok, et al., Langmuir, 2009, 25, 7602–7608. A. Braga, S. Giménez, I. Concina, A. Vomiero and I. Mora-Seró, J. Phys. Chem. Lett., 2011, 2, 454–460. M. Samadpour, P. P. Boix, S. Giménez, A. Iraji Zad, N. Taghavinia, I. MoraSeró and J. Bisquert, J. Phys. Chem. C, 2011, 115, 14400–14407. M. A. Hossain, Z. Y. Koh and Q. Wang, Phys. Chem. Chem. Phys., 2012, 14, 7367-7374. N. Zhou, G. Chen, X. Zhang, L. Cheng, Y. Luo, D. Li and Q. Meng, Electrochem. Comm., 2012, 20, 97-100. E. Kinder, P. Moroz, G. Diederich, A. Johnson, M. Kirsanova, A. Nemchinov, T. O’Connor, D. Roth and M. Zamkov, J. Am. Chem. Soc., 2011, 133, 2048820499. . ang, W. Rodr gue -Córdoba, . iang and T. ian, Nano Lett., 2012, 12, 303−309. W. Ma, J. M. Luther, H. Zheng, Y. Wu and A. P. Alivisatos, Nano Lett., 2009, 9, 1699-1703. S. Giménez, X. Xu, T. Lana-Villarreal, R. Gómez, S. Agouram, Muñoz-Sanjosé and I. Mora-Seró, J. Appl. Phys., 2010, 108, 064310. D. F. Watson, J. Phys. Chem. Lett., 2010, 1, 2299–2309. F. Fabregat-Santiago, G. Garcia-Belmonte, I. Mora-Seró and J. Bisquert, Phys. Chem. Chem. Phys., 2011, 13, 9083–9118. V. Gónzalez-Pedro, X. Xu, I. Mora-Seró and J. Bisquert ACS Nano, 2010, 4, 5783–5790. Hod, V. González-Pedro, Z. Tachan, F. Fabregat-Santiago, I. Mora-Seró, J. Bisquert and A. Zaban, J. Phys. Chem. Lett., 2011, 2, 3032–3035. P. P. Boix, G. Larramona, A. Jacob, B. Delatouche, I. Mora-Seró and J. Bisquert, J. Phys. Chem. C, 2012, 116, 1579–1587. P. P. Boix, Y. H. Lee, F. Fabregat-Santiago, S. H. Im, I. Mora-Seró, J. Bisquert and S. I. Seok, ACS Nano, 2012, 6, 873–880. B.-R. Hyun, Y.-W. Zhong, A. C. Bartnik, L. Sun, H. D. Abruña, F. W. Wise, J. D. Goodreau, J. R. Matthews, T. M. Leslie and N. F. Borrelli, ACS Nano, 2008, 2, 2206-2212. N. Guijarro, T. Lana-Villarreal, Q. Shen, T. Toyoda and R. Gómez, J. Phys. Chem. C, 2010, 114, 21928–21937.. 11.
(12) Figure 1. SEM analysis of a nanostructured TiO2 sensitized with PbSeS QDs, td=60 min. The central picture of a photoanode cross section is surrounded by a magnified image and elemental maps of the three square boxes in the central picture. Elemental maps display Ti, O, Pb, Se and S spatial elemental distribution.. 12.
(13) Figure 2. Effect of the electrophoretic deposition time, using 800 nm PbSeS QDs, in a) Kubelka-Munk plot of the diffuse reflectance spectra for bare TiO2 film and TiO2 sensitized just with 5 SILAR cycles of CdS and with 800 nm PbSeS QDs plus 5 SILAR cycles of CdS; in b) J-V curve and in c) recombination resistance.. 13.
(14) Figure 3. Effect of the QDs using the same electrophoretic deposition time, 60 min, in a) Kubelka-Munk plot of the diffuse reflectance spectra for bare TiO2 film and TiO2 sensitized just with 5 SILAR cycles of CdS and with 800 nm PbSeS QDs plus 5 SILAR cycles of CdS; in b) J-V curve; in c) IPCE; and in d) recombination resistance. e) Squeme of the relative alignment of the conduction band (dotted lines) of TiO2 and PbS/PbSeS QDs depending on the QD size, relative Valence bands (dashed lines) are also included as reference.. 14.
(15) Tables:. Table 1. Solar cell parameters of QDSCs prepared employing PbSeS 800 nm QDs and different electrophoresis deposition time. Open circuit voltage, Voc, short circuit current, Jsc, fill factor, FF, and photovoltaic conversion efficiency, η. η. PbSeS. Voc. Jsc. FF. 800. (V). (mA/cm2). 5CdS. 0.46. 3.7. 0.62. 1.07. 5min. 0.46±0.04. 4.3±0.5. 0.58±0.03. 1.14±0.14. 15min. 0.440±0.15 5±1. 0.56±0.01. 1.1±0.3. 30min. 0.42±0.2. 5.6±0.6. 0.593±0.005 1.4±0.2. 60min. 0.41±0.2. 6.14±0.5. 0.63±0.01. 1.58±0.16. 90min. 0.37. 6.2. 0.60. 1.36. (%). nm[a]. [a] 5CdS is a sample prepared with no PbSeS QDs and just 5 SILAR cycles of CdS and 2 SILAR cycles of ZnS. The rest of the samples are identified by the PbSeS electrophoresis deposition time, in addition all these samples have also been coated with 5 SILAR cycles of CdS and 2 SILAR cycles of ZnS.. Table 2. Solar cell parameters of QDSCs prepared employing QDs of different type and size. All the samples present the same electrophoresis deposition time, 60 min, and CdS/ZnS coating, 5 and 2 SILAR cycles respectively, except the last one with 9 and 2 SILAR cycles. Sample prepared just with 9 SILAR cycles of CdS is included for comparison. Open circuit voltage, Voc, short circuit current, Jsc, fill factor, FF, and photovoltaic conversion efficiency, η. td=60 min. Jsc. (V). (mA/cm2). PbS 743 nm. 0.425±0.15. 7.3±0.7. 0.61±0.03. 1.9±0.2. PbSeS 800nm. 0.41±0.2. 6.14±0.5. 0.63±0.01. 1.58±0.16. PbSeS 850nm. 0.39. 6.4. 0.49. 1.2. PbS 1049nm. 0.322±0.015 3.6±0.8. PbS 1427nm. 0.234±0.010 1.09±0.12 0.46±0.02. PbS. 743. nm 0.46±0.07. FF. η. Voc. (%). 0.584±0.014 0.67±0.14. 8±2. 0.58±0.03. 15. 0.1235±0.0003 2.1±0.2.
(16) 9CdS 9CdS. 0.515. 5.79. 0.60. TOC figure:. 16. 1.8.
(17)
Figure
Documento similar
No obstante, como esta enfermedad afecta a cada persona de manera diferente, no todas las opciones de cuidado y tratamiento pueden ser apropiadas para cada individuo.. La forma
The expansionary monetary policy measures have had a negative impact on net interest margins both via the reduction in interest rates and –less powerfully- the flattening of the
Jointly estimate this entry game with several outcome equations (fees/rates, credit limits) for bank accounts, credit cards and lines of credit. Use simulation methods to
Solar cells with the CZTS absorber layers annealed at different heating rates were fabricated by using a CdS buffer layer deposited by chemical bath
At the same time, higher values of the quantum efficiency were found in the photocatalytic degradation of phenol, methyl 4-hydroxybenzoate and 4-chlorophenol with P25, whereas in
In the previous sections we have shown how astronomical alignments and solar hierophanies – with a common interest in the solstices − were substantiated in the
The newly formed FAPI-PbS QDs are dissolved in FAPI solution for the fabrication of perovskite thin films for the characterization and device applications
substituents at the α positions of the macrocycle in 1^a not only avoid the aggregation among the Pc dyes but also prevent the interaction with other dyes. By comparing for the
