Screening of polyphenolic compounds in Piper trioicum (Roxb ) extracts
8
0
0
Texto completo
(2) Ars Pharmaceutica Screening of polyphenolic compounds in Piper trioicum (Roxb.) extracts Dinakaran Sathis Kumar1, Avasarala Harani2, Banji David3, Mandarapu Veena3 1. Aditya Institute of Pharmaceutical Sciences and Research, Surampalem, Andhra Pradesh, (India). 2. College of Pharmaceutical Sciences, Andhra University, Visakhapatnam, Andhra Pradesh, (India). 3. Nalanda College of Pharmacy, Nalgonda – 508001, Andhra Pradesh, (India).. Original Paper Artículo Original Correspondence/Correspondencia: D. Sathis Kumar, Aditya Institute of Pharmaceutical Sciences and Research, Surampalem, Andhra Pradesh, India-533437. E-mail: [email protected] Competing interest / Conflicto de interes: The authors report no conflicts of interest. The authors alone are responsible for the content and writing of this paper. Fundings / Financiación: Not declared Received: 03.03.2014 Accepted: 25.05.2014. RESUMEN Objetivo: El presente estudio tiene como objetivo revelar el contenido de polifenoles en extractos de Piper trioicum ( Roxb. ). Materiales y métodos: El contenido de fenoles totales en los extractos etanólicos y acuosos de Piper trioicum ( Roxb. ) se determinó mediante técnicas cromatografías, como la cromatografía en capa fina, cromatografía en capa fina de alto rendimiento, cromatografía líquida de alta resolución y cromatografía de gases con espectrometría de masas detección. El contenido de fenoles totales se determinó por el método UV. Resultados: Los resultados de los métodos de análisis se compararon con compuestos fenólicos estándar . Los extractos de etanol tienen un contenido mayor de fenoles totales ( 2.323mg GAE / g ) que los extracto acuosos. Se han identificado 13 compuestos por técnicas de cromatografía . Los resultados sugirieron que arbutina, quercetina, ácido caféico, ácido ferúlico, ácido clorogénico, ácido gálico y sus derivados puede estar presente en los extractos etanólicos y acuoso de Piper trioicum Conclusiones: El agua y el etanol podrían extraer la mayor concentración de polifenoles de la planta Piper trioicum (Roxb); estos extractos pueden tener una buen potenci farmacológico debido a la presencia de compuestos fenolicos. PALABRAS CLAVE: Compuestos fenolicos totales, Cromatografia en capa fina, Cromatografia liquida de alta resolución, Piper trioicum.. ABSTRACT Aims: Present study aims to reveal the polyphenol content in Piper trioicum (Roxb.) extracts. Materials and methods: In the present study, the phenolic content of the ethanol and water extracts of Piper trioicum (Roxb.) plants was determined by chromatography techniques like Thin layer chromatography, high performance thin layer Chromatography, high performance liquid chromatography and Gas chromatography with Mass spectrometric detection. Total phenol was determined by UV method. Results: All the results of analytical methods were compared with standard phenolic compounds. The ethanol extract contained maximum total phenolic content (2.323mg GAE/g) than the water extract. 13 compounds identified by chromatography techniques. The results suggested Arbutin, quercetin, caffeic acid, Ferulic acid, chlorogenic acid, Gallic acid and its derivatives may be present in ethanolic and water extracts of Piper trioicum. Conclusions: The water and ethanol could extract the highest concentration of polyphenols from the Piper trioicum (Roxb) plant; these extracts may have a good pharmacological potency due to the presence of polyphenols compounds. KEY WORDS: High-performance liquid chromatography, Piper trioicum, chromatography, Total phenolics compounds.. 28. Thin layer. Ars Pharm. 2014; 55(3): 27-34..
(3) Screening of polyphenolic compounds in Piper trioicum (Roxb.) extracts. INTRODUCTION Phenolic compounds have been the subject of intense research in recent years due to their potential beneficial effects on human health. The phenolic compounds are secondary plant metabolites that are contained within the skin, seed, and flesh of grapes and even are extracted into wines (especially red) during the process of vinification1. Piper trioicum (Roxb.) is an herb, shrubs, or climbers, rarely trees, usually aromatic of the Piperaceae family is distributed in south Asian countries2, 3. The whole plant is used as rubefacient, diuretic, hepatoprotective and used for diabetes, muscular pains, headache, toothache and internal remedy for cholera in folk medicine; the root is used as diuretic3. The pharmacognostic parameters of P.trioicum were reported for the identification and standardization of a crude drug and phytochemical investigation of P.trioicum revealed that extracts of P.trioicum showed the presence of alkaloids, steroids, flavonoids, phenolic compounds, carbohydrates, tannins and Glycosides4,5. High performance thin layer chromatography (HPTLC), Gas chromatography (GC) and high-performance liquid chromatography (HPLC) are commonly used to determine qualitatively and quantitatively single phenols. This all analytical techniques are often preferred due to sufficiently sensitive and precise. However, since HPLC methods generally use UV detection and many phenols show UV spectra with λmax in a narrow range (280–320 nm), different and often some treatments are required prior to the HPLC analysis, in order to prevent interferences. However, GC has its limitations since it relies on the comparison of characteristic chromatographic retention times with authentic standards. On the other hand, the use of GC with mass spectrometry (GC–MS) detection provides useful structural information and allows for tentative compound identification when standard reference compounds are unavailable and when peaks have similar retention time6. There is, however, no report concerning the phenolic content of the P. trioicum In the present investigation, Solvents like ethanol and water extracts of air dried P. trioicum plant was used to determine their phenolic content using TLC, HPTLC, HPLC and GC/ MS. MATERIALS AND METHODS Plant material of P. trioicum was collected from local areas of Talakona, Andhra Pradesh and plant was identified by Mr. Madhavachetty, Botanist, S. V. University, Thirupati, and Andhra Pradesh. The plant was dried in the shade and ground into a uniform powder using a milling machine. Petroleum ether, chloroform, ethanol was purchased from SD Fine chemicals Ltd., (India). Chemicals used for determination of contents of total phenols using TLC and Ars Pharm. 2014; 55(3): 27-34.. HPTLC such as Toluene, Acetone, Formic acid, Sodium carbonate and Folin CIOcalteu reagent were obtained from Sigma, Merck and SD Fine chemicals Ltd. Chemicals employed for HPLC assays such as HPLC grade acetonitrile, water and concentrated phosphoric acid were purchased from SD Fine Chemicals Ltd. The extracts of P. trioicum were prepared by successive soxhlation with various solvents. The shade dried whole plant powder was packed in thimble kept in the soxhlet apparatus and extraction was allowed to run successively using the solvents, petroleum ether (60±800C), chloroform and ethanol. Finally, the Marc was dried and macerated with chloroform-water for 24 hours to obtain the aqueous extract. Petroleum ether and chloroform were used for defat the final extract. Only ethanol and aqueous extract were concentrated by evaporating the solvent and the obtained extracts were weighed. The physical characteristics and percentage yield of various extracts were reported. The dried extracts of all solvent were in desiccator prior to analysis. Qualitative determination of phenolic compound was determined by thin layer chromatography technique. Two extracts were dissolved their respective solvents and spotted on TLC plates (silica gel GF plates). The plates were developed in Toluene-Acetone-Formic acid (4.5 : 4.5 : 1) for the determination of phenolic compound. After developing the plate they were dried and the resolution of components of extracts were studied by locating various spots on chromatogram using Folin CIO-calteu reagent. Measure and record the distance of each spot from the point of its application and calculate the Rf. Value7, 8. Total phenolic content was analyzed spectrophotometrically by a modified Folin-Ciocalteu colorimetric method. 0.125 ml of all the extracts (1:10 g/ml) was taken in each test tube. 1.5 ml of water and 0.125 ml of Folin-ciocalteu reagent were added and allowed to stand for 6 min. 1.25 ml of 7% sodium carbonate and 3ml of water were added into each mixture, then allowed to stand for 90min at room temperature. After the color formation, the absorbance was measured at 769 nm using Elico UV- Visible spectrophotometer. Gallic acid was used to prepare a standard curve (0.2 to 10μg/ ml; y=0.06218x+0.131; r2 = 0.9850; y is the absorbance; x is the solution concentration). The results were expressed as milligrams of Gallic acid equivalents (GAE) per gram of powdered crude drug9. HPLC (isocratic) method for phenolic compounds was analyzed by the following method. An isocratic HPLC system (Analytical Technologies Ltd) consisting of a model ALC 2010 high pressure pump and a model ASPD 2600 variable wavelength detector (UV-Vis) was used. Manual 29.
(4) Kumar DS, Harani A, David B, Veena M.. injections were made using a Rheodyne Injectable valve (20 μL loop). The detector wavelength was set at 254 nm. The chromatographic separations were performed at ambient temperature on a Gracesmart RP18, 5μ (250 mm x 4.6 mm). The mobile phase was a mixture of acetonitrile, water and concentrated phosphoric acid (400:600:5), filtered and degassed prior to use and flowing at the rate of 0.8ml/min. The measurements were performed at room temperature. The duration of each analysis was 37.5min. The data were collected and analyzed with analyst & crystal software in a computer system. About 2g of selected extracts of this plant was placed into a 50mL flask and extracted with 70% aqueous methanol solution (50mL) by boiling with reflux for 2h on a water bath. After cooling, the extract was filtered through a paper filter into a 100mL measuring flask and was subsequently made up to the mark with the same solvent and sonicated for 15 min. Then the solution was filtered through 0.45 μ filter porosity membrane filter prior to injection. The sample components were identified by comparison of their retention times to those observed in the chromatograms of reference solutions which were collected from the library data. The relative content of each component was determined by measuring the area under the corresponding peak and using the method of internal normalization10. HPTLC Analysis of Plant Samples for Phenolic Profile was analyzed by the following. The water and ethanol Plant extracts were dissolved in 1ml of appropriate solvents and centrifuged at 3000rpm for 5min. The same procedure was followed for the reference standards such as Quercetin, Rutin, Gallic acid and Kaempferol. These solutions were used as a test solution for HPTLC analysis. 2µl of the above test solutions were loaded as 5mm band length in the 5 x 10cm Silica gel 60F254 TLC plate using a Hamilton syringe and Camag Linomat 5 instruments. The samples loaded plate was kept in TLC twin trough developing chamber (after saturated with Solvent vapor) with the mobile phase of Toluene-Acetone-Formic acid (4.5: 4.5: 1) and the plate was developed in the same mobile phase up to 90mm. The developed plate was dried by hot air to evaporate solvents from the plate. The plate was kept in Photo-documentation chamber (Camag Reprostar 3) and captured the images at White light, UV 254nm and UV366nm. Before derivatization, the plate was fixed on scanner stage (Camag TLC Scanner 3) and scanning was done at UV 254nm. The Peak table, Peak display and Peak densitogram were noted. Then the developed plate was sprayed with 20% Sodium carbonate solution sprayed and brief dried followed by Folin CIO-calteu reagent and dried at 100°C in Hot air oven. The plate was photo-documented at Day light using Photo-documentation (Camag Reprostar 3) chamber7, 8. 30. Determination of Phenolic compounds is determined by a gas chromatography machine (JEOL GC mate) was included a column (DB-5, 30m x 0.25mm ID. X 0.25µm film thickness) and conditioned with inlet of 220 °C, 1.0µl split ratio (10:1), oven temperature of 80°C held for 1 min and then increased to 300°C at 10°C/min held for 5 min, a flow rate of helium gas carrier at 1.0 min/min. A mass spectrometry detector (Varian Saturn 2000, MS ion trap 150 °C, MS source 230°C) was connected on-line to the GC machine. Data was acquired using ChemStation program. Identification of phenolic compounds was carried out by comparison of their retention time and MS spectra with data from the database of SDBS (Spectral database system, National Institute of Advanced Industrial Science and Technology (AIST), Japan)11 and Mass Bank12. The name, molecular weight and structure of the components of the test materials were ascertained. 2 g of the extracted were dissolved in methanol. The extracts were then filtered through Whatmann filter paper No.41 along with 2 gm sodium sulfate to remove the sediments and traces of water in the filtrate. Before filtering, the filter paper along with sodium sulphate was wetted with methanol. The filtrate was then concentrated by bubbling nitrogen gas into the solution. 2μl of these solutions was employed for GC/MS analysis13. RESULTS The extraction yield of all extracts was found to be 1.8% and 3.8%w/w for ethanol and aqueous extract respectively. Then P.trioicum extracts were investigated for their total phenolic compounds using TLC and UV. The report of TLC was shown that ethanol extract possesses two spots those Rf values were 0.2 and 0.7; aqueous extract consists Rf values of 0.7 and 0.68 respectively. The results of phenolic content by UV Visible spectroscopy was expressed by mean±standard deviation. The milligrams of Gallic acid equivalents (GAE) per gram of ethanol and aqueous extract were found to be 2.323±0.03 and 0.257±0.002 respectively. The ethanol extract contained maximum total phenolic content (2.323mg GAE/g) than the water extract. RP-HPLC coupled with UV-Vis detector was employed to separate, identify and quantify phenolic compounds in the ethanol and aqueous extracts of P.trioicum. The ethanol and aqueous extract under study showed little variations in their content of the different phenolic compounds and nearly 13 compounds were identified. In general, Arbutin, Ferulic acid, Gallic acid, Umbelliferone, Herniarin, Rutin, Cinnamic acid and Hyperoside were major phenolic compounds in the herb of ethanol and water extracts; Ethanol extract has Chlorogenic acid, Ellagic acid and Caffeic acid; Vanillin and Salicylic acid were present in Ars Pharm. 2014; 55(3): 27-34..
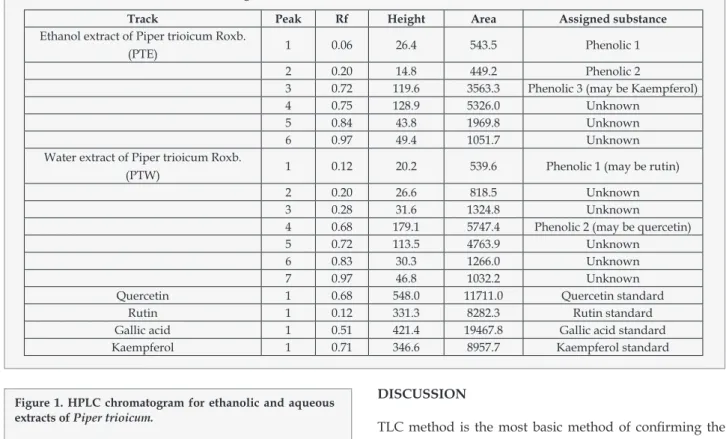
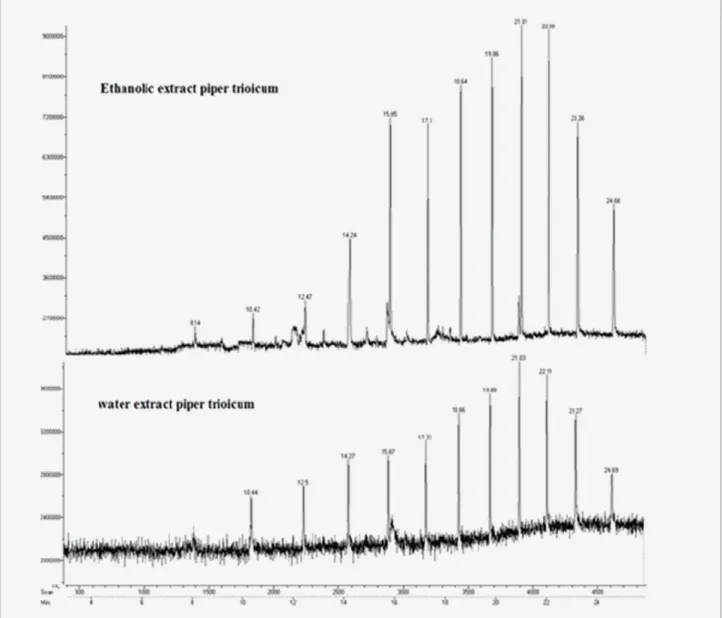
(5) Screening of polyphenolic compounds in Piper trioicum (Roxb.) extracts. Tabla 1. Retention time and Relative content of extracts by HPLC. Compounds Minutes Arbutin Ferulic acid Vanillin Chlorogenic acid Gallic acid Salicylic acid Caffeic acid Umbelliferone Herniarin Hyperoside Rutin Cinnamic acid Ellagic acid. Standard Retention time 3.73 4.37 5.29 5.35 5.69 5.95 6.12 8.65 9.31 10.66 17.58 19.76 27.16. Ethanolic extract Retention time Relative content % 3.78 37.1 4.30 14.0 5.39 2.1 5.78 2.5 6.24 1.7 8.59 0.3 9.43 0.3 10.44 0.2 17.0 0.3 20.8 0.3 28.19 0.1. aqueous extracts; Other than these peaks, some other peaks were also observed in both extracts. In ethanolic extract, Retention time(Relative content) of 1.11(0.1), 3.04(29.7), 4.17(2.9), 4.87(1.4), 5.11(3.6), 7.09(1.3), 7.73(1.1), 8.93(0.4), 9.82(0.3), 12.35(0.1) and 18.35(0.2) were found for other unidentified peaks. In aqueous extract, Retention time (Relative content) of 2.99(5.8), 3.09(36.5), 4.06(16.9), 4.28(3.5), 4.96(20.9), 7.21(6.9), 9.92(0.4) and 12.45(0.1) were found for other unidentified peaks. Table 1 was expressed the retention time and relative content of identifying phenolic compounds by HPLC. Figure 1 expressed the HPLC of both extracts. HPTLC coupled with CAMAG TLC SCANNER 3 was employed to separate, identify and quantify phenolic compounds in the ethanol and aqueous extract of P.trioicum. Blue colored zone at Day light mode present in the given standard and sample tracks observed in the chromatogram after derivatization, which may be the presence of Phenolics in the given samples. The concentrations were determined by calculating the spot areas which are proportional to the amount of analyte in a peak and presented. In an aqueous extract totally 7 spots were appearing among those two were found to be phenols which is a similar Rf value of rutin and quercetin. In ethanol extract, totally 6 spots were appearing among those three were found to be phenols and among three, one spot was coincided with the Rf value of kaempferol. Table 2 were expressed the results of HPTLC for the determination of phenol in P.trioicum Extract compare with the Standards. Figure 2 shows the Peak densitogram display of HPTLC chromatogram of P.trioicum ethanol and aqueous extracts respectively. GC-MS analysis of the products of phenolic compounds showed the presence of 12 compounds in both ethanolic and water extracts of P.trioicum, among this except compound 1 remaining products present in both extracts. Compound Ars Pharm. 2014; 55(3): 27-34.. Aqueous extract Retention time Relative content % 3.8 9.5 4.43 9.4 5.28 3.0 5.51 3.0 5.90 4.4 8.69 1.6 9.52 0.4 10.55 0.3 17.10 0.2 20.89 0.5 -. Figure 1. HPLC chromatogram for ethanolic and aqueous extracts of Piper trioicum.. 1 was present only in ethanolic extract. Figure 3 shown the overlap Gas chromatography report of ethanolic and water extracts of P.trioicum. Table 3 expressed the GCMS reports for both extracts of P.trioicum. Identification of phenolic compounds was carried out by comparison of their MS spectra with data from the database of SDBS (Spectral database system, National Institute of Advanced Industrial Science and Technology (AIST), Japan) and Mass Bank (www.massbank.jp/jsp). The results suggested Arbutin, quercetin, caffeic acid, Ferulic acid, chlorogenic acid, Gallic 31.
(6) Kumar DS, Harani A, David B, Veena M.. Tabla 2. The result of HPTLC chromatogram. Track Ethanol extract of Piper trioicum Roxb. (PTE). Water extract of Piper trioicum Roxb. (PTW). Quercetin Rutin Gallic acid Kaempferol. Peak. Rf. Height. Area. Assigned substance. 1. 0.06. 26.4. 543.5. Phenolic 1. 2 3 4 5 6. 0.20 0.72 0.75 0.84 0.97. 14.8 119.6 128.9 43.8 49.4. 449.2 3563.3 5326.0 1969.8 1051.7. Phenolic 2 Phenolic 3 (may be Kaempferol) Unknown Unknown Unknown. 1. 0.12. 20.2. 539.6. Phenolic 1 (may be rutin). 2 3 4 5 6 7 1 1 1 1. 0.20 0.28 0.68 0.72 0.83 0.97 0.68 0.12 0.51 0.71. 26.6 31.6 179.1 113.5 30.3 46.8 548.0 331.3 421.4 346.6. 818.5 1324.8 5747.4 4763.9 1266.0 1032.2 11711.0 8282.3 19467.8 8957.7. Unknown Unknown Phenolic 2 (may be quercetin) Unknown Unknown Unknown Quercetin standard Rutin standard Gallic acid standard Kaempferol standard. Figure 1. HPLC chromatogram for ethanolic and aqueous extracts of Piper trioicum.. acid and its derivatives may be present in ethanolic and water extracts of P. trioicum.. 32. DISCUSSION TLC method is the most basic method of confirming the presence of phenolic compound. Results on Rf value of TLC expressed the presence of phenolic compound in our extracts. From the results of TLC and UV, The levels of these components in the various solvent extracts of the P.trioicum also showed differences. Shahidi and Naczk (1995) reported that the usage of Folin-Ciocalteu reagent also was measured based on the color measurement which was non-specific on phenol14. Perhaps there were other components that can react with the reagent such as ascorbic acid. Besides, various phenolic compounds have different response to this assay15. However, the measurement of color changes after two hours storage could be used to determine the existence of phenol in samples. This may due to the antioxidant properties of plant extract that react as reducing agent which known as redox action. Perez et al (2007) found that the rosemary methanol extract had higher phenolic contents than its water extract16. Different levels reported in these studies may be attributed to the procedures and standards used to express as total phenolic contents used by individual groups of investigators. Based on the report of TLC and UV, ethanol and water extracts contain remarkable levels of phenols. HPLC analyses showed that these phenolic compounds belong for the most part to flavonoids and derivatives of phenol carboxylic acid. We have established that P.trioicum contains a rich complex of biologically active compounds of phenolic nature. 12 compounds in both Ethanolic and water extracts of P.trioicum were identified by GC-MS analysis.. Ars Pharm. 2014; 55(3): 27-34..
(7) Screening of polyphenolic compounds in Piper trioicum (Roxb.) extracts. Compounds. Peak retention time. M/z ratio. Most abundant peaks (base) ethanolic. Plant Extract. Compound derivatives may be. Tabla 3. The GCMS reports for ethanolic & water extracts of Piper trioicum Roxb.. 1. 8.15. 423, 336, 320, 298, 203, 144, 88, 71. 336,. ethanolic. Ferulic acid or quercetin derivatives. 2. 10.43. 496, 409, 322, 276, 144, 88, 71. 276,. 3. 12.49. 483, 409, 395, 350, 276, 217, 144, 88, 71. 350,. 4. 14.24. 505, 469, 423, 350, 276, 217, 144, 71. 423,. 5. 15.85. 496, 423, 350, 276, 217, 144, 71. 144,. 6. 17.32. 570, 528, 496, 423, 350, 276, 217, 144, 71. 350,. 7. 18.64. 570, 528, 496, 423, 350, 276, 217, 203, 144, 71. 350.22,. 8. 19.86. 601, 556, 528, 496, 423, 350, 276, 217, 203, 144, 71. 217.47,. 9. 21.01. 570, 528, 496, 423, 350, 276, 217, 144, 71. 350.22,. 10. 22.09. 570, 496, 423, 350, 319, 276, 217, 190, 160, 132, 102, 88, 71. 217.47. 11. 23.26. 643, 496, 423, 350, 276, 217, 144, 71. 217.47. 12. 24.66. 570, 496, 423, 350, 276, 217, 144, 71. 217.47. CONCLUSION In this investigation, we concluded that water and ethanol could extract the highest concentration of polyphenols from the Piper trioicum Roxb plant; these extracts may have a good pharmacological potency due to the presence of polyphenols compounds. So further studies are required to confirm its pharmacological potency, by that we can assure its potential for exploitation to promote human and animal health. ACKNOWLEDGEMENT: We are grateful to the Management, Nalanda College of Pharmacy, Nalgonda, Andhra Pradesh for their valuable support.. Ars Pharm. 2014; 55(3): 27-34.. Ethanolic & water Ethanolic & water Ethanolic & water Ethanolic & water Ethanolic & water Ethanolic & water Ethanolic & water Ethanolic & water Ethanolic & water Ethanolic & water Ethanolic & water. quercetin derivatives Caffeic acid or chlorogenic acid derivative Caffeic acid or chlorogenic acid derivative Arbutin or ferulic acid or gallic acid derivatives chlorogenic acid derivative quercetin or chlorogenic acid derivatives Caffeic acid or ferulic acid derivative chlorogenic acid derivative Caffeic acid or ferulic acid derivative chlorogenic acid derivative quercetin derivatives. REFERENCES 1. Vinas P, LopezErroz C, Marin-Hernandez JJ, HernandezCordoba M. Determination of phenols in wines by liquid chromatography with photodiode array and fluorescence detections. J. Chromatogr. A. 2000; 871: 85-93. 2. Khare CP. Indian Medicinal Plants - An illustrated dictionary. New Delhi: Springer (India) private limited; 2007. 3. Madhava Chetty K, Sivaji K, Tulasi RK. Flowering plants of Chittoor district, Andhra Pradesh, India. Tirupati:Students offset printers; 2008. 4. Sathis kumar D, Veena Mandarapu, David Banji, Rao KNV, Chandrashekar, Sudhakar K, Sandhya S, Prashanthi G, Vidya sravanthi E. Pharmacognostical Study on Piper Trioicum Roxb. International journal of pharmacy and pharmaceutical sciences, 2011; 3(3):129-132. 5. Sathis kumar D, Raju SN, Harani A, David Banji, Rao KNV,. 33.
(8) Kumar DS, Harani A, David B, Veena M.. Figure 3. Gas chromatography report of ethanolic and water extracts of Piper trioicum.. Otilia Banji. Alpha-glucosidase inhibitory and hypoglycemic activities of Piper trioicum. Journal of natural remedies, 2011; 11/1: 31-38. 6. Minuti L, Pellegrino RM, Tesei I. Simple extraction method and gas chromatography–mass spectrometry in the selective ion monitoring mode for the determination of phenols in wine. J. Chromatogr A, 2006; 1114: 263-268. 7. Wagner H, Bladt S. Plant Drug Analysis, A Thin Layer Chromatography Atlas, New York:Springer publications; 2004. 8. Egon Stahl. Thin layer chromatography, A Laboratory Handbook, New York:Springer publications; 2007. 9. Singleton VL, Orthofer R, Lamuela Raventos RM. Analysis of total phenols and other oxidation substrates and antioxidants by means of Folin-Ciocalteu reagent. Methods Enzymol, 1999; 299: 152–178. 10. Bubenchikova VN, Drozdova IL. HPLC analysis of phenolic compounds in yellow sweet-clover, Pharmaceutical chemistry Journal, 2004; 38(4): 195-196.. 34. 11. Mass bank, [cited 1st March 2012]. Available at: Available at: www.massbank.jp/jsp. 12. Spectral database system, National Institute of Advanced Industrial Science and Technology (AIST), Japan. [Cited 1st March 2012]. Available at: www.aist.com 13. Praveen Kumar P, Kumaravel S, Lalitha C. Screening of antioxidant activity, total phenolics and GC-MS study of Vitex negundo. African Journal of Biochemistry Research. 2010; 4(7): 191-195. 14. Shahidi F, Naczk M. Methods of analysis and quantification of phenolic compounds. Food phenolic: sources, chemistry, effect and applications. Lancester: Technomic Publishing Co. Inc. PA; 1995. 15. Singleton VL, Rossi JA. Colorimetry of total phenolic substances. US: American Chemical Society Symposium series 1965; 26: 47-70. 16. Perez MB, Galderon NL, Croci CA, Radiation induced enhancement of antioxidant activity in extracts of rosemary (Rosmarinus officinalis L.). Food chemistry. 2007; 104: 585-592.. Ars Pharm. 2014; 55(3): 27-34..
(9)
Figure


Documento similar
3.3 Lipid indices of the fatty acid profile of insects and insect extracts 346. Taking into account the significant modification of the fatty acid profile observed
This effect could be explained by an increase in the concentration of carnosic acid observed in the SR extracts, which was around 10-20% greater than the
Yield (Y) expressed as mass recovered / mass of licorice phytochemicals feed, total phenolic compounds content (TPC) expressed as GAE (mg of gallic acid
Ethanol extracts (EE) from fenugreek and quinoa seeds with different total content of inhibitory 17.. compounds (TIC, total saponin plus phenolic) were prepared with
Secondly, extracts of SCAB cultivated for 60 days were preserved by refrigeration, freezing, freeze- drying, refrigeration + benzoic acid, freezing + benzoic acid,
Martinez et al., (2011), studied the leaching kinetics of low-grade kaolin in oxalic acid solutions; the study variables were temperature, acid concentration and particle size
Twenty-five compounds were detected, eighteen of which were flavonoids, one phenolic acid, five ter- pene lactones and one unknown compound.. Among the quantified phenolic
The hypothesis tested in this study was that there are no differences in decalcifying capacity of solutions of 15% EDTA, 15% citric acid, 5% phosphoric acid and that 2.5%
